One of the most fundamental changes resulting from the Financial Crisis was the transfer of mortgage risk from banks to taxpayers.
By Wolf Richter for WOLF STREET.
Mortgage balances rose by $98 billion (+0.7%) in Q4 from Q3, to $13.2 trillion, according to the Household Debt and Credit Report from the New York Fed, which obtained this data via its partnership with Equifax.
Year-over-year, mortgage balances rose by $564 billion (+4.5%). Since the beginning of 2020, mortgage balances have surged by 38%, while home prices have surged by 53% over the same period.
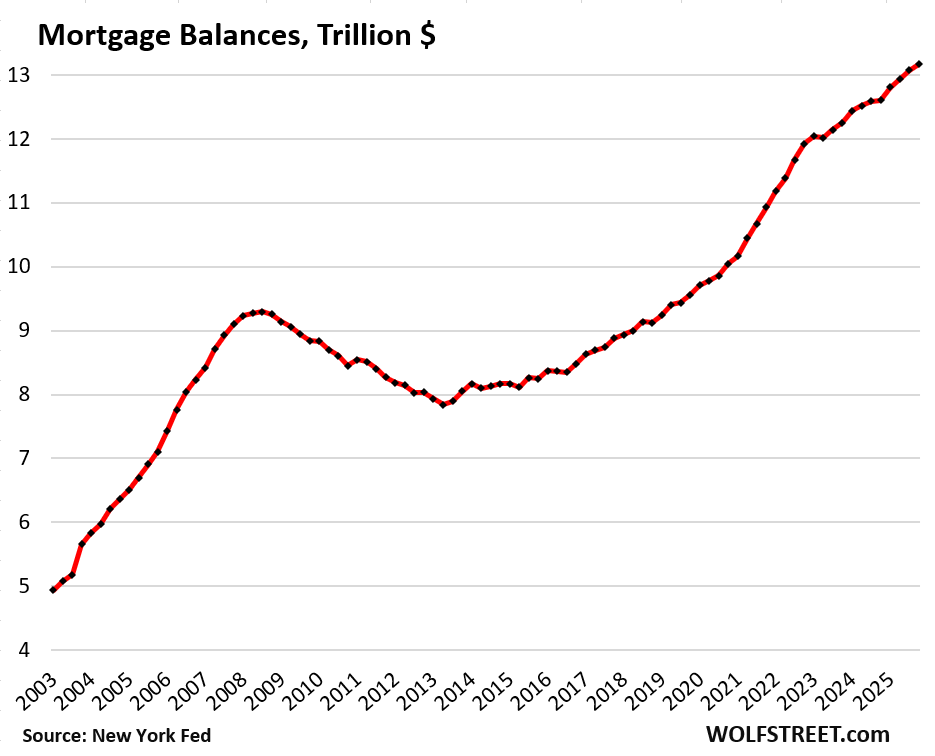
Overall mortgage balances grow as a result of several factors: When a buyer finances the purchase of a newly constructed home (growth of the housing stock); when the seller of an existing home has a small or no mortgage (40% of the homes are owned without mortgage), and the buyer takes on a new big mortgage; and when a homeowner does a cash-out refinance of an existing mortgage, thereby ending up with a bigger mortgage on the same home.
Mortgage balances are reduced by the principal portion of mortgage payments and other mortgage paydowns and mortgage payoffs; and by foreclosures that cause the remaining mortgage balance to be written off after the sale of the home – there was a lot of that during the Mortgage Crisis.
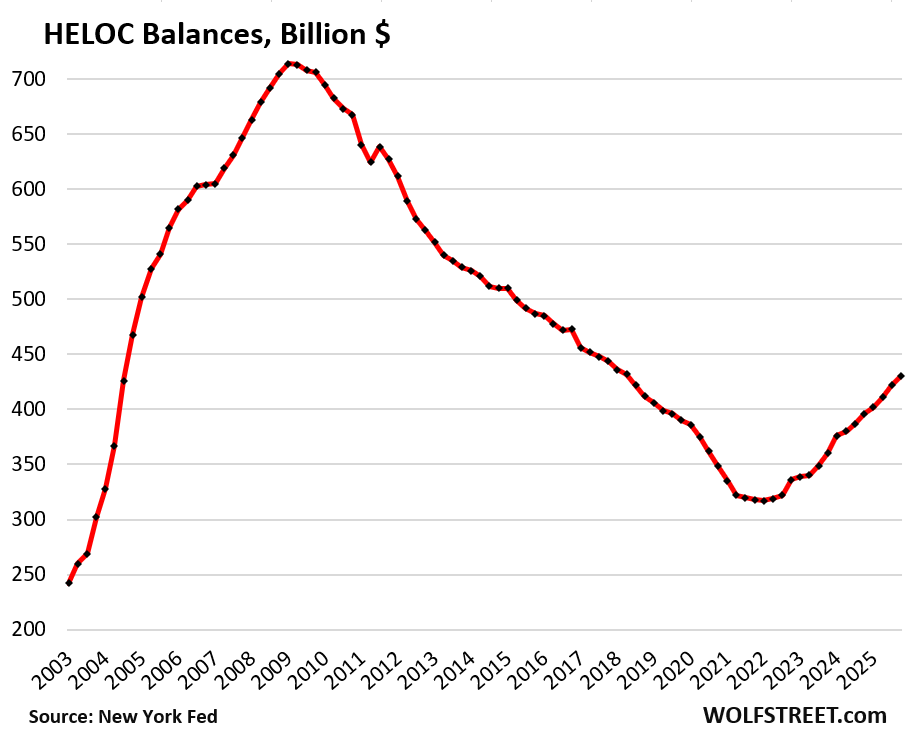
Here come the HELOCs: +36% since Q1 2021.
Balances of Home Equity Lines of Credit jumped by 1.9% in Q4 from Q3, and by 8.6% year-over-year, to $430 billion. Since Q1 of 2021, the low point, HELOC balances have surged by 36%.
HELOCs are lines of credit, and many of them are unused, just sitting there as a standby source of funding. But these balances here are actual balances drawn on HELOCs and accruing interest.
A HELOC is a second-lien loan on the home that, if defaulted on, can lead to foreclosure, even if the first-lien mortgage is current. HELOCs are full recourse loans even in the 12 states, including California, where nonrecourse mortgages are standard, and where lenders, after a foreclosure sale, cannot pursue former homeowners with deficiency judgements on the first-lien mortgage. But they can pursue former homeowners for the balance of the HELOC. HELOCs did some damage during the Housing Bust, and lessons were learned about their risks.
But what caused their disfavor in the years before 2021, and caused their balances to plunge for 13 years, was the ultra-low-rate mortgage. Instead of borrowing on a HELOC, homeowners cashout-refinanced their home. And that trend has now flipped.
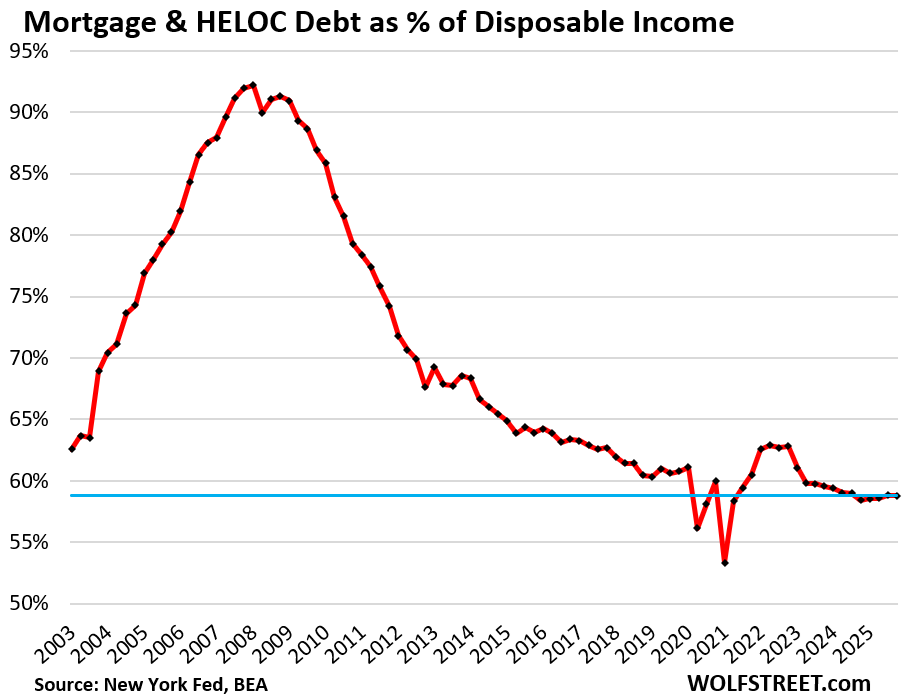
The burden of housing debt.
The debt-to-income ratio is one of the classic ways of evaluating the burden of a debt. With households, we can use the debt-to-disposable-income ratio.
Disposable income, released by the Bureau of Economic Analysis, is the monthly after-tax income consumers have available to spend for their daily costs of living, to service their debts, and to save and invest the remainder. So after-tax wages, plus income from interest, dividends, rentals, farms, small businesses, transfer payments from the government such as Social Security, etc.
But it excludes income from capital gains, which is where the super-wealthy make most of their money. And this upper crust of income is excluded here and doesn’t skew the data.
The housing debt for this ratio combines mortgage debt and HELOC debt.
The housing-debt-to-disposable income ratio in Q4 was unchanged at 58.8%, just a hair higher than a year ago, which had been the lowest on record, except for the freak quarters during the pandemic when stimulus funds distorted disposable income.
The chart below shows why the mortgage crisis happened: Consumers were way overleveraged with a housing-debt-to-disposable-income ratio of over 90%. When home prices sank and people started to lose their jobs, the debt imploded and was a big factor in the Financial Crisis.
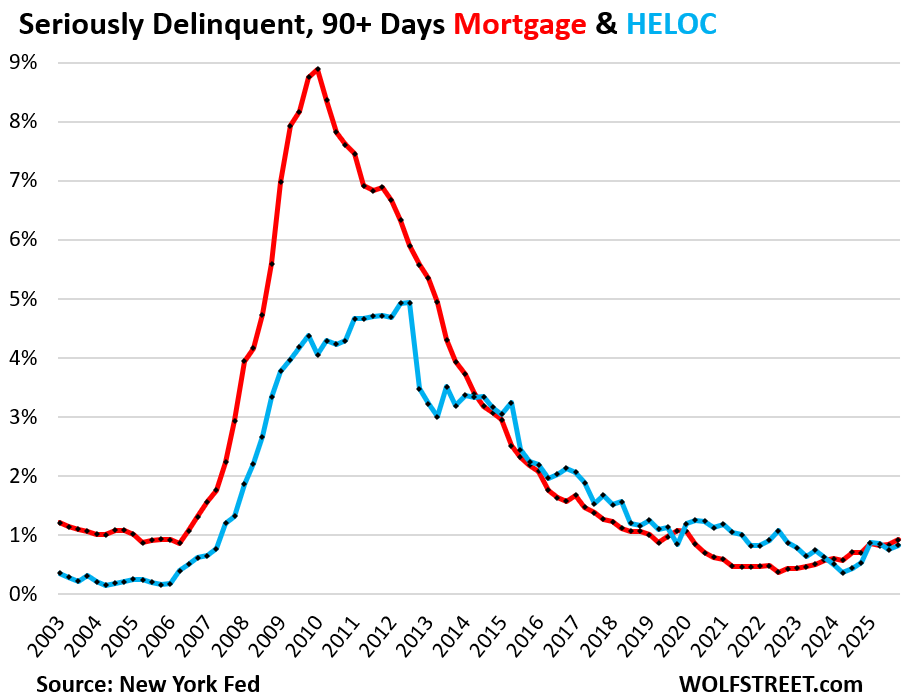
Delinquencies and foreclosures are very low.
Serious delinquency rates – 90 days or more delinquent – in Q4 edged up to 0.92% for mortgages (red in the chart below) and to 0.82% for HELOCs (blue).
These are low delinquency rates. They have returned to normal from the pandemic free-money lows in 2021-2023.
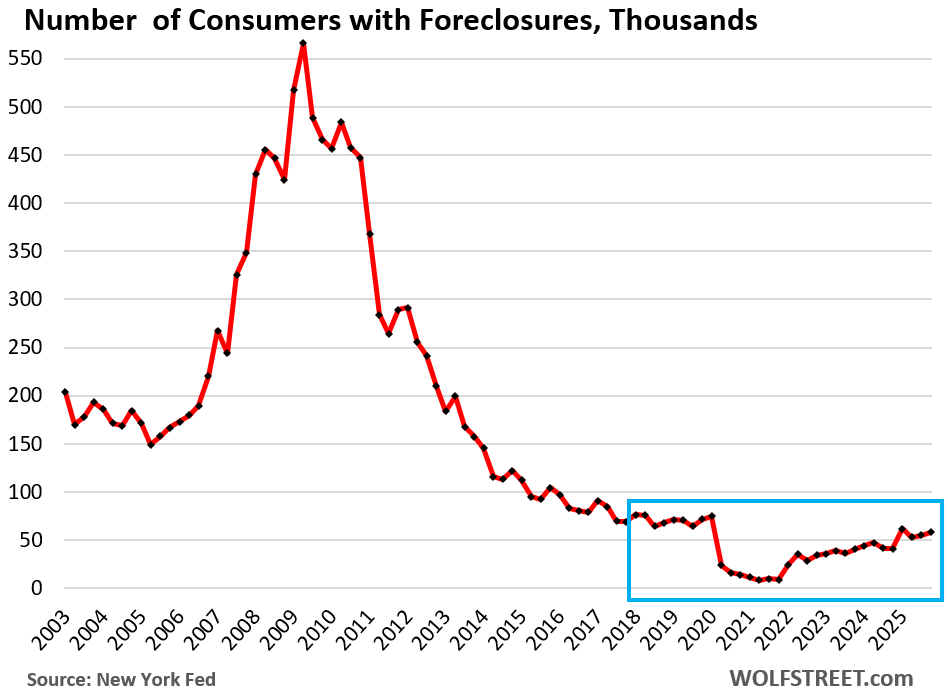
Foreclosures are still historically low. The number of consumers with foreclosures on their credit reports in Q4 edged up a hair to 58,140 consumers, well below the 65,000-to-90,000 range of the Good Times in 2018-2019, and far below those in prior years.
The increase over the past few years comes off the artificially low near-zero level during the era of mortgage-forbearance, when foreclosures were essentially impossible. The current levels aren’t even back to the Good Times normal yet, though they will eventually get there.
There will always be foreclosures, but a massive wave of foreclosures won’t happen unless there is a confluence of two factors: Widespread and sharp declines of home prices that make it impossible for a struggling homeowner to pay off the mortgage with the proceeds from the sale of the home; and a high unemployment rate, where lots of people suddenly lost their jobs and cannot make the mortgage payments.
But this time, the banks are off the hook.
Among the most fundamental changes resulting from the Financial Crisis was the transfer of mortgage risk from banks to taxpayers. Now, 65% (or $9.4 trillion) of all mortgages outstanding are guaranteed or insured by the Government Sponsored Enterprises, such as Fannie Mae and Freddie Mac, or by government agencies, such as Ginnie Mae; the FHA insures subprime mortgages with low down payments, the VA insures mortgages of veterans, etc.
The huge system of 4,000 banks and over 4,000 credit unions hold only about $2.7 trillion in mortgages, HELOCs, and second-lien mortgages, according to Federal Reserve data on bank balance sheets, less than 20% of the total. So there won’t be another mortgage crisis for banks. They’re largely off the hook.
The remainder of the mortgages that didn’t qualify for government backing, such as jumbo mortgages, and that banks didn’t want to keep on their balance sheets, about $1.7 trillion in total, were securitized into “private-label” mortgage-backed securities (MBS) and sold to institutional investors around the world, such as bond funds and pension funds, and they’re on the hook for those.
And in case you missed it: Household Debts, Debt-to-Income Ratio, Delinquencies, Collections, Foreclosures, and Bankruptcies in Q4 2025
Enjoy reading WOLF STREET and want to support it? You can donate. I appreciate it immensely. Click on the mug to find out how:

![]()
Those charts indicate that the U.S. is far away from mass foreclosures, which is one way to drag down housing prices.
2 articles on zerohedge today predicting that the re-adjusted employment numbers released by U.S. gov’t today will lead to interest rate drops of .75 to 1.00 %, which could lower monthly housing costs for mortgagors.
That’s typical ZH stuff. They predict the collapse of everything, negative interest rates, massive QE, and YCC. Year after year after year.
They already lowered and Powell said “looks good dawg!”
Well I doubt the 🐶 part