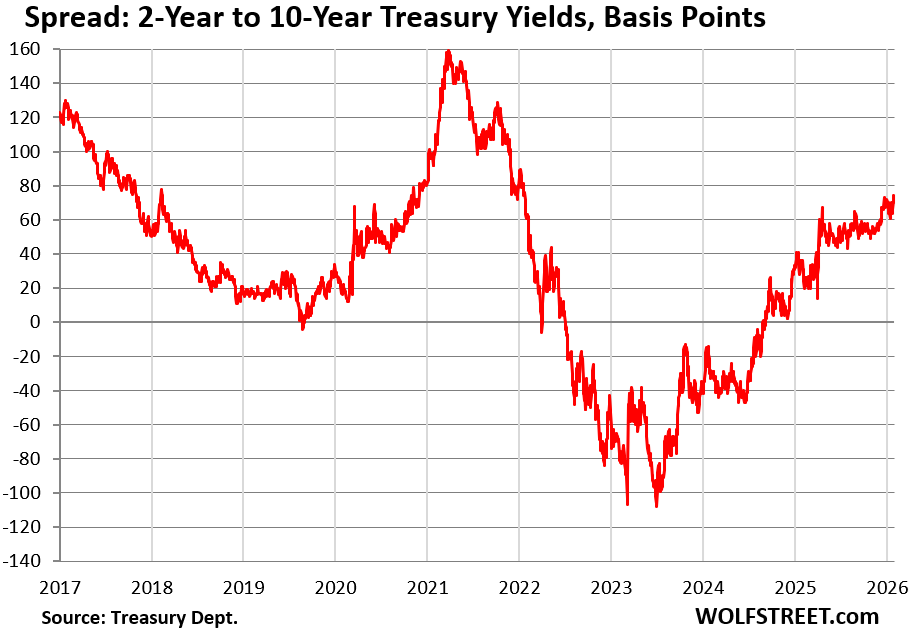
The spread between the 2-year and 10-year Treasury yields now the widest since January 2022.
By Wolf Richter for WOLF STREET.
The government sold $766 billion in Treasury securities this week, in 10 auctions, including six Treasury bill auctions and four Treasury note auctions.
The T-bill maturities ranged from 6 weeks to 26 weeks this week, totaling $538 billion. Every month, the Treasury Department is now selling over $2 trillion of T-bills, most of them to replace maturing T-bills, but auction sizes have been increasing, and those increases add additional debt to the $38.6 trillion pile. These T-bill auctions are a huge well-oiled machine:
| Type | Auction date | Billion $ | Auction yield |
| Bills 6-week | Jan 27 | 94.2 | 3.635% |
| Bills 13-week | Jan 26 | 93.1 | 3.570% |
| Bills 26-week | Jan 26 | 80.6 | 3.525% |
| Bills 4-week | Jan 29 | 105.4 | 3.630% |
| Bills 8-week | Jan 29 | 95.4 | 3.635% |
| Bills 17-week | Jan 28 | 69.3 | 3.590% |
| Bills | 537.8 |
The maturities of the four Treasury note auctions ranged from 2 years to 7 years, and totaled $228 billion.
The 2-year Floating Rate Note (FRN) was sold at a “spread” of 0.099%. Investors who bought them get an interest rate that resets every week. That weekly interest rate reset is based on the yield at which the most recent 13-week T-bills were sold at auction. Plus investors get a “spread” (discount margin) that is determined at auction.
| Notes & Bonds | Auction date | Billion $ | Auction yield | Spread |
| Notes 7-year | Jan 29 | 47.1 | 4.018% | |
| Notes 5-year | Jan 27 | 74.9 | 3.823% | |
| Notes 2-year | Jan 27 | 73.9 | 3.580% | |
| FRN 2-year | Jan 28 | 32.1 | 0.099% | |
| Notes & bonds | 228.0 |
Long-term yields have trended higher since October.
The 30-year Treasury yield inched up 2 basis points to 4.87% on Friday, and was up by 5 basis points from Friday last week. It started increasing in late October, just before the Fed’s rate cut and has since risen by over 30 basis points.
The dotted blue line in the chart shows the Effective Federal Funds Rate (EFFR), which the Fed targets with its policy rates.
Since this rate-cut cycle began in September 2024, the Fed has cut its policy rates by 150 basis points. Over the same period, the 30-year yield has risen by nearly 100 basis points.
The widening gap between the EFFR and the 30-year yield, now at 123 basis points, shows that the Fed’s rate cuts have led to rising long-term bond yields because investors in long-term bonds are worried about future inflation. A lax Fed that cuts rates as inflation is accelerating is a worrisome signal for those investors.
But a 30-year Treasury yield of 4.87% is still low considering that inflation is now about 3% and looks to be accelerating amid a “let it run hot” economic philosophy at the government.
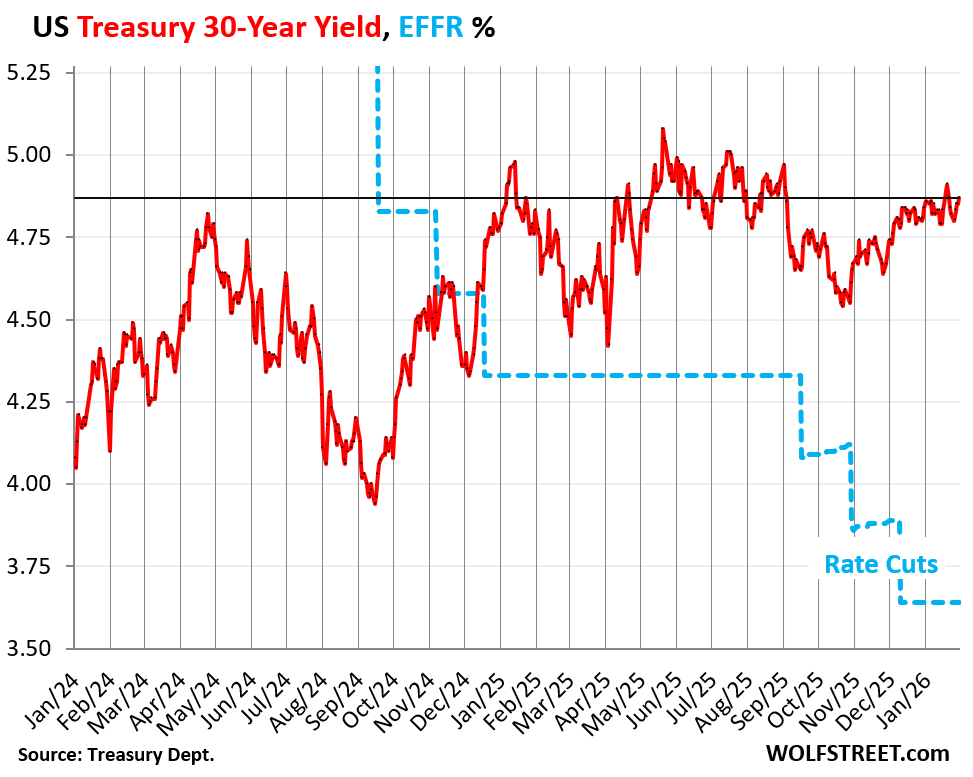
The Fed’s rate cuts have pushed down short-term yields, such as the yields at the T-bill auctions, but long-term yields are negotiated in the bond market and reflect the bond market’s concerns about future inflation.
The bond market is also worrying about future supply of long-term Treasuries to fund the ballooning deficits, and thereby new investors might have to be pulled in with higher yields. But higher yields mean lower prices for existing bondholders.
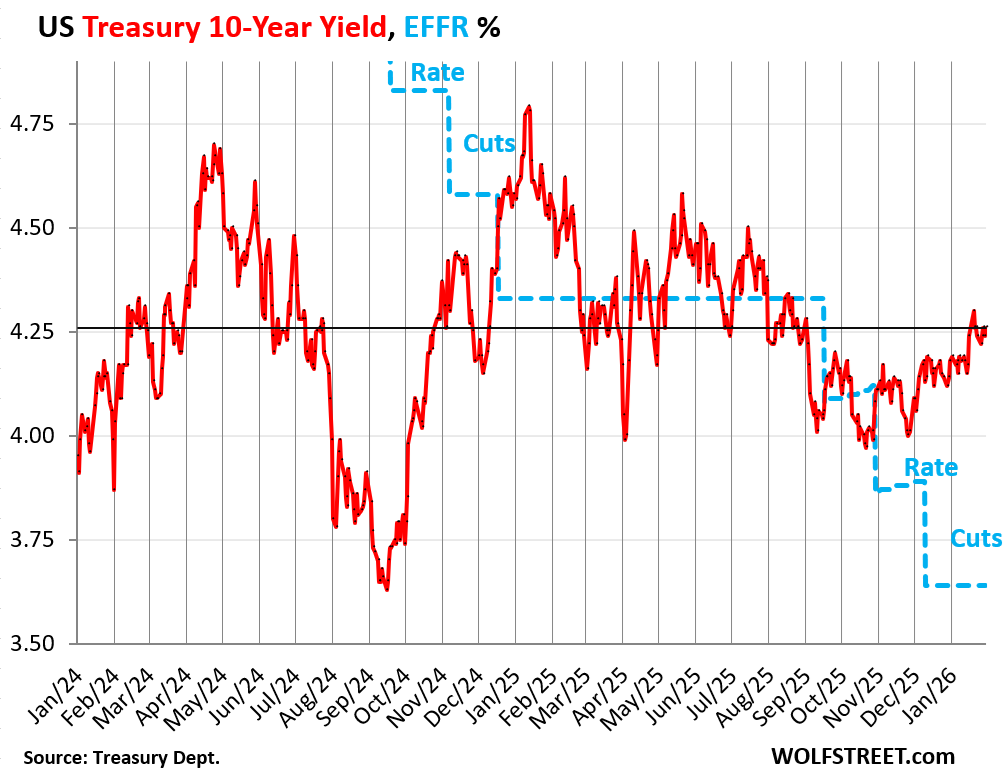
The 10-year Treasury yield was unchanged on Friday, at 4.26%, despite the utter chaos in the silver and gold market, upon the news that Trump had nominated Kevin Warsh for chair of the Federal Reserve.
The 10-year yield is up by 4 basis points from Friday a week ago. It too started rising on the eve of the October rate cut and has risen by 28 basis points since then.
Warsh has been hostile to QE and the Fed’s large balance sheet, and hasn’t changed his tune to get the job, and he had already put his career at the Fed where his mouth was when he quit in 2011 over QE-2. So Trump must have bought into his logic that a smaller balance sheet, by reducing the money supply, would lead to lower inflation, and eventually lower inflation would lead to lower long-term interest rates (my discussion of Warsh’s QE hostility is here).
Under this theory, the Fed might cut short-term rates a little more, and reduce the balance sheet (money supply) at the same time, in the hope that inflation and long-term rates would follow.
This kind of monetarist thinking is heresy at today’s Fed, and he’ll have to struggle with a resisting staff, and he’ll have to persuade enough members of the FOMC to get a voting majority to get anything like that implemented. So it won’t be a cakewalk.
Some other FOMC members have also expressed thoughts to the effect that the balance sheet could be smaller. I assume that Powell, the architect of the mega-QE during the pandemic and the still huge balance sheet despite $2.4 trillion of QT, has squashed further discussions of those thoughts, and will resist them as long as he is on the Board of Governors (his term as governor expires in January 2028).
That strategy of reducing the money supply by reducing the balance sheet pulled the rug out from under the “debasement trade,” which is why the dollar rallied on the news, cryptos tanked further, gold plunged, and silver collapsed by 30% from the high of the day before.
But the bond market seems to be cool with it. Just get that inflation down!
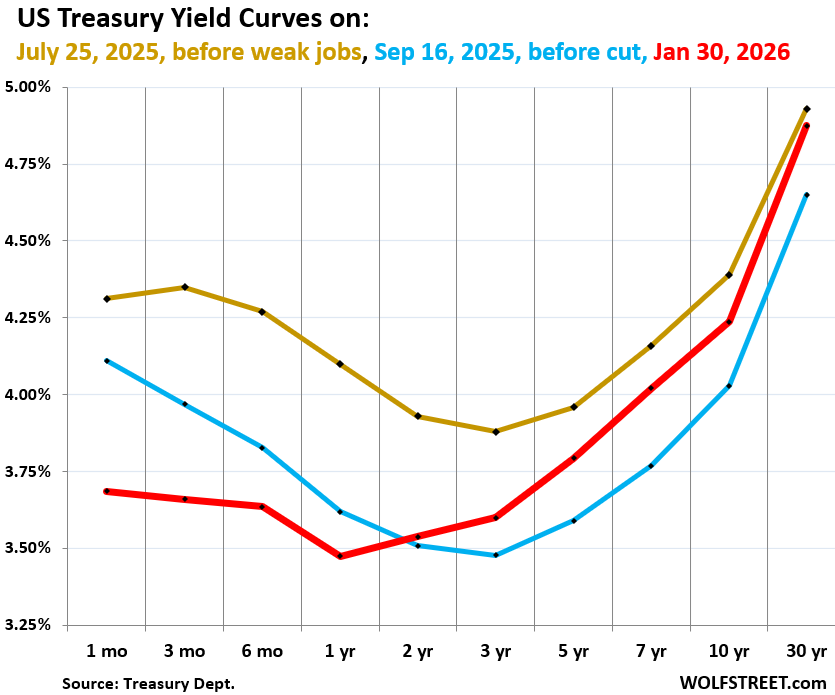
The yield curve has steepened since the Sep 2025 rate cut.
The chart below shows the yield curve of Treasury yields across the maturity spectrum, from 1 month to 30 years, on three key dates:
- Red: Friday, January 31, 2026.
- Blue: September 16, just before the Fed’s first rate cut in 2025.
- Gold: July 25, before the labor market data turned sour.
Long-term yields have risen since September 16, 2025, but the three rate cuts since then have pushed down short-term yields, causing the yield curve to steepen.
And the big sag in the middle is nearly gone, with the lowest yield now being at the 1-year marker (3.48%)
The 1-month yield (3.69%) is bracketed by the Fed’s policy rates (3.50%-3.75 %) and closely tracks the EFFR (3.64%).
Every yield from 2 years on up has risen since the September 2025 rate cut.
The spread between the 2-year yield and the 10-year yield widened to 74 basis points on Friday, the widest spread since January 2022, indicating to what extent the yield curve has steepened between the two.
Part of the reason why the spread has widened is because the 2-year yield is still so low, at 3.52%, and has barely ticked up since September 16. Investors in the 2-year yield are still counting on a rate cut or two later this year:
Enjoy reading WOLF STREET and want to support it? You can donate. I appreciate it immensely. Click on the mug to find out how:

![]()
Is it just my poor recollection, or were yield curves typically bowed outward back in the olden days … versus being sloped inward as they have been recently. (Ignoring when they were inverted.). Any significance to that?
In a perfect world, yields are linear. A 1000 loan paid in 1 month should get a better interest rate than 1 year and 10 years respectively. It’s only recent that we see a more linear pattern. The problem I forsee is long term yields going up.
however with govt debt to GDP ratio of 110% +++
we are entering the exponential phase of the chart
bond vigilantes are ropa-doping yields now
zirp was big mistake and the fat lady is clearing her voice
I have a different perspective in that, silly me, think that a mathematical excess of liquidity was the beginning of the end of the age of innocence. American general prosperity as an impediment to profit.
Of course I recommend a dose of love and thanks for the community of ordinary people that implemented an extraordinary social cohesion as a result of their shared experience for the past 70 plus years
You can actually analyze them and they show symptoms like a disease. Some books go into that historically. It’s really interesting.
Why am I continually thinking of our national debt? Why am I concerned? I don’t think any of our elected officials think too much about it. Should I just forget it??
That’s what tariffs are for, right? To pay that down.
Whew! I can sleep like a baby tonight…
True that Ryan:
Especially if you realize that babies, in general, wake up and fuss and have to be fed, sometimes many times during the night…
That’s the main reason many parents have their babies next to them in the bed for some, various time.
This from an experienced dad of two wonderfull…
LOL, but true for almost all babies that I have known.
You are consented to be governed. However, you are not consented to be taxed on certain amount. Since 1913, federal income tax has been imposed on the American people. Yes, we should pay tax because of commonwealth and shared burdens. However, how much should each citizen pay? Wolf pointed out to me that the debt should be thought of as the ratio of the economy. However, what does the US gov own? It is a private economy. The gov owns nothing! It takes from us.
Hoang,
You’re sunbathing in misconceptions.
1. “the debt should be thought of as the ratio of the economy. However, what does the US gov own?”
The ratio that matters is interest expense to tax receipts. Debt to GDP tracks a similar thing, in that as the economy grows, it generates larger tax receipts. The issue is not and has never been debt to equity, or debt to assets, which is what you’re refencing.
2. “The gov owns nothing!”
The US government (the People of the US) owns a huge portion of the land in the US, nearly 30% of the total land of the US, including some of the most expensive real estate anywhere in cities such as San Francisco.
Our national debt is always quoted as 130% or something like that- It’s really about 95% – Debt owned by the public with most of it owned by people within the US. The other portion of the debt is just an IOU of pre funded obligations to mainly social security. So not really debt, really pension obligations. So while debt is high- its still manageable and why it hasn’t been solved yet- no one seems to a burning need to as the pain to solve it is much greater than the pain to just keep doing what we are doing. At some point we have to bring our fiscal deficit to around 3-4% of GDP- I dont know when that time will be.
“So not really debt, really pension obligations.”
“So not really debt”: That’s a misconception. That money was paid into Social Security by working people, and was invested in Treasuries. It could have been invested in corporate bonds or stocks or whatever, and then someone else would have to hold those Treasuries. This money is owed the beneficiaries.
“really pension obligations”: A pension obligation is a debt, a form of a long-term debt, and in the private sector are long-term liabilities, similar to bonds.
Where it does make a difference is in the market: this debt is not traded, and is therefore not subject to the vagaries of the bond market, and its yields don’t rise and fall minute by minute, but are set by the government based on a long-ago-established formula, and the rate and value of the debt remain fixed over the term of the debt.
politicians don’t care because they HAVE NO INTENTION ON REPAYING
they’ll do great reset after hoovering 99% assets
then debt jubilee
but IMHO 100% ought to be declared null and void TODAY since it was issued with no intent on repaying(new debt not repayment)
of course then it ought to be illegal for govt to issue any debt after great reset
ie live within your means
IMO you are correctly concerned with our national debt because it is the albatross of fiscal incompetence as opposed to the more likely alternative that it is a planned shifting of the risk free debt from the particular under water borrowers to the burden of the tax payers.
The word, fraud, is perhaps a crude description of an intricate felony, embodied within the very definition defined by the law.
very interesting reactions. something is not like it was for past 30 years……As of early 2026, gold has overtaken U.S. Treasury bonds as the world’s largest foreign reserve asset, with central bank holdings approaching $4 trillion, driven by record high prices and reduced confidence in dollar-denominated debt. separately, the dow/gold ratio for the entire 21st century has had gold a 4x better investment since Y2K new years eve. i enjoy the work and charts and analysis and education. thank you Sir.
“gold has overtaken U.S. Treasury bonds as the world’s largest foreign reserve asset”
1. Gold is NOT a “foreign reserve asset.” It has nothing to do with foreign currency. It’s a “reserve asset.”
2. The only reason why gold has overtaken Treasury securities is because the price of gold has nearly DOUBLED over the past 12 months through Thursday, and has more than tripled in five years. And many central banks, including the ECB, which hasn’t bought any gold in a very long time, mark their gold to market, doubling and tripling their holdings just because the price has risen. A decline in prices would unwind that. Yes, gold prices have a tendency to plunge long and hard, last plunge was 50% starting in late 2011.
Hello mr Richter,
A question from the Netherlands.
I did some research online but can’t find the answer to my question.
Is there and overview how much debt the US has to refinance this year 2026 and next year 2026. I think it’s called a maturity wall
Can the amount of refinancing also be catagorized in short term debt and long term debt.
Thanks, I enjoy reading your articles.
If you visit the Netherlands someday, you’re welcome to visit.
T-Bills get refinanced all the time. So a 1-month T-bill gets refinanced every month. There are something like $400 billion in 1-month T-bills outstanding, so every month $400 billion in 1-month T-bills have to get refinanced, nearly $5 trillion a year, but it’s the same $400 billion in T-bills that get rolled over.
So now do that with all other T-bills, and you’ll get some huge numbers. That’s why the big numbers of the maturity wall stuff are just kind of irrelevant. Rolling over the debt isn’t a problem, and has never been a problem. Adding the new debt becomes a problem over time.
of course most other countries like china, russia, india, middle east, etc. no long want US Treasuries and are selling them for gold instead
ride coming is NOT GOING TO BE PLEASANT for sheeple of US
99% will go bankrupt within next 10 years(or sooner)
gold is supposed to be insurance against ever devaluation of fiat $dollar
but soon it will be only thing(other than wheel barrel) that will have enough value to buy food
ok. so the word foreign was incorrect. and the other reserve assets on books of central banks in history of central banks don’t change in value? i have been investing in FX and Gold and stocks and bonds for 50 years. we both know they all can fluctuate in price. hell, even the ancient egyptians and my romans had reserves of gold in their central banks. ever been to the sultan’s palace in morocco. the dumpster size treasure chests were filled with gold and silver and diamonds…………..my favorite tour of all time was the sub basement of FEDRES of NY. i do know that gold was for foreign gold for safe keeping. i like your blog, mr wolf. you are very smart and present great educational and trading ideas. i thank you.
“the other reserve assets on books of central banks in history of central banks don’t change in value?”
Correct. The foreign exchange assets for nearly all central banks (except SNB) are foreign-currency bonds. Bonds pay the holder face value at maturity, so if the CB buys at auction at about face value and doesn’t sell before maturity, the CBs receive the bonds’ face value, and so there is no change in value of the bonds, and that’s how they show it on their books. They don’t mark bonds to market during the term because they’re not ever selling those bonds, and so in the end, they will get face value. Banks and companies, such as Apple that have huge bond holdings, follow the same accounting for bonds that they intend to hold to maturity. The interest income CBs earn from the bonds doesn’t get added to the balance sheet (except the inflation compensation from TIPS which is added to the principal).
Gold is/has been a Tier 1 Asset based on BASEL 3 Switzerland Banking.
Dude, no one has or will care about gold. It’s just a fad. It’s nothing.
On average it is prob a negative return over 100 years. There are a ton of years it goes up zero %, those years must suck. To have inflation eat your gold earnings up.
When it goes up it’s all this “gold gold gold” yappy dudes.
Kinda annoying
Better and worse than that. You can’t go back 100 years because there were no free market prices before abandonment of the gold standard.
But over the 50 years since, average annual increase after inflation is 3%.
This obscures the fact that it’s boom and bust. Up 5x from 1975-1980. Down 80% (!!) from 1980-2001. Up 4x from 2001-2011. Down 50% from 2011-2015. Up 2.5x from 2023 to now.
What do you think happens next?
Numbers
It’s just a bet. Just like options
That’s not investing, that’s betting.
Morons bet. And morons lose to big banks.
rhscct2 means foreign countries hold physical gold as a reserve asset. gold is a basel 3 tier one reserve asset. the rest of the world knows that gold is a much better reserve asset than us treasury paper now.
Gold even at a laughably absurd speculate ‘value’ of $5,000 an ounce is worth less than 1% of global assets and is of zero financial relevance.
basel 3 would like a word. 5000 gold and 100 silver isn’t speculative. it’s the system coming apart and historical suppression tactics by bullion banks is coming to an end. pay attention.
Something like silver that spiked by 100% in six weeks and plunged 40% in two days “isn’t speculative?” 🤣❤️
– Off Topic: I received an email from WOLFSTREET for this post (which is good). But I also received a different email supposedly also from Wolfstreet with the title “Advertisement-Putt.live” ???????
Was this an attempt to “phising” ? Was this from WOLFSTREET at all ? I can send it to you if you want (I assume you have my emailaddress ??)
Sorry, my goof-up. Just delete it.
When I was working on a technical issue for a potential client’s banner ad on the homepage, I clicked on the wrong thing, and my automatic email system sent out an email with the title “Advertisement-Putt.Live” but there is nothing there, so when you click on the headline, you will get a 404 error message (page not found). I love my automatic email system, but I cannot ever make a mistake LOL
OK, No problem. I asked because lately I have some other small problems, odd things going on with the emails I receive. No, no details. Again, it’s OK now I know.
Given the US debt of $38 trillion and rising and roughly $10 trillion in maturing debt that has to be refinanced in the next twelve months I suppose monthly auctions of this magnitude will be common practice. I am surprised that foreigners are happy to purchase this debt at such low rates rather than purchase more gold after this steep correcttion.
Why would anyone want to purchase a laughably overpriced and plunging speculative asset such as gold?
Assuming much?
According to the World Gold Council, central bank gold purchases actually slowed last year as prices surged. Higher prices reduced the urgency to buy, at least temporarily. Instead, much of the recent demand has come from private investors, particularly through exchange traded funds.
Then came Friday.
Gold plunged, and silver experienced what can only be described as a crash. The timing was not random. The selloff followed President Trump’s decision to appoint Kevin Warsh as chair of the Federal Reserve.
Markets interpreted the pick as a shift away from aggressive rate cuts. Warsh is widely viewed as more cautious on monetary easing than Kevin Hassett, who was also under consideration. In simple terms, investors saw Warsh as a harder money choice.
Price action reflected that view. Stocks, gold, and silver fell. The dollar strengthened. Long term Treasury yields moved higher. Two year Treasury yields dipped slightly due to the nuance that Warsh has expressed interest in selling portions of the Fed’s Treasury holdings while adopting a more measured stance on interest rates.
The broader implication is clear. A portion of the precious metals rally was tied directly to expectations of looser monetary policy. When those expectations were challenged, prices corrected violently.
That raises a deeper question. If inflation fears were truly widespread and durable, they should have shown up more clearly in bond markets.
They have not.
In many ways, markets have recently behaved like they did in the years leading up to the 2008 financial crisis. From 2001 to 2007, investors favored foreign stocks over U.S. stocks, small companies over large ones, and value stocks over growth. Commodity demand surged as global growth accelerated, and copper prices soared.
Gold thrived during that period as well, rising from $273 an ounce in early 2001 to $634 by the start of 2007.
Gold jumped 21.8 percent in the first 21 trading days of the year, the strongest start over that time frame since 1999. Silver rose even more dramatically, fueled by aggressive private buying and speculative momentum.
More importantly, global growth does not justify the scale of silver’s move. A tripling in silver prices over twelve months goes far beyond what industrial demand alone can support.
Investors who chased precious metals late in the rally learned a painful lesson. Markets can remain irrational longer than expected, but they rarely do so forever.
Why would any central bank buy US Treasuries when we are issuing 744 Billion per week? Why would a CB buy US Treasuries and hold an asset that can be frozen at the click of a button and indeed actually have been frozen.
We are all very certain that the post 1971 world is the way the world has always been and always will be.
If you have been watching gold these last few years you would recognize that this rise and plunge is absolutely (and painfully) typical. It happened in October after the run from 3000 to 4000 – following the same pattern: on a friday at the end of the month.
Central Banks continue to buy gold. Gold as a reserve held by CB’s peaked post Bretten Woods at 60% of global CB reserves. Today the % is 24% and has been rising since 2015 with the rate of growth steepening right around the time Russian assets were frozen (stolen). It’s true that much of the recent rise has been due to the rising price of gold (or the “plunging” value of USD) but the growth has also been in terms of tonnage held in CB vaults. The BRICS plan appears to be to promote trade settled in local currencies with imbalances settled in Gold. Like it or not, it’s probable that Golds return to the stage as a monetary element is happening.
By all means, don’t buy gold. time will tell.
It will be interesting to see if Warsh is able to carry out his QT plans. It will be an experiment between the pure monetarists and some of the more recent theories about how liquidity dominates.
The Liquidity folks will say, QT creates shortages of “safe” assets. If it succeeds in strengthening USD and decreasing liquidity that will precipitate both a bond and emerging market fiscal crisis.
I don’t know which is true, but we will find out. It will be fun.
As to Gold, probably down some monday from sheer momentum and after that we will see.
Anyone would purchase US Treasuries to get a GUARANTEED RATE OF RETURN ON PRINCIPAL AS WELL AS THE RETURN OF PRINCIPAL at maturity. Gold doesn’t offer that little feature!
Why would anyone buy gold when people are mining $250 billion worth every year? And it offers 0% interest?
Gold is the original bit coin in most of the categories required for valuations several thousand years ago.
Debt deflation was at the heart of the great depression. So much of the New Deal legislation dealt with the catastrophic effects of non existent regulation. Consumers as wooly lambs to be randomly and wantonly sheared
30 year US Bond at 4.87%
Suddenly it seems ridiculous that smart sophisticated Wall street men bought billions of German bunds during NIRP-ZIRP @ -0.5%
But what do I know? I am just a poor Sacramento refugee struggling to buy groceries in Petaluma
All yield are relative at the time you are buying them. That’s how they work. You buy the thing that gives you the highest yield (at the risk level you can tolerate). When the entire world was doing ZIRP (except for really risky bonds from developing nations), well, that’s what you buy if you need low risk. No one safe was offering 4.87% and they didn’t have a time machine.
In a free market world the US 10 year yield would not be two times more dear than the Italian bond of similar duration.
The Italians are notorious for acting by emotion rather than logic. The secret of their charm and beauty.
I wonder what this recent ice storm that hit the USA will have on the economic data for this month and next. The economy here is dead as a doornail. People cannot get out of their houses and can’t get essentials. The news media is not even covering this. People are dying right on the street in NYC and no one cares. I was out yesterday and 95% of the cars in the DC are iced in as we speak, and many roads are not plowed one week after the storm hit.
The weather is beautiful today here in Southern California and will be sunny and in the high 70 degree range today making it a great day to go shopping on Rodeo Drive and going to the beach in Santa Monica.
Who can afford rodeo drive. I can’t even afford a line dance, yet a rodeo.
Haha
Don’t worry about the snow, it will all have melted before Roger Penske’s and Donald Trump’s “Freedom 250 Grand Prix of Washinton, D.C.” IndyCar race. The race will be free to attend and it will contribute bigly to DC. It has yet to be determined however, who besides the taxpayer will foot the bill for this event.
Not a problem in Boston area….everyone is out! Supermarket packed! New England knows how to shovel! (Not just snow)
Hey did ummm bellichek get in yet?
😆
Not a problem in Montana today. It is +60 degrees F right now in the Chinook zone (Of course it could be 100 degrees colder next week and the economy of Montana is insignificant to the rest of the country).
February, the Chinook winds warm Montana after a brutal January of 50 degrees below zero at the top of the divde
Wouldn’t QT tend to put upward pressure on interest rates, the opposite of Trump’s publicly stated goals? It would seem the mechanism that QT brings down inflation would be through slower economic growth, also probably not desirable for Trump. Is this strategy a mini version of the 1980’s, when rates were painfully high to kill inflation?
QT is the Fed selling assets to remove dollars from circulation and make them more scarce.
Fewer dollars chasing the same number of bond issues should equal lower prices and higher yields. So yes.
If Warsh wants to cut rates while reducing money supply through QT, we can expect a much steeper yield curve.
I agree with most of your logical flow.
The obese Fed balance sheet is the antithesis of free credit markets. Which Kevin Warsh wrote about, against the monetarist philosophy of ample or abundant reserves as opposed to the maga salad days of scarce reserves.
The obesity of the Fed balance sheet makes it clear that the policy is fuck inflation. The worst thing that could possibly happen is that the asset price should fall.
Those assets have arguably been on the balance sheet for years, and reflect money already printed and circulating in the economy.
Their purpose now is to intimidate anyone predicting that inflation will be a problem. The Fed has the power to pull billions of dollars in currency out of the market within a relatively short amount of time, by selling these assets.
Basically, that’s the plan, to enact QT so that interest rates can be lowered. But where does it leave us? Without a weapon against inflation.
Is there a difference between QT and ending QE?
QT = Quantitative TIGHTENING
QE = Quantitative EXPANSION
QT is like deflating a balloon, while QE is like blowing up a balloon.
Get it now?
It’s not a closed system, thankful. Its dynamic capital moves across boarders for multiple reasons. In my eyes it’s about the loss of “truth capital” here in the USA. Engineering via proforma modeling depends on faith in the USA brand. Without Truth capital it’s the end game. The citizens here can’t do the heavy lifting and are reliant on deficit spending to provide them with a standard of living way above what we can afford. Without foreign capital wanting to invest in the American dream it’s over. That’s where we are, the beginning of the end. Things are going to get really bumpy the administration will want to borrow a few hundred billion to bribe voters, symptoms of the end game. When risk assets underperform US T bills for over a year, the American public will want to buy T bills another symptom of the end game. The lack of truth capital is the end of the American dream. I forgot without a growing population it’s over too, less people can’t pay more taxes and service the debt! It’s the end game.
Hot money couldn’t care the slightest hoot about ‘truth’ and just moves to where it sees the fastest and most speculative return and the core issue today is that the world is awash in hot money.
I dont understand what you are talking it. I look at the ROC (rate of change) of all the major stock market, I am not seeing spikes anywhere. Look at 3 month returns in anything (beside the metals) returns are lower Quarter over quarter slowing gains across the world. Emerging market debt ok money is flowing there. 3 month returns in Mags is .26% the hottest trade mags is down .39% in the past month. The $trans had a good month buts it underperformed for years. What are you looking at? My eyes are seeing the perception of liquidity drying up and the slowing of returns of assets is the proof that liquidity is getting scarce for buying risk. Tell me where this hot money is going? Respectfully I want to understand what I am not seeing. Thanks I see money is flowing into $sox semiconductors but quarter over quarter the gains are down by half. The rate of change is slowing. Thanks
It was gold and most other metals earlier this year, but that is about to be eclipsed by the IPO of Spacex which is looming with an offering price on the IPO of around $1.5 trillion!
Past tense. The world will have liquidity crisis starting now and crisis in the faith of the USA. The euro and yen is up against the usd we had a one day bounce. Sell America is gaining traction. In my home state of Utah the Governor just signed a bill to allow Utah to add a Supreme Court justice to over turn the majority of the voters who voted against political gerrymandering. We are super conservative state with a conservative Supreme Court and always have been. Right now the Supreme Court supports the voters “we the people” , a group of politicians want to keep the gerrymandering legal to give frump an advantage. People here on wolf site have said if the US supreme court found the Trump tariffs illegal that the executive branch doesn’t have the ability to tax the nation that power is congress area, there is work around the Supreme Court decision. The world is paying attention and are voting with moving their capital . I don’t know where this is going. It’s the lack of predictability that is making smart people afraid. Except I know a liquidity crisis is here, margins calls are going out this week and liquidity will be missing to make them whole. Thanks for giving me answer. I wasn’t trying to be arrogant when I commented on your comment to pay attention to junk bonds, I was trying to share knowledge. Cheers
A thumb up!
George Santayana’s lesson is worth remembering, “Those who cannot remember the past are condemned to repeat it,”
The following is based in part on two City Journal’s articles with some edits and alterations. Draw your own conclusions.
Under Powell, the Fed ventured into areas beyond monetary policy. Roughly 10% of research at the Fed board and regional banks shifted toward more overtly political themes. Governors increasingly spoke on issues such as racial inequality, even adopting a promise to focus on diversity and inclusion in our workplace and to our work to ensure fair access to credit across the country. And in 2021, the Fed created a committee to assess how climate change might threaten the financial system and pledged more resources for modeling those risks. The group was quietly disbanded this past March. By letting the Fed embrace climate change and racial justice issues he weakened the case the Federal Reserve under his watch is independent of politics.
His policy errors include shifting the central bank’s focus in the 2019 framework review to employment from inflation. The change came meant the Fed would cut rates when unemployment was high but not necessarily raise them simply because it was low.
The Fed also adopted Flexible Average Inflation Targeting (FAIT), allowing periods when inflation was above 2 percent to offset earlier periods below target. Under the Fed’s previous regimes only brief deviations from the 2 percent target were tolerated. Under FAIT, overshooting was intentionally allowed to compensate for the prior periods of undershooting.
Unemployment in part is caused by supply conditions and fiscal impacts over which the Fed has little control and the relationship between unemployment to the Fed’s policies is not well understood.. This miscalculation contributed to the initial loss of control and may explain why inflation still remains above the Fed’s target.
The motivation for the shift in the Fed’s focus reflects decades of low inflation and years of near-zero real policy rates, both of which made the risk of too little inflation seem greater than the risk of overheating. Politics also have played a role as the Fed under Powell described maximum employment as an “inclusive” goal assuming low unemployment helped draw more workers with less education and black Americans into the labor force.
After a decade of low inflation despite repeated rate cuts, shifting its policy focus toward employment from inflation seemed to be risk-free if it expanded the workforce. With Congress seen as paralyzed, the Fed appeared able to move the economy and tackle big problems at no cost. The focus on unemployment made the Fed subject to political capture to justify loose monetary policy.
It was perhaps inevitable that assuming the Fed could tackle issues like climate change and racial inequality would breach the narrow mandate protecting the Fed’s independence. But this was never realistic. Both are serious economic challenges that involve trade-offs better left to elected officials accountable to voters. Addressing political challenges require changes in education policy and regulations beyond the Fed’s reach.
The pandemic was the Fed under Powell its first true test and it unleashed the central bank’s full force to combat a collapsing economy, cutting rates to zero and deploying QE on an unprecedented scale. By 2022, the Fed’s balance sheet had swelled to $8.95 trillion, nearly double its previous peak of $4.5 trillion in 2015. In March 2020, when mortgage and bond markets froze, such measures may have been necessary to keep credit flowing. But as the economy recovered, the Fed kept its foot on the accelerator.even after inflation accelerated in the fall of 2020. Even so, the Fed kept rates near zero and continued buying Treasuries and mortgage bonds until March 2022, more than a year after inflation had exceeded target.
By May 2021, consumer prices were rising more than 5 percent year-over-year; and by June 2022, inflation had peaked above 9 percent. Policymakers initially hoped that the surge was supply-driven and would fade on its own. Critics pointed to FAIT, which tolerated overshooting and a hot labor market. But some analysts argue because of the framework’s asymmetric response to employment even if inflation was high the Fed would not consider raising rates until joblessness had fallen further.
The bigger mistake may have been continuing QE until 2022. The Fed did not begin tapering its bond and mortgage purchases until November 2021. though it should have started winding down by fall 2020. By the fall 2020, the markets were functioning normally and the housing sector was overheating even as Americans moved and refinanced at record-low rates. Still the Fed kept buying mortgage-backed securities until 40% of all agency MBS were held on its balance sheet. This flood of purchases drove mortgage rates below 3 percent in 2022. Now, three years later almost half of U.S. homeowners locked in to loans under 4 percent and reluctant to move, constraining supply.
https://www.city-journal.org/article/trump-fed-nominee-kevin-warsh-independence?skip=1
https://www.city-journal.org/article/federal-reserve-chair-jay-powell-inflation-interest-rates
https://www.nber.org/system/files/working_papers/w30749/w30749.pdf
And lastly, my sincerest thanks to Mr. Richter. As promised I have posted you a small token of my appreciation for your time and the effort required to provide the educational opportunity. No check this time, but just three pieces of paper, two inside enclosed by outside one on which I’ve written my three favorite words. Warmest regards to all, OBC
I agree with all of this. The Fed intentionally destroyed the housing market, and then the clown in the White House is going on about how people who don’t own homes “didn’t work hard.” Because yes, the guy who graduated college in 2021 and saw housing prices double in 2 years, he didn’t ”work hard.”
Please remember where the former FED chair was employed during this time.
A complete and through breach of any pretense of independence.
Holy snikees that’s a long post!
The current rate of inflation as of December 2025 is supposedly 2.7% according to our government. The 3 month, 6 month, 9 month and 12 month Treasury Bill rates according to Fidelity are as follows:
3 month. 3.67%
6 month. 3.67%
9 month 3.62%
12 month. 3.55%
Fixedincome.fidelity.com
That’s about 1% over the presumed current rate of inflation. If the rate of inflation would fall to a 2.25% rate consistently, then it would be appropriate to reduce short term rates by another .25% realistically. Long term rates are just beginning to revert to a normal yield curve.
Remember that this inflation rate is from the US Government. There are many who think this rate is understated. The bond market vigilantes will tell us what the real rates will be.
How can the Fed lower the fed rate beyond what the market can take without increasing the balance sheet? If Warsh lowers the rate by, say, 50 basis points, he will have to defend it by providing liquidity.
Where does this ridiculous self-contradictory BS come from? Who is circulating this ridiculous BS?
After reviewing the action on Comex last week…….somebody sold a tremendous amount of gold and silver in the futures market on Friday. These are paper contracts, not the actual metal. It was all timed for the announcement of Warsh being selected and sold as a hawk to the unknowing…..a guy that wants to cut rates very soon in the face of accelerating inflation, increasing oil prices, defense spending increasing by a half trillion….not to mention a potential war. The Comex also raised margin requirements for gold and silver futures contracts on Friday for effect on 02/01/26. Another part of the plan.
The problem is that the folks buying the contracts are standing for delivery at rates breaking records every month for the past year and a quarter. So when the contracts come to their date…..where will this seller get the silver and gold they sold Friday?
It does not exist….at least at these prices. If you thought early last week was wild…….just keep watching over the next 2 months.
It’s true that gold and silver needed to calm down. Gold just finished the fifth wave of the first wave of what should be 5 waves over the next 10 years or so. So the correction is not unwelcome….except for speculators. For stackers get ready for a great opportunity! The big crash in gold brought the price down…..ready…..to the price it was at 4 days earlier. January was still a record up month.
The mania is in the US stock market, commercial real estate, farm prices, and bond prices…..and everyone knows it except the folks pushing the manufactured data coming out of DC…..and the problem is that they are adding to the problem not correcting it.
US citizens should hope gold drops permanently as a sign that we are on the mend….but…..no sign of that happening….let’s hope it happens. Unfortunately the folks at the wheel just left the pot store in dad’s car and are having a grand old time while the BRIC sheriff is tailing them at a distance. Why confront your enemy when they are intent on suicide.
Each and EVERY COMEX contract is backed by actual gold on deposit in one of the approved repositories and that has always been the case for all COMEX metal contracts. The enormous sellers on Friday were the hot money ETFs which were the same ones that drove up metal prices in laughably stupid manic speculative territory over the past year.
Sorry…..no….that is not how it works.
I don’t mind being challenged but geez……
What I stated is EXACTLY how COMEX works. Read the rules on their CME website for yourself and learn to comprehend facts.
great stuff. i’m hearing similar things. comex buyers for delivery are going to overwhelm the place. remember the hunt bros in 1980. i’m sure the exchange will screw the buyers, again. warning. all empires come to an end. i was in russia in the 1990s doing business. the list of once great empires busting up is too long to list. at least my people left behind some nice aqueducts and coliseums and paved streets…………panem et circenses forever
Anyone have any thoughts they’d be willing to share on Truflation’s current CPI inflation reading of 0.86%? With the current mess of readings by Fed sources, is this closer to reality or b.s.?
@Sev: What time period?
Chat gpt: Truflation’s inflation rate tends to look lower because it uses a fundamentally different, faster‑moving methodology than the U.S. Bureau of Labor Statistics (BLS). Its real‑time, high‑frequency data sources react to price declines much earlier than the official CPI, which is slower and more rigid.
Truflation is a bullshit measure because it looks only at prices posted on the internet 🤣 not what people are actually paying. So when it looks at rents, it looks at “asking rents.” But asking rents the rents that landlord hope to get on their vacant units. No existing tenant pays asking rents. They’re paying actual rents. Actual rents change at renewal time, or at lease signing of new tenants. CPI tracks rents by housing units. It has a large panel of addresses that each get the survey regularly, and so it tracks how rents changed in each of those housing units over time. It’s the best rent data out there. Asking rents are NOT an inflation measure. They’re only important for RE people.
The fact that AI concocted this BS hallucination does not surprise me. The fact that you asked AI and posted its BS, that does surprise me. Unless you tried to be funny or make a point about AI
I think the FED is going to continue to “run it hot”. Bank credit continues to expand at high rates.
The big shift from other liquid deposits to demand deposits confuses me. It invalidates my time series.
I’m with Wolf… I use to monitor TruFlation but they changed something up about 2 years ago when they went to their subscription model. I believe it has become TruBS.
I put more faith in monitoring the NFCI and it has done nothing but get looser and looser over the last year or so. Which tells me the Fed has tried to talk down inflation on one side while keeping the facets running (slowly dropping rates). Maybe not full blast like the era of free $$$ (aka QE), but more than a trickle!
Easy $$$….
“Index Points to Looser Financial Conditions in Week Ending January 23
The NFCI decreased to –0.60 in the week ending January 23. Risk indicators contributed –0.33, credit indicators contributed –0.17, and leverage indicators contributed –0.10 to the index in the latest week.
The ANFCI also decreased in the latest week, to –0.60. Risk indicators contributed –0.36, credit indicators contributed –0.15, leverage indicators contributed –0.07, and the adjustments for prevailing macroeconomic conditions contributed –0.01 to the index in the latest week.”
I bought 28 day t bills back when the return was over 4%. I’m not doing that anymore since the rate has dropped and I can keep my money liquid in sgov or jepi and get similar returns. I don’t yet understand how to buy longer term notes, I don’t understand if the new rate goes up, the series you own is now worth less than you paid for it, therefore you must sell it at a loss, no thanks. I must be too dumb to learn a new trick.
I assumed as the debt gets bigger, the govt would need to offer higher rates if interest to keep buyers coming in the door, but kike someone above said, the hot money just keeps buying. And the t bill rates are controlled by the govt, and the bond market influences the rates if the notes. My brother in law also keeps saying the mortgage rates are going to come down, but I just can’t see that.
“I must be too dumb to learn a new trick”
Well put.
It’s pretty simple. You buy, you sell just like stocks. There is a bid and ask. It is not instant like stocks but the process is the same. Etrade has IMHO the easiest platform for “Bond Trading For Dummies”. Interest get’s paid semi-annually similar to a dividend. One added advantage of US bonds…no state tax.
You buy them at new auction, say thru vanguard.
You hold them for the whole duration then the treasury pays you.
Then reinvest them.
The treasuries can go up and down in value to other bond traders during the duration but none of that matters if you hold them the whole time. Say for example 5 years.
i don’t want to lock-up my capital that long. if the value of my holding drops, add in any dividends already recvd, then i can calc the real loss (or gain) and then sell if I want out? sound like an ETF like SGOV
Seems like a lot more work than buying a money market fund (paying 3.6%) that you can buy and sell any day you want.
Money market funds charge you 11 basis points tho
Treasuries charge you zero basis points. You do however have to clickety clack some buttons to purchase them and keep track of when they mature and when the new auctions are.
Why give these funds more money? The little guy needs all the help he can get.
Also there is the potential you accidentally time a treasury purchase for a rare kind that everyone wants badly in the future, then you can sell it and make a good bit.
All kinds of fun to be had with bonds.
Sure if you have the time and energy. Those 11 basis points are $1 on a $1000 investment. Even with compounding that changes the doubling time from 20 years to… 20.6 years. I’ll pay that to not have to deal.
Sunday night, red night: stock futures, gold, silver, major cryptos, WTI, major Asian stock indices (except Sensex).
i believe the world and amerikans are figuring out that we have a new pax amerikan empire. we have been an empire since at least 1898, of course, but now we are acting like every dictatorship known to mankind in the past 10,000 years. it’s a new world order my friends. i’ve seen this already, with my own eyes, in 2 locations in my first 65 years. fyi i am just a regular old man from NYC area whose lived all over this country, from bay area to AZ and SC, and travelled and done business from Russia in the 1990s………..to my simple life now, in the hudson valley. it’s hard for old men to handle reality, when what they thought was so, just ain’t that way, anymore. like in russia, the 20 and 30 somethings were thrilled at the collapsed evil empire. the old geezers north of 40 lost their minds……..i smell the same thing here in our pax dumbphuckistan. my people hail from the land of the Roman Empire. at least they left nice aqueducts and coliseums behind that lasted. the buildings in amerika are made of crap. my poor pals i grew up with learned that lesson on 9.11.01. remember when the plane crased into the empire state building. barely a scratch. we turned from the brick built little piggy to the house of straw piggy. good luck folks. we will all need it. ps. idiocracy was a documentary.
Conspiracy Theorists believe in new world orders. Look at history, stuff changes rapidly
There are no definites, if you believe in definites then you are wrong. And will be proven wrong.
ow my balls
The Monetary View: Advocates argue that inflation occurs when too much money chases too few goods, with excessive credit creation, low interest rates, or quantitative easing (QE) being the root causes. This perspective, rooted in the quantity theory of money, asserts that persistent, high inflation is only possible through sustained increases in the money supply.
Alternative Causes: Inflation can also be driven by supply-side shocks (e.g., energy price spikes, supply chain disruptions) or demand-pull factors that are not directly caused by money printing, even if they later require monetary accommodation.
Long-Run vs. Short-Run: While long-run inflation is generally recognized as a monetary phenomenon, short-term fluctuations can often be attributed to structural or non-monetary, supply-driven factors.
I’ll only add that there are now 8+ billion souls on this rock and all of them are competing for the very real resources and energy that is required for a decent standard of living. Hence, there is plenty of “demand” for real things. The laws of nature and physics are what they are and those things have a finite supply. This is why tribes go to war and based on the behavior I see around the world it would seem humanity hasn’t changed that much.
Hedge accordingly
The gold ETF (GLD) hit $514 at 6:40 pm Wed Jan 28, and $404 today at 1:40 am, so that is the trading range right now (!!!) until one or the other gets taken out. There are options strikes going up to 900 for GLD, and for the silver ETF they added strikes up to $210. That’s about as insane as it gets. The wild moves might last a while. It’s a casino for options traders and they can’t get enough. Once again, I’m not making any predictions, just an observation.
Yes. Also note the JP Morgan had almost 70% of the options contracts in precious metals, which they conveniently just exited…
Seriously though, it should be clear to everyone that the East (India, Asia) are now setting the price of commodities, not New York or London.
Interesting times.
Right now in Asia, while New York is asleep, and amid massive volatility, they’re setting the price of silver at $75, down 15-20% from a few hours ago, subject to change.
Hello Wolf. This is my first Comment here … I am a news junkie and am very aware-concerned about Geopolitics around the World.
I think today the Greatest concern for the US is the mounting Debt and interest-servicing costs. Very few in Congress seem to care about the unsustainable negative trajectory… Could the US government effectively become a Failed State?
We have a President that has alienated the US from the World including our ally’s in many ways. The compounding Problems caused by DJT is ‘pushing’ the Nations of the World to essentially want to Boycott the US.
Ok, here is the punch line – “Will the BRICS Nations be able to replace the USD as the Reserve Currency?” I see this happening now. As this transition occurs the US Debt spending will begin to explode and it will be almost irreversible. At the moment, I do not see how this problem can be solved.
Most of the BRICS currencies and expanded BRICS currencies have plunged against the USD over the past 15 years. Look at some long-term charts. At least two of the BRICS (the C and the I) are periodically shooting at each other across the border. Good luck waiting for a common BRICS currency that amounts to anything. The I and the R have total garbage currencies, look at 15-year charts that pair them against the USD.
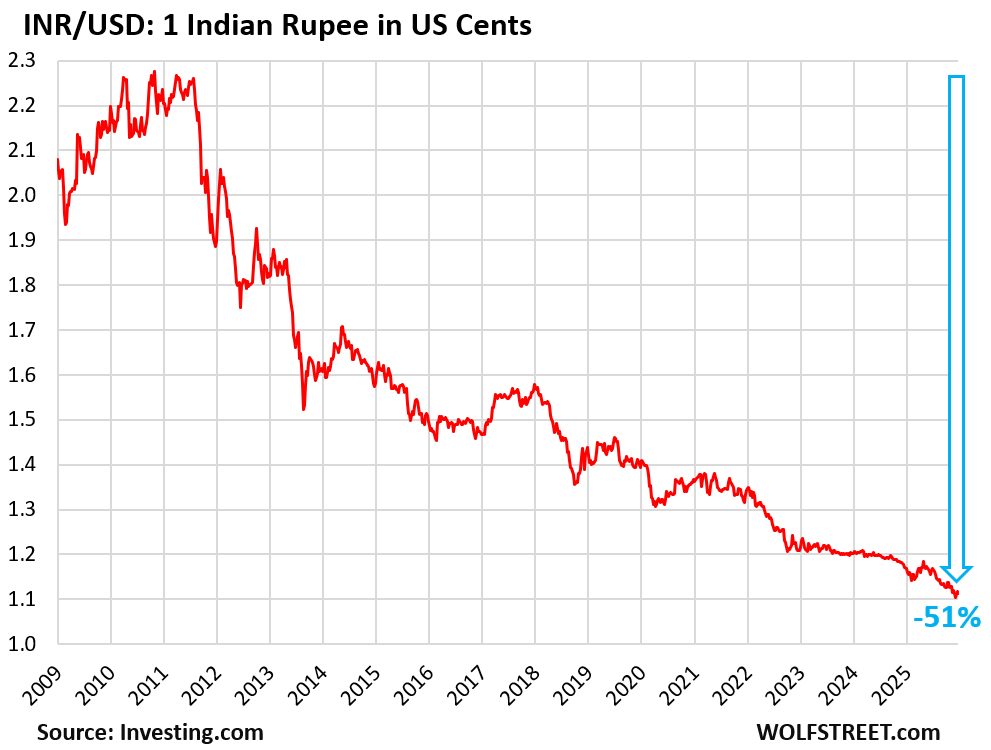
Here is the Indian rupee against the hated USD, which I just posted the other day:
Local cross-border trade has always been done in one or the other local currency, as negotiated between the importing and exporting companies. Companies in China and Russia trade with each other in their currencies which they negotiate as part of the deal. They never needed USD to trade. Same with all of Europe and all of Africa.
Whether countries use their own currencies or the USD to trade with each other has zero impact on the US. This constant BRICS nonsense is really getting old. You people need to look at some long-term charts.
We will need to watch this.
Project mBridge is a multi-CBDC (Central Bank Digital Currency) platform developed by the Bank for International Settlements Innovation Hub, China, Thailand, UAE, and Hong Kong to facilitate real-time, low-cost, cross-border payments. It utilizes a custom, permissioned blockchain to bypass traditional, slower correspondent banking systems, aiming to enhance speed, efficiency, and financial inclusion.
“Data crunched by the Washington-based Atlantic Council showed the prototype ‘mBridge’ platform, which is being tested by central banks in China, Hong Kong, Thailand, the United Arab Emirates and Saudi Arabia, had now processed more than 4,000 cross-border transactions.”
How the Federal Reserve is like Monopoly
1. The “bank” can create money
In Monopoly, the bank never runs out of cash. If the bills in the box run low, the rules literally say the banker can write IOUs or create more.
The Fed works the same way electronically:
– It can create new reserves with a keystroke
– It uses those reserves to buy assets
– New money enters the system
No taxes. No borrowing. No permission needed.
All modern central banks are structured to be able to do that. But the process works in reverse also (QT).
There was never any default in gold or silver at all contrary to your laughably clueless metallic buggie assertions. The whole concept of a ‘gold standard’ was just a brief and very failed 60 year experiment from 1873 until 1933 at which time it was entirely dumped for all domestic purposes and the US Treasury set the fixed price of gold at $35 per ounce.
So?
Only external forces determine if the US treasury and fed are wrong.
Internally, yep they can do whatever, but external will get angry.
Always consequences
Lower Fed rates to keep Tbills rates down, QT to keep Notes and Bonds down. Honestly the 4-week bill should pay just over inflation since it’s a temporary place to park your spare thousands or billions. The ten-year should cover inflation+taxes+a bit for your trouble.
Resuming QT at even $35B a month will do wonders for inflation expectations while really doing nothing to liquidity. The AI bubble and cryptos might not like it but too bad.
Gold Prices Tumbled for a Deeper Reason and the Pain May Not Be Over Yet
Gold investors got a sharp wake-up call last Friday as prices dropped suddenly and decisively. While many rushed to pin the move on headlines or policy speculation, the real driver sits deeper beneath the surface. Sentiment in the gold market remains far too optimistic, and history suggests that is rarely where durable bottoms are formed.
Even after last week’s drop, investor positioning in gold remains elevated by historical standards. That matters because extreme optimism tends to appear near market tops, not durable lows.
One of the most widely followed indicators of gold market sentiment is the Hulbert Gold Newsletter Sentiment Index, or HGNSI. It tracks the average recommended exposure to gold among dozens of market timers and newsletter writers.
Before Friday’s decline, the HGNSI was sitting near levels almost never seen over the past 25 years. It ranked in the 99.7th percentile of all daily readings since 2000. In plain terms, gold exposure recommendations were more aggressive than on nearly every other day over the past quarter century.
After gold sold off, sentiment barely budged. The HGNSI still stands higher than on 84.4 percent of all trading days since 2000. For contrarian investors, true buy signals tend to emerge only when that figure drops below 10 percent. That gap matters. It suggests that while prices have fallen, belief has not. And markets rarely bottom until confidence breaks.
That’s pretty detailed analysis for a guy who says gold doesn’t matter. Why the need to bash hard assets?
I’ve always said, treasuries are OK to own but a person needs to hedge that with other that provide inflation protection. If everything is in treasuries including TBills), the monetary and fiscal authorities can bleed you out.
One form of disaster is watching your investments provide near zero return for many years, while others rack up 20-50% returns. Your piece of the pie shrinks significantly.
Gold has no financial relevance at all and for anyone to think it may or does that is completely delusional.
The US has been addicted to the Fed’s inflationary policies and massive government spending for decades. How does an economy fare when it is dependent on perpetual rising asset prices but money supply contracts?
Trump has a pattern of saying one thing and doing another. Would it be of any surprise if the nomination changes at the last moment?
1:04 PM 2/2/2026
Dow 49,407.66 +515.19 1.05%
S&P 500 6,976.44 +37.41 0.54%
Nasdaq 23,592.11 +130.29 0.56%
VIX 16.34 -1.10 -6.31%
Gold 4,844.50 +191.90 +4.12%
Oil 61.99 -0.15 -0.24%
One has to wonder will the 7000+ S&P be the curse that breaks the camels back? 🤔 ⬇️
Monetarism was debunked a long time ago. Put up a chart of M2 or Fed balance sheet vs CPI and there’s no consistent relationship. Remember how the GFC balance sheet expansion (didn’t) cause the hyperinflation all the monetarists predicted?
Not that money supply has no relevance to inflation, but money velocity plunged in the 2000s and 2010s and has remained near the lows. And a lot of things affect inflation other than money supply and velocity.
Yes, the Fed should reduce its balance sheet (and has been), but gradually, watchful for reserve insufficiency, and not because it will pull down inflation enough for rates to be slashed and the economy run hot without concern.