Germany, France, Italy, Spain, Netherlands, Poland, Belgium, Sweden, Ireland, Austria, Norway, Denmark, Romania, Czech Republic, Finland, Portugal, Hungary, Bulgaria.
By Wolf Richter for WOLF STREET.
Prices of existing homes of all types (“dwellings”) in the 18 largest countries in the European Union (EU) and in the European Economic Area (EEA) have not moved in lockstep:
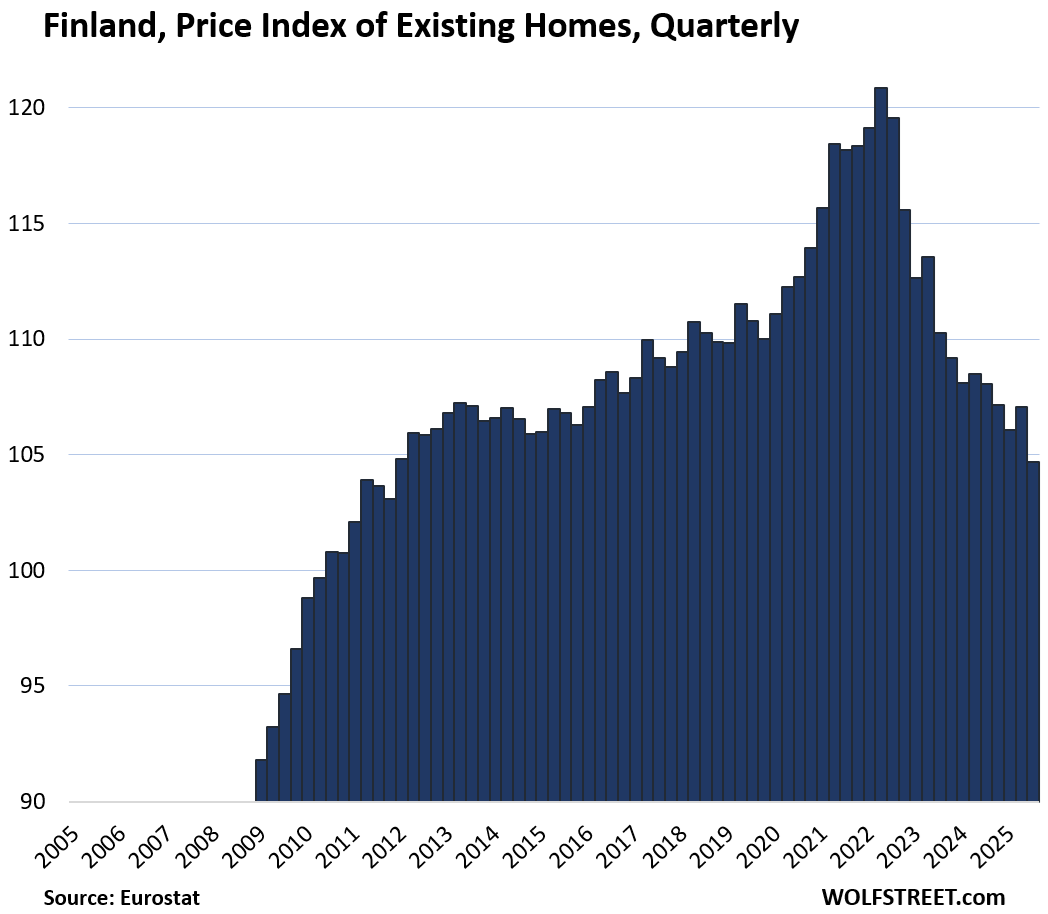
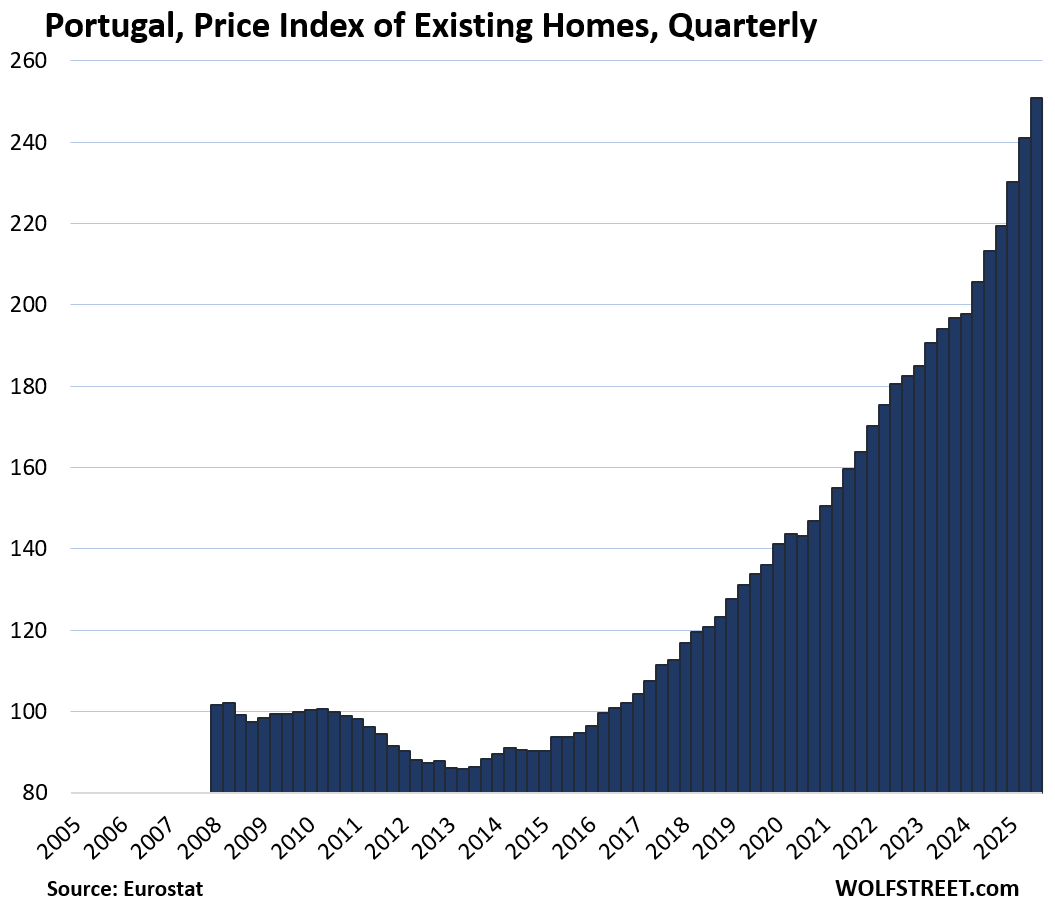
In some countries they have exploded in recent years, such as in Hungary (+21% year-over-year, +296% since 2010) or in Portugal (+18% YoY, +150% since 2010); they have surged in many others; and they don’t look so rosy in markets such as in Finland (-3.1% YoY, -13% from 2010).
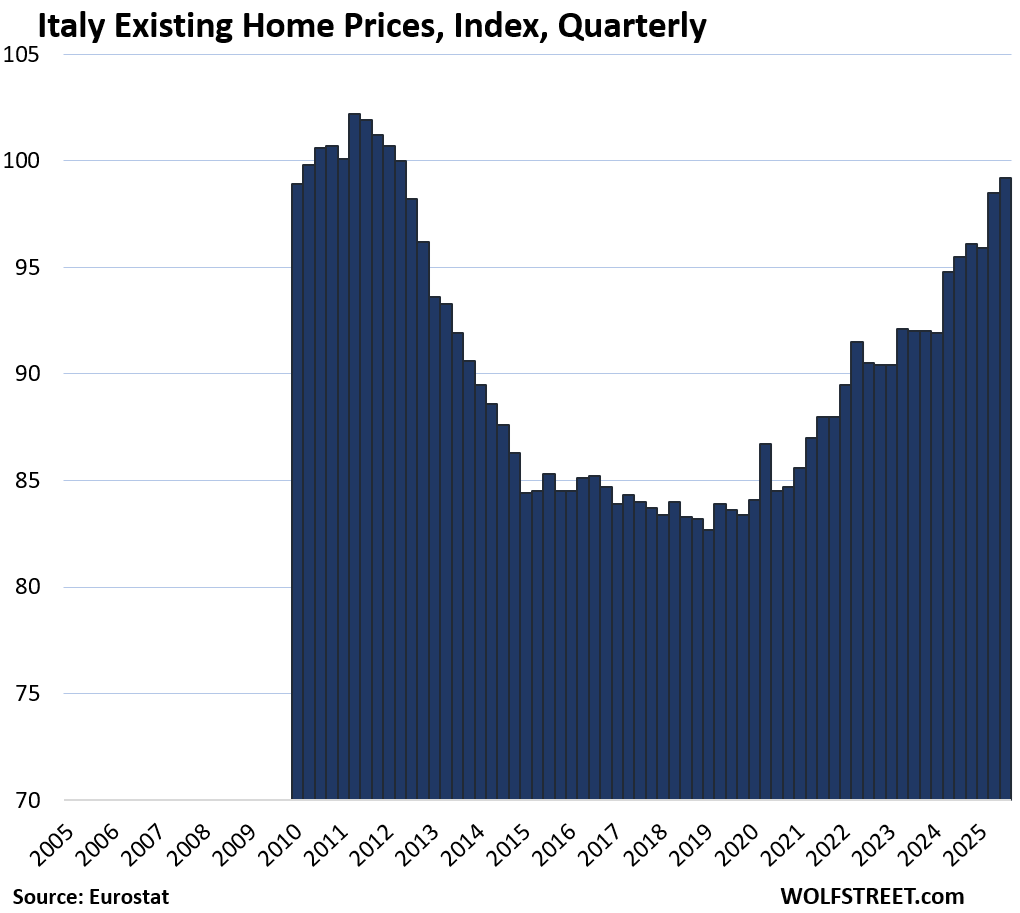
In Italy, despite the blistering surge, prices are still below 2010 during the prior housing bubble that then imploded.
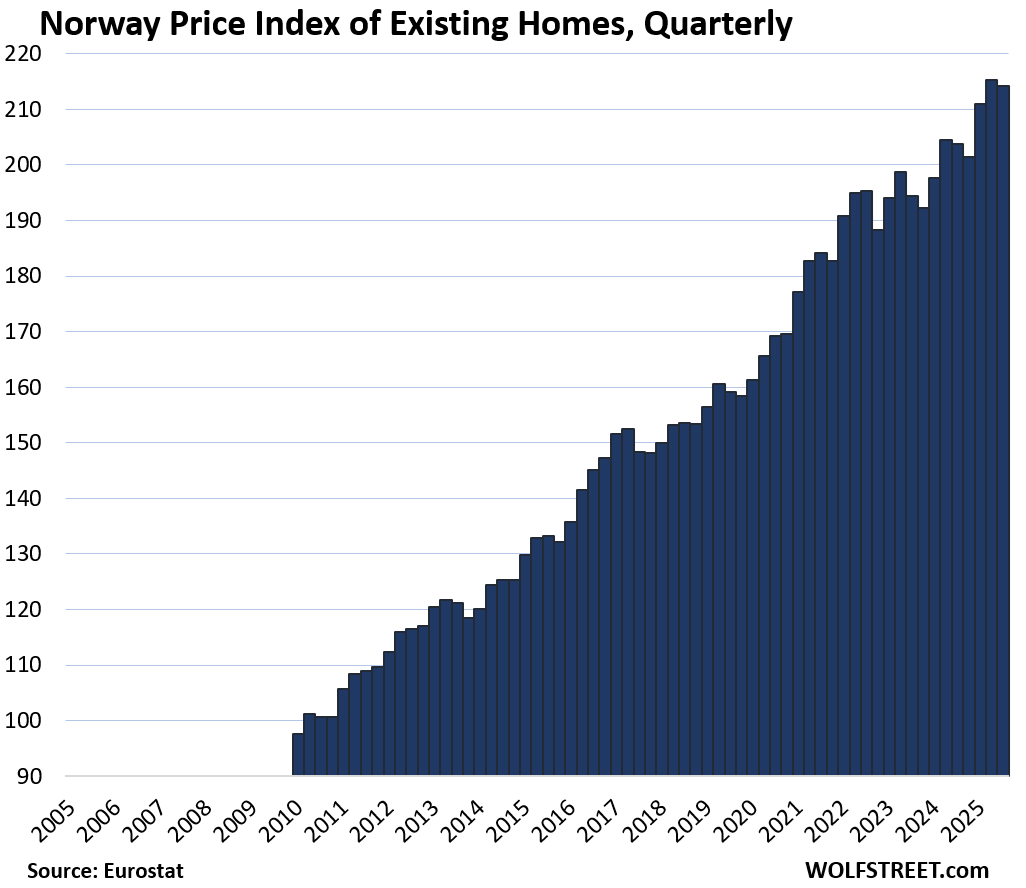
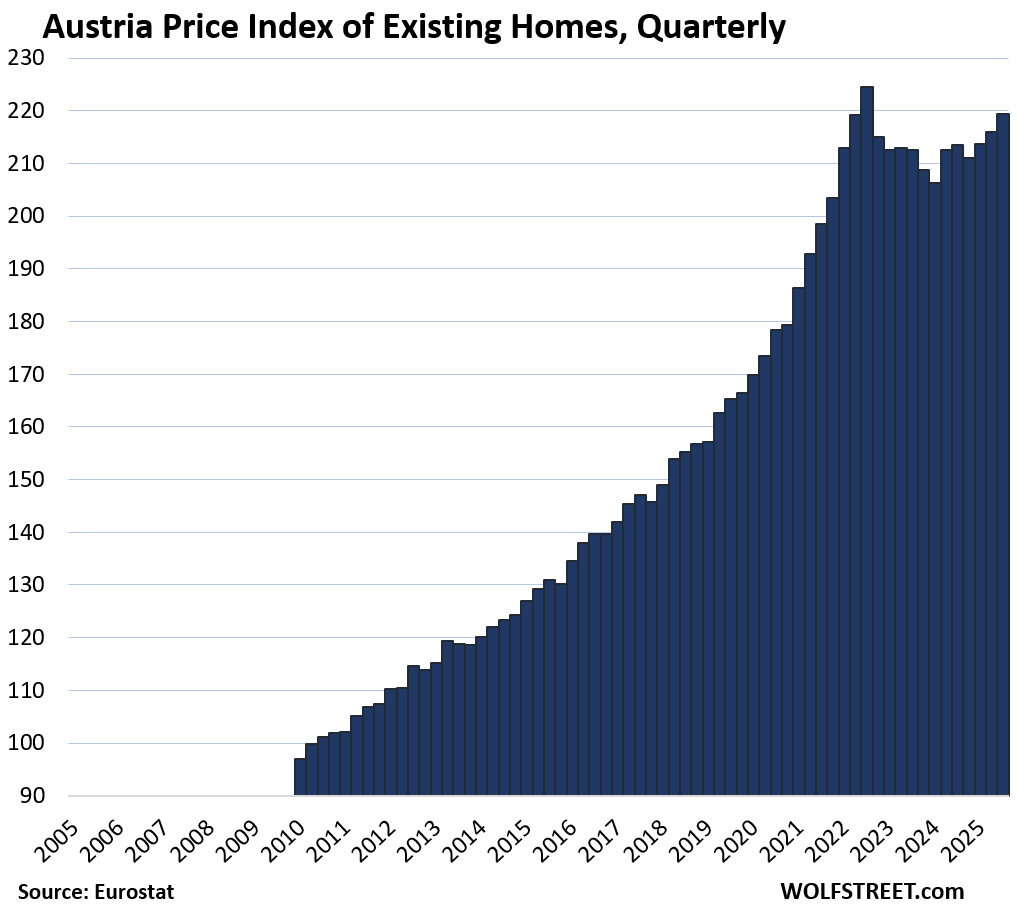
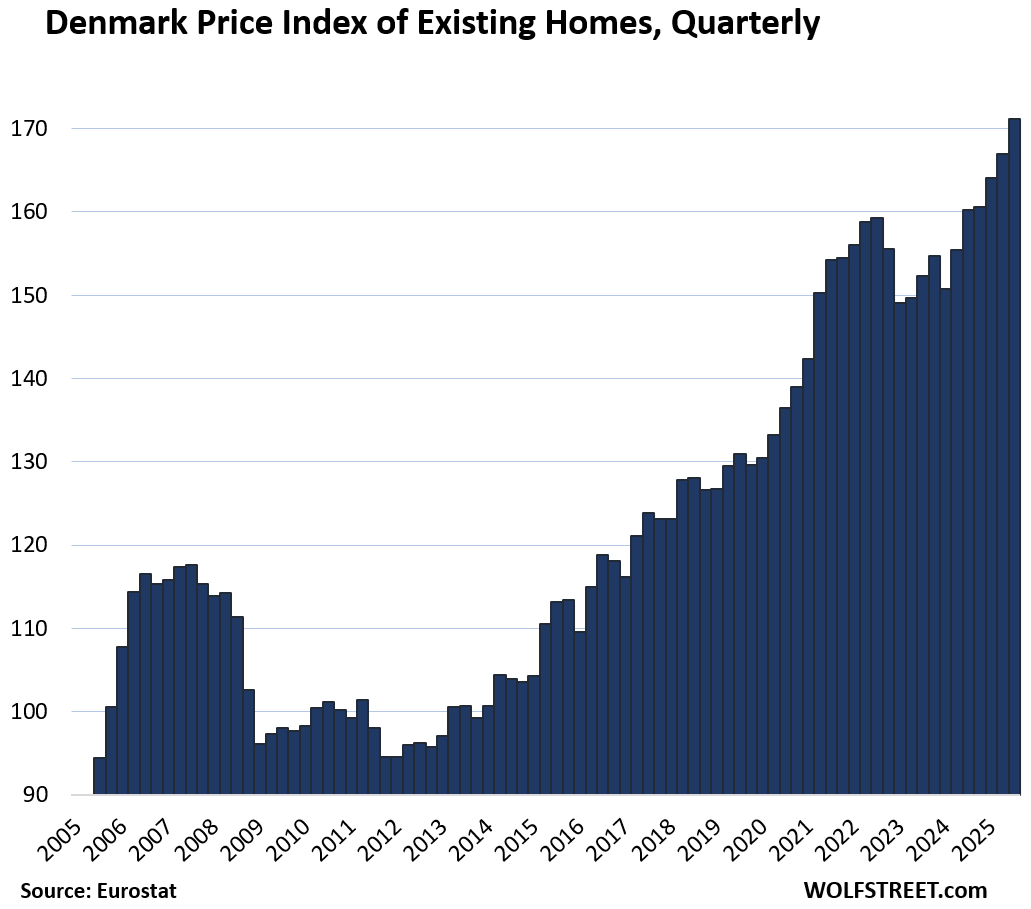
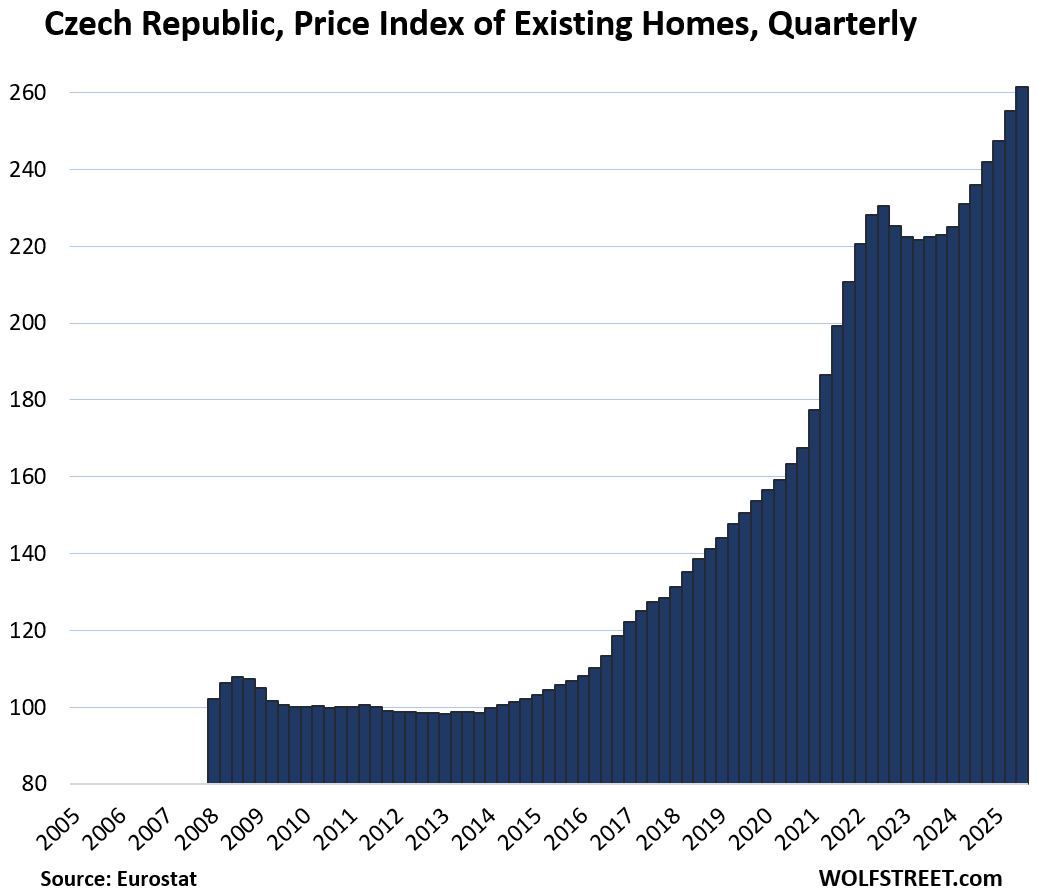
Here is a wild ride across the housing markets of the biggest countries by GDP, based on data from Eurostat through Q3 on Friday. The data goes back to 2005 for some countries, and less far for other countries; but I put all of them on the same timeline going back to 2005 for easier comparison. The vertical axis represents the index value; the index was set with a value of 100 for 2010.
Prices declined from peak in prior years in 6 of the 18 countries (year of peak):
- Finland: -13.4% (Q2 2022), back to 2010 levels.
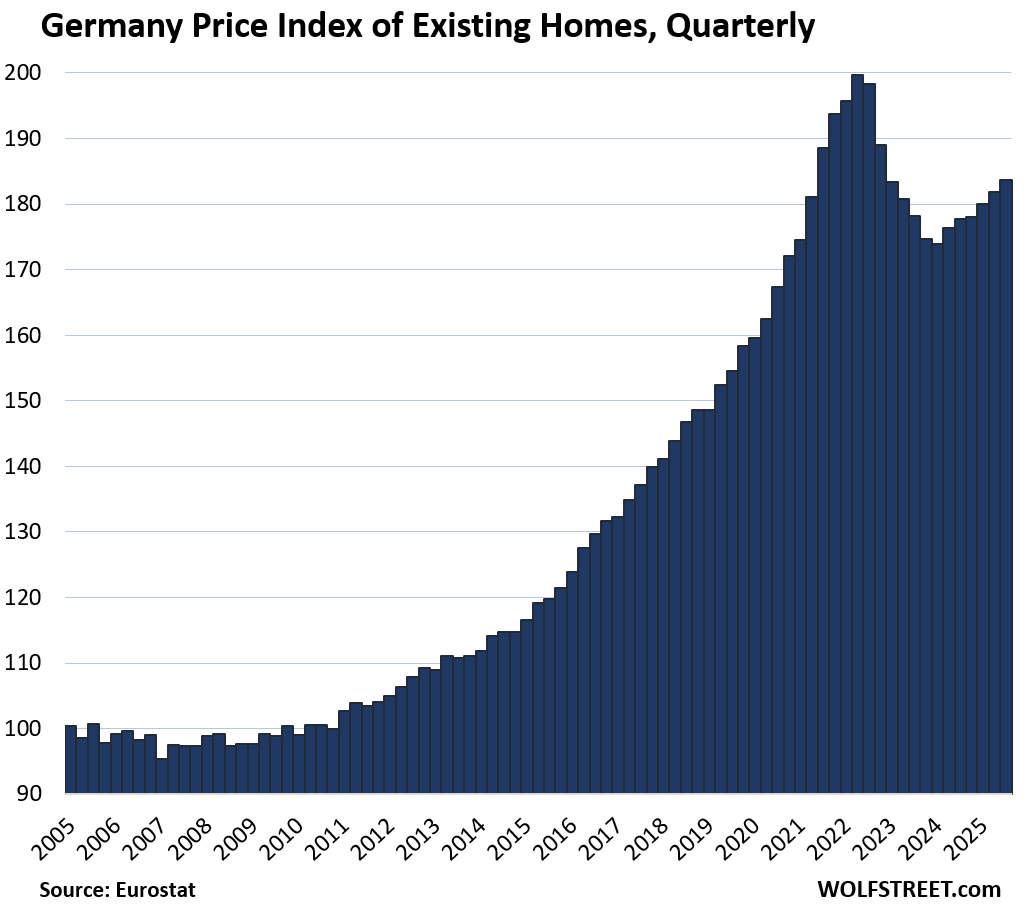
- Germany: -8.1% (Q2 2022)
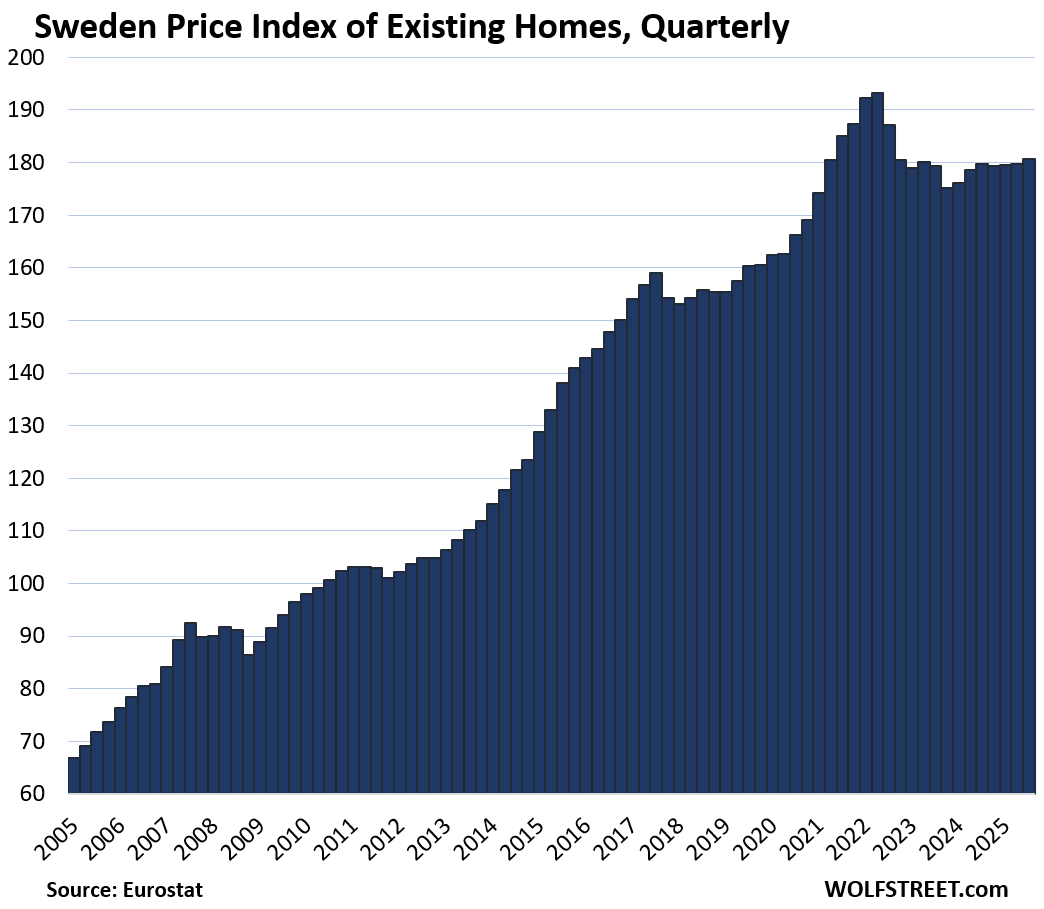
- Sweden: -6.4% (Q2 2022)
- France: -4.3% (Q3 2022)
- Italy: -2.9% (Q2 2011)
- Austria: -2.3% (Q3 2022)
Biggest price gains since 2010:
- Hungary: 296%
- Czech Republic: 162%
- Portugal: 150%
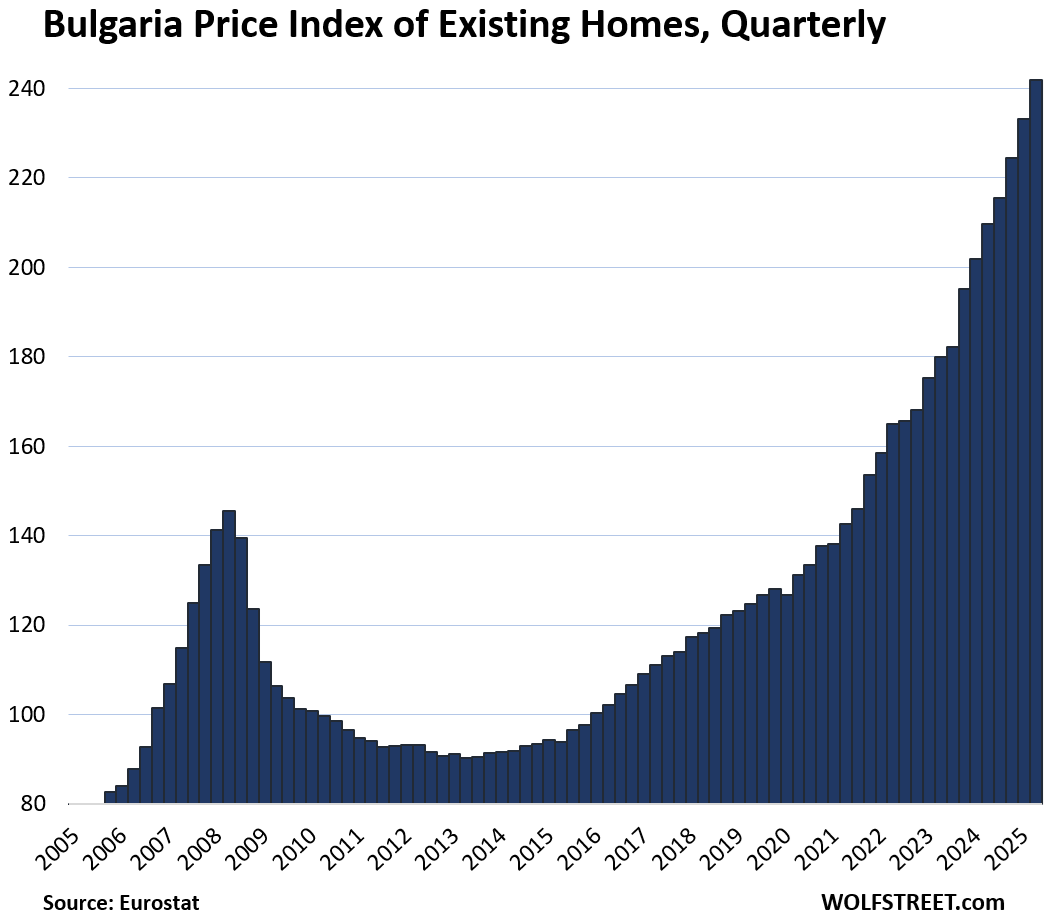
- Bulgaria: 139%
- Austria: 126%
- Norway: 120%
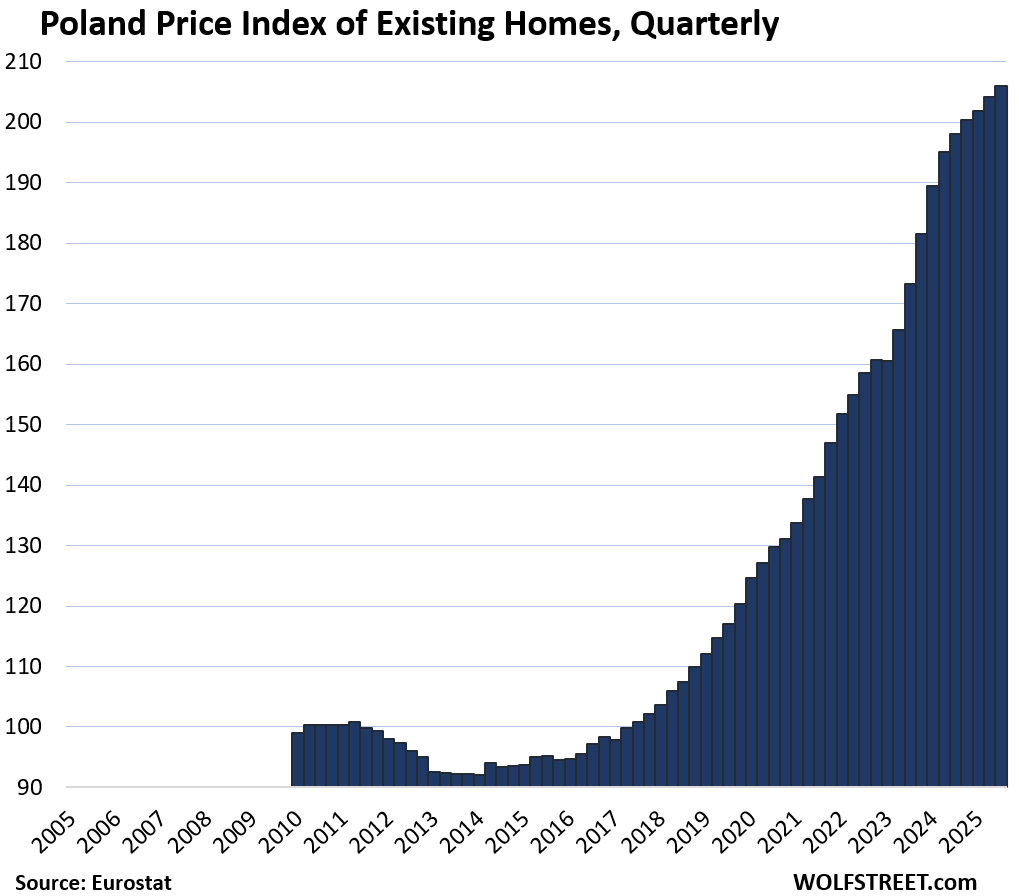
- Poland: 108%
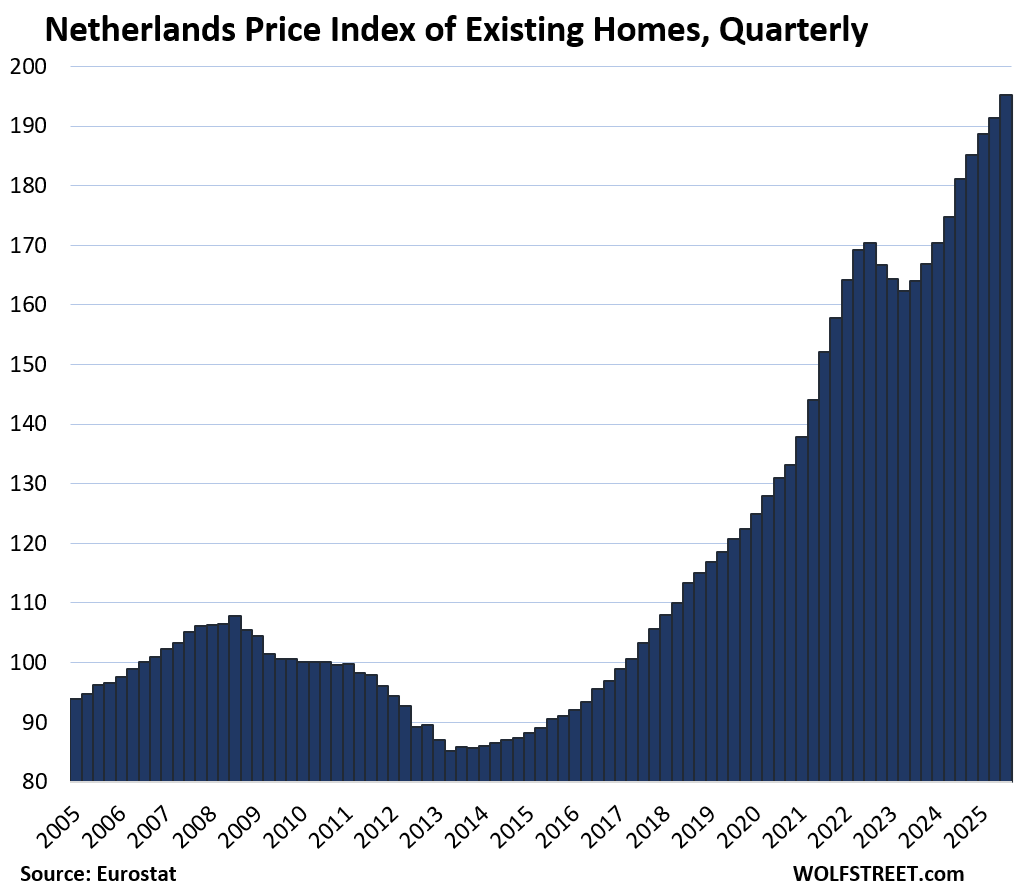
- Netherlands: 95%
- Sweden: 85%
- Germany: 85%
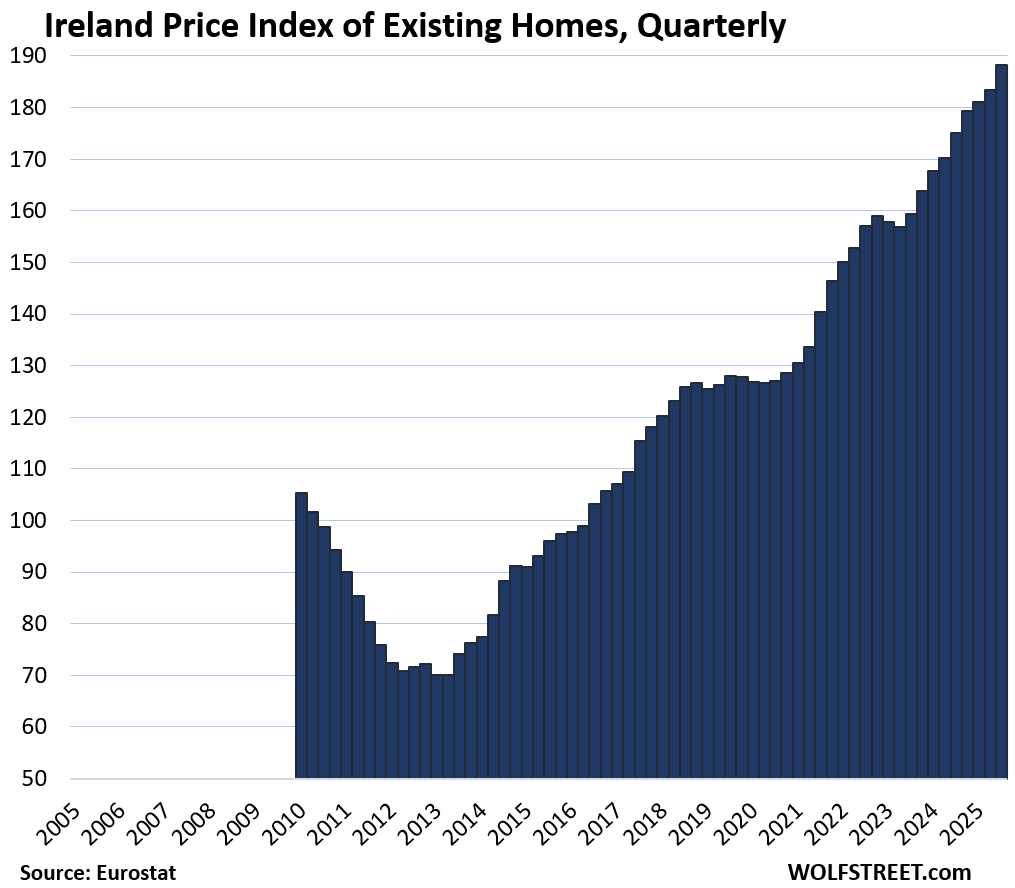
- Ireland: 79%
- Denmark: 74%.
Biggest year-over-year gains:
- Hungary: 21.1%
- Portugal: 17.7%
- Bulgaria: 15.4%
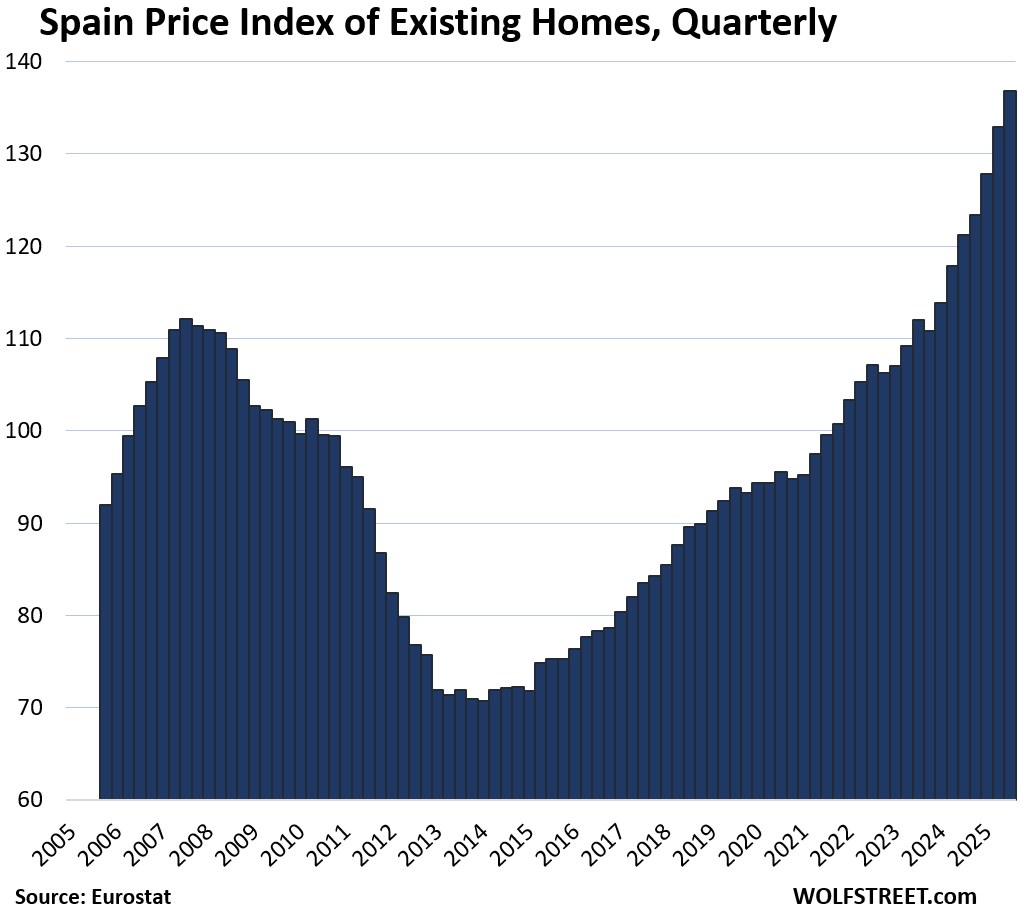
- Spain: 12.8%
- Czech Republic: 10.8%
- Netherlands: 7.7%
- Ireland: 7.5%
- Denmark: 6.8%
- Romania: 6.6%
Biggest quarter-over-quarter gains in Q3:
- Portugal: 4.1%
- Bulgaria: 3.8%
- Hungary: 3.1%
- Spain: 2.9%
- Ireland: 2.6%
- Czech Republic: 2.5%
- Denmark: 2.5%
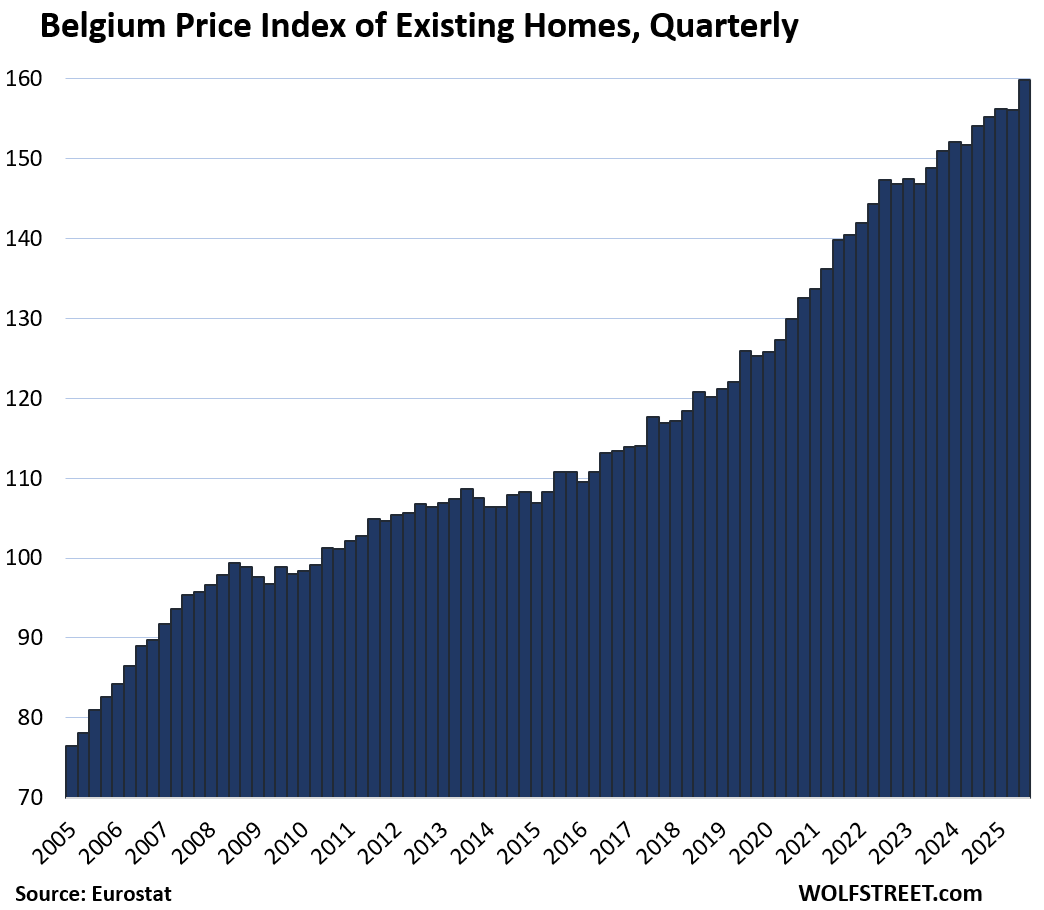
- Belgium: 2.4%
- Romania: 2.3%
- Netherlands: 2.0%
The two countries with quarter-over-quarter declines in Q3:
- Finland: -2.2%
- Norway: -0.5%.
The home price indices for the 18 largest countries in the EU or EEA:
The little tables show either three or four columns, from left to right: % change since 2010; quarter-over-quarter (QoQ) % change; year-over-year (YoY) % change; and % decline from the peak, if applicable.
| Germany, Prices of Existing Homes | |||
| since 2010 | QoQ | YoY | From peak |
| 85% | 1.0% | 3.3% | -8.1% |
| France, Prices of Existing Homes | |||
| Since 2010 | QoQ | YoY | From peak |
| 33% | 1.6% | 0.7% | -4.3% |

| Italy, Prices of Existing Homes | |||
| Since 2010 | QoQ | YoY | From peak |
| 0% | 0.7% | 3.9% | -2.9% |
| Spain, Prices of Existing Homes | ||
| Since 2010 | QoQ | YoY |
| 37% | 2.9% | 12.8% |
| Netherlands, Prices of Existing Homes | ||
| Since 2010 | QoQ | YoY |
| 95% | 2.0% | 7.7% |
| Poland, Prices of Existing Homes | |||
| Since 2010 | QoQ | YoY | |
| 108% | 0.9% | 4.0% | |
| Belgium, Prices of Existing Homes | |||
| Since 2010 | QoQ | YoY | |
| 62% | 2.4% | 3.7% | |
| Sweden, Prices of Existing Homes | |||
| Since 2010 | QoQ | YoY | From peak |
| 85% | 0.5% | 0.5% | -6.4% |
| Ireland, Prices of Existing Homes | |||
| Since 2010 | QoQ | YoY | |
| 79% | 2.6% | 7.5% | |
| Norway, Prices of Existing Homes | |||
| Since 2010 | QoQ | YoY | |
| 120% | -0.5% | 5.1% | |
| Austria, Prices of Existing Homes | |||
| Since 2010 | QoQ | YoY | From peak |
| 126% | 1.6% | 2.7% | -2.3% |
| Denmark, Prices of Existing Homes | |||
| Since 2010 | QoQ | YoY | |
| 74% | 2.5% | 6.8% | |
| Romania, Prices of Existing Homes | |||
| Since 2010 | QoQ | YoY | |
| 34% | 2.3% | 6.6% | |

| Czech Republic, Prices of Existing Homes | |||
| Since 2010 | QoQ | YoY | |
| 162% | 2.5% | 10.8% | |
| Finland, Prices of Existing Homes | |||
| Since 2010 | QoQ | YoY | From peak |
| 6% | -2.2% | -3.1% | -13.4% |
| Portugal, Prices of Existing Homes | |||
| Since 2010 | QoQ | YoY | |
| 150% | 4.1% | 17.7% | |
| Hungary, Prices of Existing Homes | ||
| Since 2010 | QoQ | YoY |
| 296% | 3.1% | 21.1% |

| Bulgaria, Prices of Existing Homes | ||
| Since 2010 | QoQ | YoY |
| 139% | 3.8% | 15.4% |
Enjoy reading WOLF STREET and want to support it? You can donate. I appreciate it immensely. Click on the mug to find out how:

![]()
Finland is a shocking exception, as one of the 4 Euro nations to increase in price between 2009-2014, but the only one of any Euro nations to be back at 2010 prices, despite a steadily increasing population since 1965.
an AI engine stated: “Finland’s housing prices dropped back to 2010 levels due to a combination of soaring variable interest rates (rapidly increasing mortgage costs), a significant oversupply of new apartments from previous building booms, weak household purchasing power from slow wage growth, and general economic uncertainty, leading to decreased demand”
You need only two words to explain that: Nokia iPhone
The collapse of Nokia was around the 2008 times and it impacted Finland considerably.
Make sense.
I used to work for Blackberry/Rim. I should have guessed about Nokia.
Lots of layoffs, lots of fall in equity holdings.
Not sure of the steadily increasing pop. Total Pop 2024 5,549,886, Total Pop 2023 5,583,911, Total Pop 2022 5,556,106 (macrotrends.net). Not too friendly to immigrants anymore either
May have also something to do with the Russian war. My understanding is that some of the towns closer to the Russian border are suffering economically.
Half of Saint Petersburg used to go there shopping. Some bought summer houses there.
Finland decided to go austerity mode in pretty much all policy decisions since the current government came into power, right into a soaring interest rate environment, in a country where the vast majority of mortgages is adjustable rate. And are even now planning to cut their way to prosperity.
Yes, wage inflation was successfully tamped down (with the government cutting strike rights etc), but you know what? That means the purchasing power of households is also weaker than before, as the inflation burst’s elevated prices don’t go away – or if they do, very very slowly. How odd that the economy is now in a deep freeze and the home prices right there with it.
Additionally, when it comes to apartments, there are some specifically Finnish debt “innovations” from the last decade that allowed the prices in high demand areas to inflate beyond reason even if the overall housing indexes didn’t budge much. But as a result, now there are lots of apartment buildings built in 2021 or 2022 that are just about overloaded with debt, to the point no one dares buy apartments in them.
what is the actual price of these homes in usd?
It all depends of country and location. From my experience I can share ehat I see: Averages starting: NL house, some 600K (Amsterdam 1,2M) apartment 400K, Spain big cities: houses 800K, apartment 400K, smaller towns: apartment 150K. Bulgaria (Sofia), apartment 250k.. Small villages: dirt cheap…
Here is the reality in Bulgaria, the poorest country in the EU.
In the capital Sofia, the average price per m2 is around 2500 euros or 2155 usd. The average gross salary is 1789 euros or 1529 usd. The prices of goods and services are almost the same as in Western European countries
Here is a comparison between Vienna, which was the number one city to live in the world for a decade, and the third largest city in Bulgaria – Varna.
Vienna registered 18,865,000 overnight stays, and Varna – 3,561,074, meaning Vienna welcomed 5.3 times more tourists in the same year; also, the desired average salary in Varna is 1,160 euros – compared to the usual 4,260 euros in Vienna. We also compare Bulgaria’s GDP – 103.4billion euros, and that of Austria – 485 billion euros (because the bulgarian statistic does not have detailed statistics by city). We note that Austria has a GDP 4.7 times larger than Bulgaria. Let us note, however, that we are comparing an imperial capital in Western Europe and a provincial town without highway access to the capital and neighboring cities. With a difference of about 5 times in GDP, number of tourists and level of salaries, prices per m2 in Favoriten (10th district) and Margareten (5th district) in Vienna are around 4827 euros and 4070 euros respectively, and in the Chaika district in Varna they are 3000 – 4000 euros per m2.
Or to buy 1 m2 in Vienna at 6500 euros per m2, 1.3 gross monthly salaries are needed. To buy 1 m2 in Varna, 1.1 gross salaries. Keep in mind that the capital Vienna is a former imperial city and currently leading the ranking for the best place to live, and Varna is a provincial city that does not even have a highway connecting it to the capital and even to neighboring cities.
The Bulgarian real estate market is in a bubble that is much bigger than that of Toronto when all indicators such as prices per m2, salaries, GDP and accessibility are taken into account.
* The average gross salary is 1,789 euros or 2,093 US dollars.
I’m from Spain.
We are kind in the same situation here.
Our euro and eeuu mates want to live in our cities as we made them very attractive.
we should let them our houses , of course.
Spain try to impose some kind of additional tax to foreigners, but europe went nuts about it.
So here we are, paying MORE in Barcelona and Madrid than other big metros but salaries are 1/2 of foreigner salaries.
maybe we all find another way…
There is a big difference between Spain and Bulgaria. In Spain, properties are bought by Americans, Germans, English and people from all over the world, even Bulgarians.
In Bulgaria, the net flow of foreign investment in real estate for the period January-September 2025 was negative at EUR 11.5 million, increasing nearly fivefold compared to the negative flow of EUR 2.5 million a year earlier.
Not only are foreigners not buying properties in Bulgaria, but those who have bought are selling and fleeing.
That’s basically the same phenomenon as when Americans during COVID took their NYC and Bay Area salaries to previously cheap areas of America and bid the prices up.
It’s a huge problem, but I don’t have a solution for it.
Wife and I wanted to buy a home in Spain on the Costa del Sol as a vacation/retirement home (we don’t own a first home, we’re millennials!) But then Drumpf took office again and the dollar fell ~12% against the euro and it became out of reach. So you guys dodged a bullet there! (My wife is an EU citizen so we are legally allowed to buy still).
I feel for the Spanish people with prices getting arbitraged up, but we have had to look at options like this because we simply can’t afford to buy in the US. Homes are at around 6x incomes, even in non-prime areas.
Bulgaria recently launched the digital nomad visa. A beautiful country coupled with a low COL, it could explode in popularity.
“A beautiful country coupled with a low COL,”
“beautiful”, yes, cheap properties, no.
For 200-250 thousand euros you can buy an apartment anywhere in Europe except for the central areas of the capitals of the countries.
The same goes for American and Canadian cities.
In Bulgaria it has become ridiculously and unrealistically expensive
I think German property is one of the most attractive investment opportunities at the moment. Prices are rebounding and are supported by increased immigration and high building costs. Most importantly, there are several listed residential REITs which are trading at extremely large discounts to NAV, some as large as 50 percent.
Maybe because NAV reflects highly inflated multifamily valuations based on prices from years ago that have now gone down substantially? This is what happened in the US multifamily space. Lots of multifamily landlords collapsed because they couldn’t make their debt payments and the properties were seized by lenders.
In terms of US REITs, many of them have plunged by 50% or more because of the issues in multifamily CRE.
Is it a good time to buy REITs in the United States? Residential seems as though it would be pretty safe however I would still be leery about commercial wreaths I’m assuming there’s still a lot of Fallout to take place. What about investing in foreign REITs are they available in other countries?
Excellent article, the charts look just like they do here in the US.
Global asset bubble?
More like global labor devaluation. Think of the costs/median hourly salary worked for these properties.
Finland used to be neutral and had thriving cross border commerce with Russia. Recently, they joined NATO and closed the border. Their president Stubbs keeps pushing for war with Russia. Who would want to invest in Finnish real estate?
Who would want to live next to a demented, belligerent neighbor like Russia? FTFY. I mean, prices sure look like they started to decline after Russia invaded their sovereign neighbor, Ukraine.
Finland did, with very little problems, for 70 years as a neutral nation.
Then something changed…
“Then something changed?”
Yes. Russia invaded a neighboring country in 2022 and is still waging a brutal war against it to take what it hadn’t taken in 2014. Russia’s neighbors, including Finland, now know that they could be next. That’s what happened. Finns understand that perfectly.
It’s so hard to tell the Russian bots from a third or more of Americans now.
“Their president Stubbs keeps pushing for war with Russia.”
Finland’s history of aggression against Russia is troubling indeed. With a population of 5.6 million against Russia’s 140 million, a 0.3 trillion GDP versus Russia’s 2.5 trillion, and a history of being invaded by Russia (“Winter War”), it is hard to understand why they would be massing troops and preparing defensive fortifications against a peaceful neighbor that just wants to take it under it’s benign, motherly wing, as Russia is trying to do with Ukraine right now.
Baffling, really.
Negative mortgage rates caused a bubble. Young couples have to sign
a $1 million mortgage, piling debt.
All very location dependent, of course, within each country. In Portugal, houses and apartments in Lisbon and Porto have become quite expensive, but in the “interior”, where I live, there are bargains to found.
My house, ~140sq/m, cost <€200k including aa substantial renovation. It is in a charming town, with a beautiful view, etc. The same type of home would cost ~€400k or more in either of the major cities.
Also worth considering are property taxes, which can vary wildly from country to country. I owned a condo on Long Island for many years, and I'm sure some readers are familiar with the high taxes on properties on LI. In Portugal, I pay )
I’ve noticed something similar browsing home listings across Europe.
Rural is trash. Everyone wants to live in a city apartment.
And this is strange. Did work-from-home not come to Europe? Or is it just a difference in values that leads European to prefer life in cities?
The whole point of moving to Europe is to live somewhere dense and walkable. If I wanted rural living I would stay in America. Even rural parts of California can be dirt cheap, but I’m so sick of having to drive everywhere. I’m very close to leaving this state myself
Villages in Europe are often very dense, but just lack the agglomeration to enable a wide range of restaurants, western-style supermarkets, etc. to be economically viable. Europe is much more like the US in suburbanization than most westerners understand, with most people living in suburbs and shopping via car much like the US, because it’s more efficient. The issue is most visit old Paris for a week and it’s about as realistic a representation of modern European life an Disneyland.
“Did work-from-home not come to Europe?”
No, it didn’t. First, there are very few proper tech jobs, either at tech companies or an a tech guy inside an old-line business.
Many countries still have very rigid rules on physical locations for taxation. In the small EU country I live in, it is very common for workers to cross the border for work. There is a very rigidly enforced rule on how many days you can work from home and be taxed in the country you work in rather than the country you live in.
Many company have now established wework-type setups immediately across the border to reduce commuting burdens.
<€400.
Europe is old. In the major cities contractors erased a few old buildings and erect clusters of 40/60 floors multi apt buildings, using the illegals. In smaller cities 8/15 floors multi. Prices will stay at high plateau, protected by the ECB, in order to prevent bubble collapse #2.
Inflation will reduce prices in real terms, but it will take a decade or two. Europe, unlike China, will constrict supply, to keep prices high.
Bulgarian RE prices bubble was fueled by accepting the Euro as national currency in 1/1/26. So basically all illegal money went into real estate by the end of the year. Now it will be over.
So, housing prices going ballistic in most all countries. And those countries with price declines, the declines are minumal.
As the Joker said in Batman – “It’s all part of the plan!”
Poland was affected by the influx of hundreds of thousands of Ukraine refugees, many of whom were of wealth and brought their money with them. They went on a buying spree of properties. I suspect this is a big factor on the increases there.
Ukrainian wages and wealth are and were about at the level of Mexico. So it would seem odd for them to be able to have such an effect.
Also, as Wolf’s charts show:
1) Poland housing prices started rising several years before February, 2022, and
2) European housing prices have risen even in places that are not hosting a Ukrainian diaspora.
The U.S. attorney’s office in the District of Columbia has opened a criminal investigation into Jerome H. Powell, the Federal Reserve chair, over the central bank’s renovation of its Washington headquarters and whether Mr. Powell lied to Congress about the scope of the project, according to officials briefed on the situation.
The inquiry, which includes an analysis of Mr. Powell’s public statements and an examination of spending records, was approved in November by Jeanine Pirro, a longtime ally of President Trump who was appointed to run the office last year, the officials said.
The investigation escalates Mr. Trump’s long-running feud with Mr. Powell, whom the president has continually attacked for resisting his demands to slash interest rates significantly. The president has threatened to fire the Fed chair — even though he nominated Mr. Powell for the position in 2017 — and raised the prospect of a lawsuit against him related to the $2.5 billion renovation, citing “incompetence.”
Upon the news, stock futures began sagging. Nasdaq futures -0.8. At this moment, the chart looks like a rug pull.
And it should be but let’s see by the time tomorrow when market opens, if they will just put on their nothing burger hat and sweep it under the rug and rocket the market higher….for a while now, seems like nothing can shake the confidence of the market.
To anyone that still think we live in a normal time, rule of laws, functioning democracy…etc…yeah that ship has long sailed. Would love to hear them argue how this is totally justified….
Trump doesn’t have a chance. Powell, at the core foundation of his being, is a CYA focused lawyer. On top of that, he has $100 million to defend himself against anything the courts can throw at him. Trump better hope he doesn’t countersue.
All you have to do is merely read all of history or even just American history.
As soon as I saw the news, I hopped over here for the comments. At some point, all those people who have been worshipping at the altar of “unitary executive theory “ have to splash some cold water on their faces and and sober up.
Trump can’t wait five months? Powell’s term is over in May. Trump wants the Fed to lower rates. All the Fed can do is lower short-term rates, which we have seen over the past few years leads to higher long term rates. I support most of Trump’s decisions, but this one leaves me shaking my head. Bessent needs to have a serious conversation with Trump. Probably too afraid.
@thurd2,
Powell doen’t have to step down. He can stay another two years at the Fed after he leaves the Chair position. I hope he does.
“Trump better hope he doesn’t countersue.”
Then today, Republican senator Lisa Murkowski:
“After speaking with Chair Powell this morning, it’s clear the administration’s investigation is nothing more than an attempt at coercion. If the Department of Justice believes an investigation into Chair Powell is warranted based on project cost overruns—which are not unusual—then Congress needs to investigate the Department of Justice.”
QED
Hungary did not adapt the € as currency and the central bank was running a devaluation-focused monetary policy to boost exports (mainly to Germany, but also to other trading partners globally).
That probably does not explain their record price increase, but many smaller countries lack a functional construction supply chain of their own. So if you have to procure rebar, equipment and glass in a foreign currency that gets more expensive every year inflation hysteria kicks in easier.
I also wonder if our old friend – the hedonic price adjustment – is used for this index as building code (primarily energy efficiency) got a lot stricter in the EU and old buildings receive a ton of renovation as well. In DACH countries homes can only be sold unfurnished and even the ceiling light is removed for sale, but once someone moves in they often spend a ton of money to keep it perfectly manicured.