Standing Repo Facility spiked to $75 billion for a day, then fell back; ON RRPs spiked to $106 billion, then fell back.
By Wolf Richter for WOLF STREET.
The Fed’s weekly balance sheet released today was as of the close of business on Wednesday December 31, and it contained all the massive year-end liquidity shifts that will reverse within 1-3 days, and already reversed mostly today.
In addition, the Fed added $38 billion in short-term Treasury bills, of which $15 billion replaced MBS that came off the balance sheet in December; and $23 billion were “Reserve Management Purchases” (RMPs) with which the Fed reverted to its pre-2008 system of letting the balance sheet grow roughly in line with the economy (see my discussion of why RMPs are not QE).
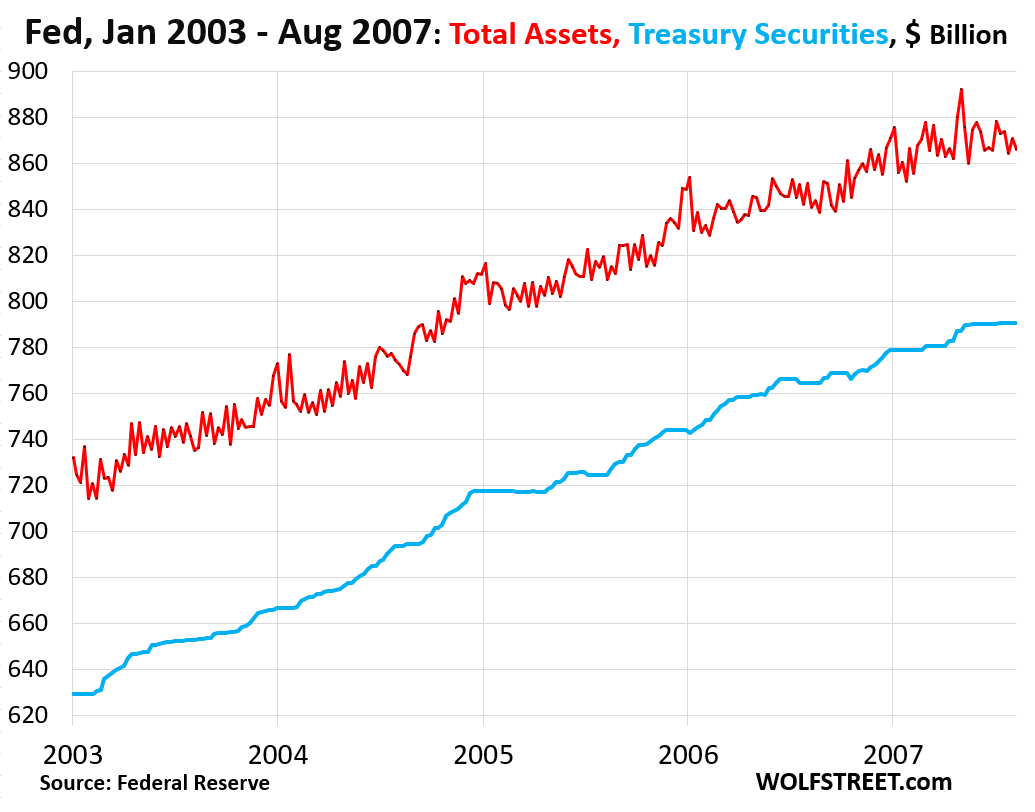
The pre-2008, pre-QE balance sheet: From January 2003 to August 2007, the Fed’s holdings of Treasury securities increased by 26% (blue line), and its total assets increased by 18% (red line), roughly with nominal GDP growth at the time. The jaggedness of the red line was a result of the Fed’s repo facility that the Fed used extensively at the time. This was not QE, but normal balance sheet management before Bernanke’s QE craziness came along. Growing the balance sheet in line with nominal economic growth is not QE.
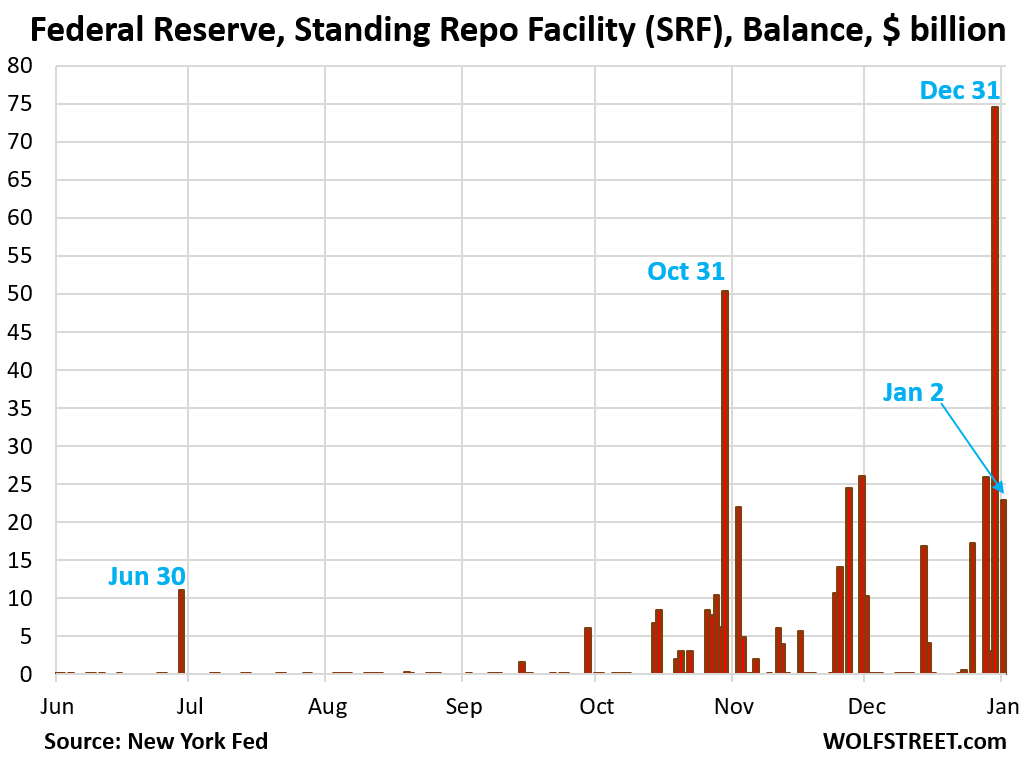
The Standing Repo Facility (SRF) saw an uptake of $75 billion on December 31, up from zero a few days earlier. The next business day, today January 2, the balance fell back to $23 billion. On Monday and Tuesday, much of the rest will be unwound.
The SRF balance is an asset on the Fed’s balance sheet, and that one-day $75 billion uptake on Wednesday increased the Fed’s total assets for one day by $75 billion. $52 billion of that have already come off today. And by next week’s balance sheet, the SRF will be close to zero again.
These are overnight repos that unwind the next business day, when the Fed gets its money back and the banks get their collateral back.
This is now the dynamic for certain periods of the year, such as year-end, quarter-end, month-end, and around tax days. It’s just that the last day of the year also happened to be Wednesday, the closing day of the Fed’s weekly balance sheet.
A similar thing happened at the end of November, but the last business day in November was a Friday, and by the following Wednesday at the close of business – the moment of the Fed’s balance sheet – nearly all of those repos had been unwound and the balance was near-zero. And a similar thing happened at the end of October, but by the first Wednesday in November, all of those repos had been unwound, and the balance was zero again on the Fed’s balance sheet.
The 40 or so approved counterparties at the SRF, all of them big broker-dealers and banks, can borrow overnight at the SRF via repurchase agreements (repos), the idea being that they lend to the repo market short-term when yields in the repo market rise above the rate at the SRF rate (3.75% since the December rate cut), and pocket the spread as profit.
On December 31, the average Secured Overnight Financing Rate (SOFR), which tracks a portion of the repo market, jumped to 3.87%, the highest since before the Fed’s December rate cut, with some repos going at rates as high as 4.0%, making it a profitable deal for banks to borrow $75 billion for two days at 3.75% at the SRF and lend at close to 4%.
The Fed has been exhorting its counterparties to use its new SRF, implemented in July 2021, to keep a lid on repo market rates, and they’re doing it.
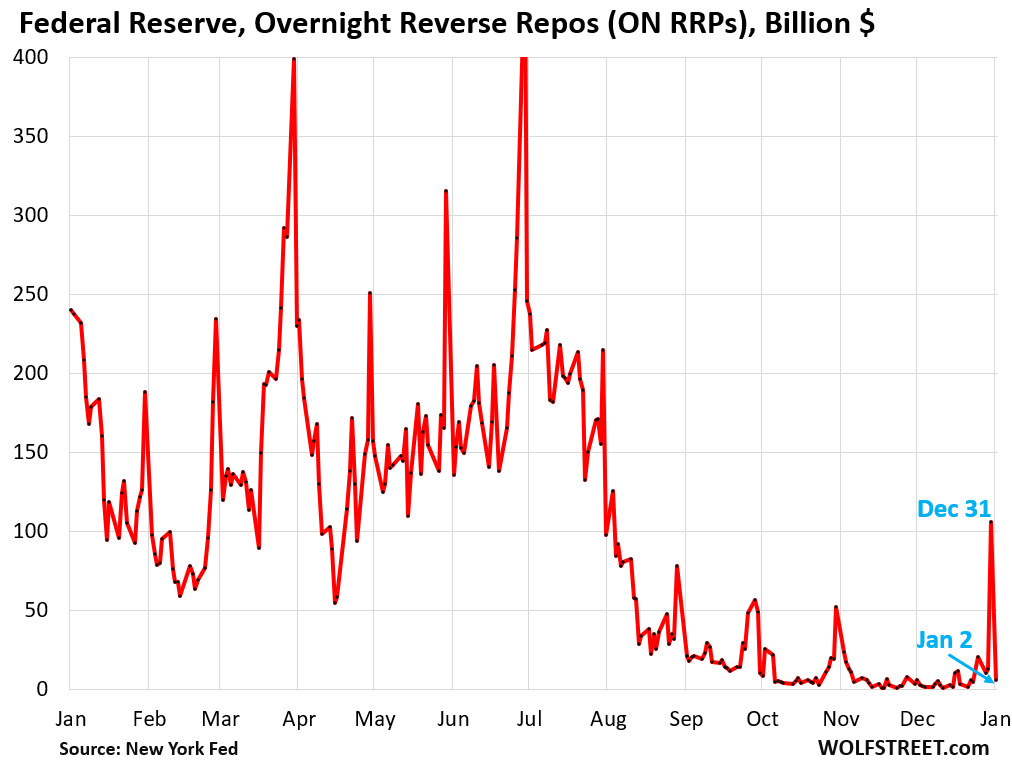
Overnight Reverse Repos (ON RRPs) are the opposite of the SRF. They’re a liability on the Fed’s balance sheet, not an asset. They represent funds that money markets put on deposit at the Fed, via overnight repos in the other direction, where the Fed is the borrower. On RRPs are a mechanism by which the Fed absorbs excess liquidity from the market. The Fed pays 3.5% interest for ON RRPs
ON RRP balances spiked to $106 billion on December 31, from near-zero a few days earlier. But today January 2, they fell back to just $6 billion. Another year-end one-day wonder.
The $75 billion spike in the SRF (borrow from the Fed) and the $106 billion spike in ON RRPs (lend to the Fed) embody massive year-end liquidity flows in different parts of the markets and in different directions that get balanced out at the Fed.
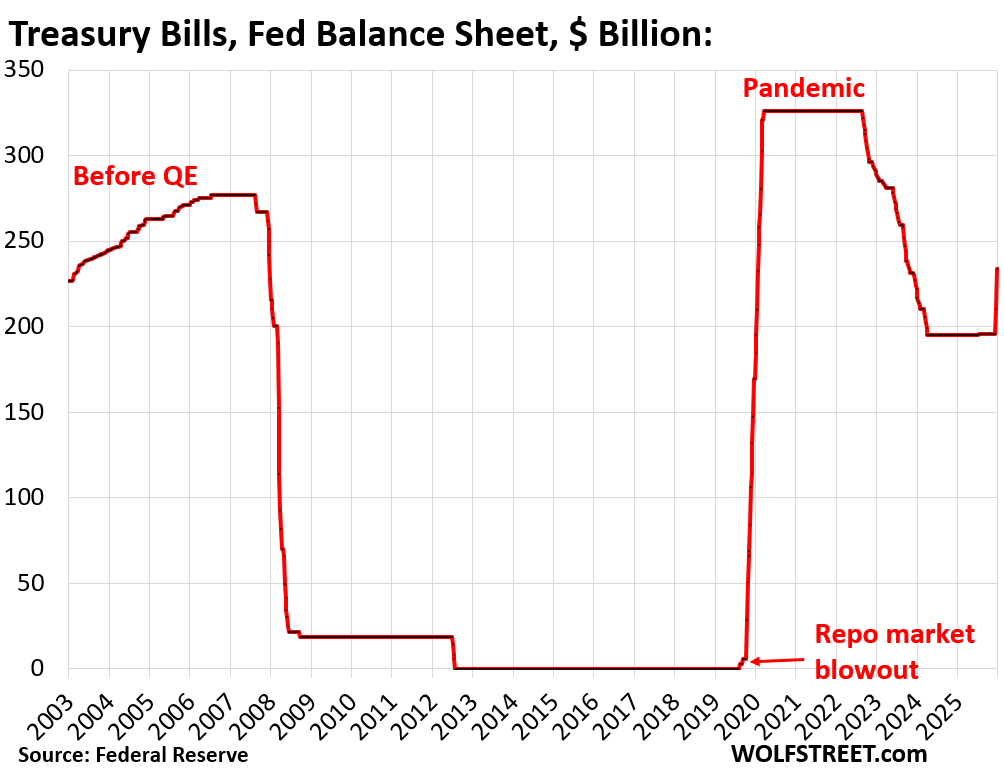
Treasury bills are at the core of the Fed’s new effort to change the composition of its balance sheet toward shorter-term securities. Until December, it held only a minuscule portion of its total assets in T-bills ($195 billion). Its assets are dominated by long-term MBS, Treasury notes (2-10 years) and Treasury bonds (20 and 30 years).
In December, the Fed started adding T-bills for two purposes:
- Replace the MBS that come off its balance sheet to reach its often-stated goal of shedding all of its MBS over time;
- “Reserve Management Purchases” to increase reserve balances (bank cash on deposit at the Fed) as needed for “ample” levels.
The Fed added $38 billion in T-bills in December, in terms of the transactions that settled by Wednesday December 31:
- $15 billion replaced MBS that came off the balance sheet in December and therefore did not increase its total assets.
- $23 billion for “Reserve Management Purchases” that increased its total assets.
The chart shows the Fed’s T-bill holdings going back to 2003. Before 2008, before QE, the Fed’s T-bill holdings grew substantially: Between January 2003 and mid-2006, T-bill holdings grew by 22% and accounted for about one-third of the Fed’s total assets.
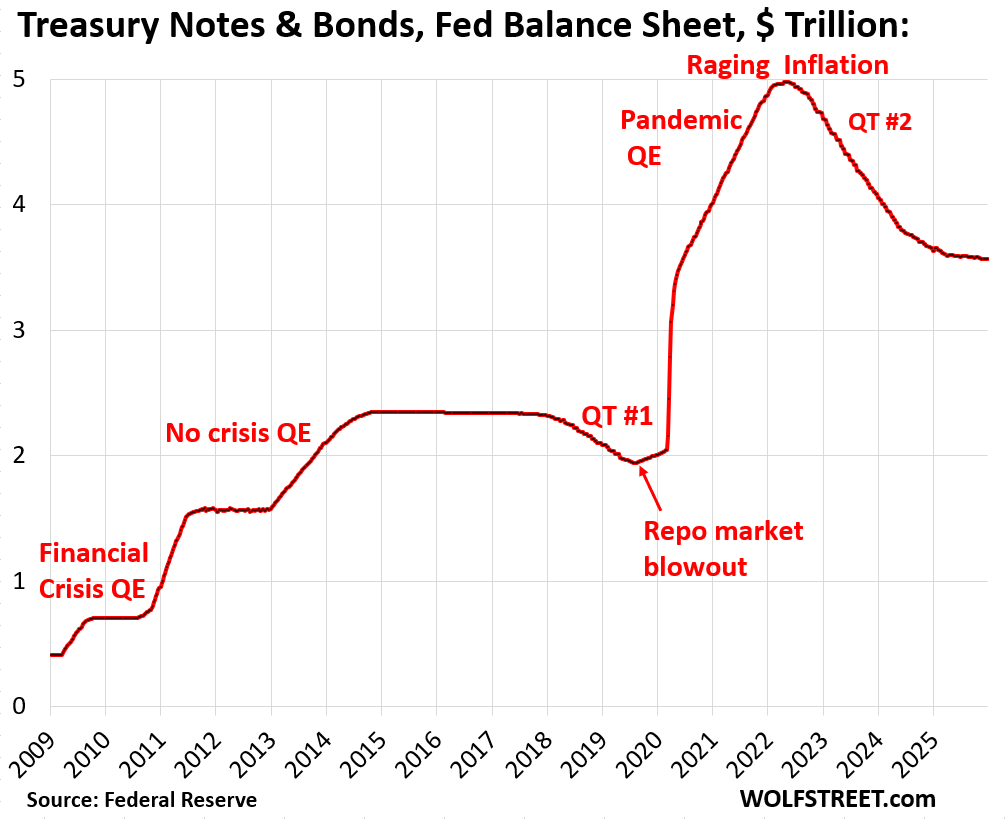
Treasury Notes and Bonds dipped by $3 billion in December to $3.57 trillion.
According to the Fed’s current plan, its holdings of Treasury notes (2-10 years) and bonds (20 and 30 years) are expected to remain roughly flat going forward.
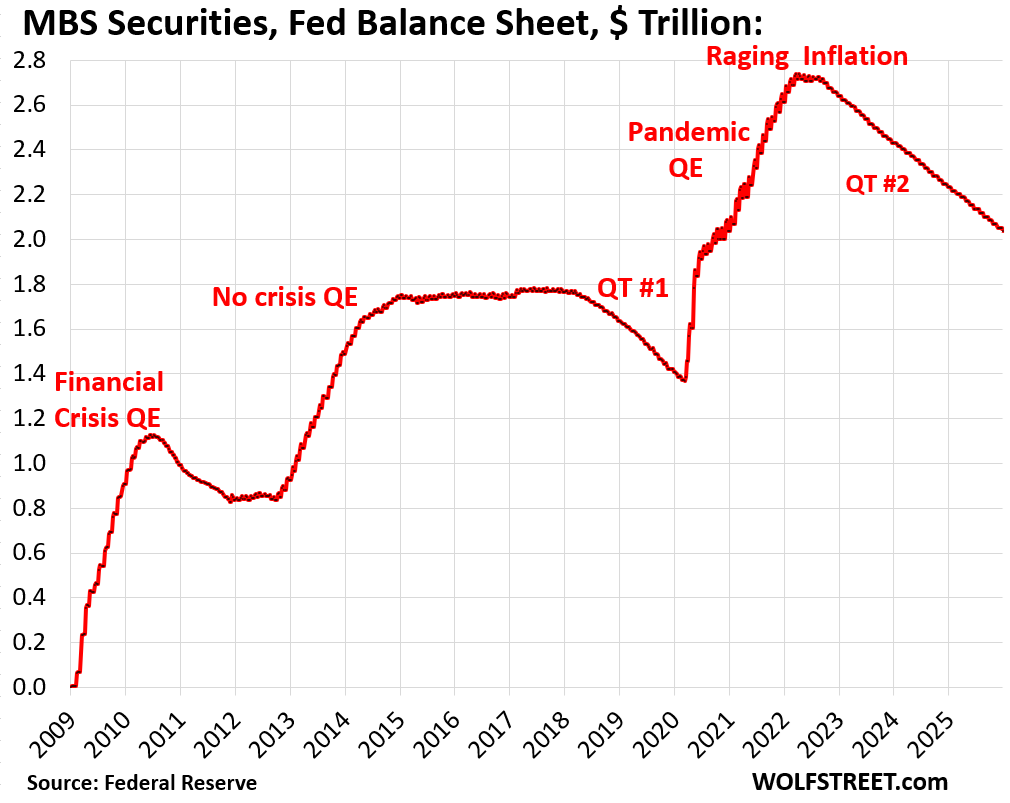
Mortgage-Backed Securities (MBS) fell by $15 billion in December, to $2.04 trillion.
According to the Fed’s new plan, MBS will continue to come off the balance sheet until they’re gone, and will be replaced along the way by T-bills.
MBS come off the balance sheet primarily via pass-through principal payments that holders receive when mortgages are paid off (mortgaged homes are sold, mortgages are refinanced) and as mortgage payments are made. But sales of existing homes and mortgage refis have plunged, and far fewer mortgages got paid off, and passthrough principal payments to the Fed have crawled along at $15-19 billion a month.
The Fed holds only “agency” MBS that are guaranteed by the government (issued by Fannie Mae, Freddie Mac, Ginnie Mae), where the taxpayer would eat the losses when borrowers default on mortgages.
The other bank liquidity facilities
- Central Bank Liquidity Swaps was mostly inactive with a near-zero balance.
- Discount Window balance ticked up by $1.8 billion to $9.7 billion. The Fed has been exhorting banks to use the Discount Window to manage their daily liquidity needs, including to lend to the repo market, but there is a stigma attached to the Discount Window, and banks are reluctant to use it.
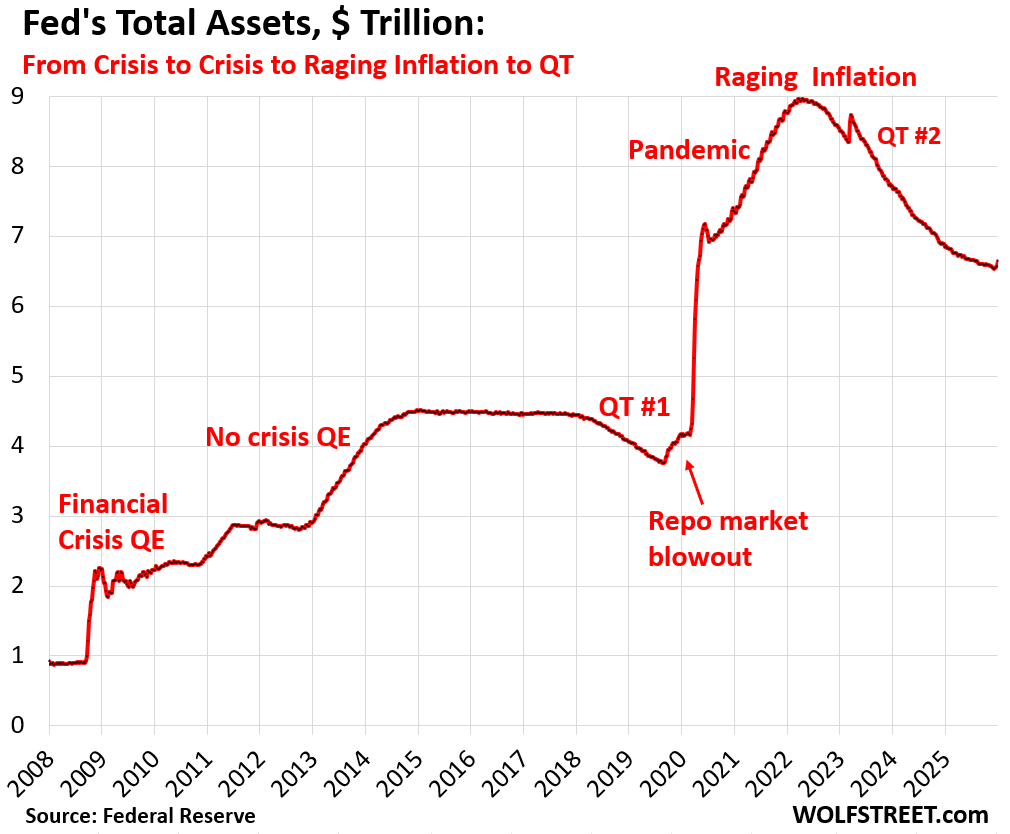
Total assets rose by $104 billion to $6.64 trillion, largely due to the one-day $75-billion spike at the SRF that already fell back again today; and secondarily due to the RMPs ($23 billion).
Enjoy reading WOLF STREET and want to support it? You can donate. I appreciate it immensely. Click on the mug to find out how:

![]()
The long end bonds sold off this week. Ten and 30 will be interesting next couple of weeks.
Wonder how the impact of the new T-Bill policy wrt Crpyto/stable coins and potential market volatility will play out.
Will there be yet another too big to fail moment ( Circle/Tether ) and another moral hazard issuance?
A good question….should the Fed intervene if there is a Crypto debacle?
IMO, absolutely not.
“The SRF balance is an asset on the Fed’s balance sheet,..”
What is the liability offset on the balance sheet? The money lent out?
ONRRP pay 3.5%…..so entities are sending money to the Fed to earn 3.5% when others are in the SOFR market paying over the SRF rate, correct? (over 4%?) Shouldnt there be a better arbitrage or mechanism arrangement?
Thanks.
The article explains that the entities that use the SRF and ON RRPs are different entities:
Only about 40 approved banks and broker-dealers can borrow at the SRF. Money market funds don’t have access to it.
ON RRPs are for money market funds mostly, where they deposit their extra cash. Money market funds don’t have access to the SRF. Money market funds are not part of the banking system.
Is it possible to extrapolate the t-bill purchase history vs. the bonds? Sure would be interesting to see the bond purchase history. I always wondered why the Treasury didn’t load up on bonds when FFR was near 0.
Seems to me, rates were much cheaper a few years back on bonds than we’re getting on t-bills ?
Perhaps the logic is to keep the Fed liquid and use this account to mop up economic messes vs. being used to finance our nations debt?
US Fiscal 2025 deficit was $1.8T. Projected FS 2026 is $1.7T. Tax receipts likely down (BBB), military spending up, but some savings from Obamacare cuts, FEMA cuts and tariffs will likely contribut $300B or so.
Team Trump wants to run the economy hot. This will likely add to inflation/pressures. The upper K economy can withstand but the lower K cannot. The lower K will put downward pressure on “hot” economy with continued small biz closures and reduced demand.
To run “hot”, government wants to continue to directly spur growth (like China) through federal seed money. Can’t do much of this without adding to deficit. Bessant plan is to monetize US gold (at whatever current price) and use that money for strategic reshoring and igniting the economy. US gold reserve value at current $4400/ounce is $1.1T. Recent moves in gold is likely driven by those that understand this intention. Silver has followed in part from this but more from buying up large stocks by industrial players to support increasing needs in AI, EV, solar, etc.
The Fed’s role in this plan is likely more of supporting around the edges a necessary; primarily as bond price stabilizer should that be needed. Don’t see short term rates coming down all that much, if at all from here. The big challenge will be containing the 10 year with the expected hot economy.
Housing will continue to struggle along. In big picture, while important to economy and social cohesion, it is not a strategic imperative like reshoring critical industries, AI and grid growth.
My thoughts on the matter.
I agree with you that it’s not QE, but it doesn’t matter what I think. What matters is that the media is hyping it as “restarted QE” in order to get people to keep hitting the buy button.
The idea of the modern stock market is to make everyone believe the Fed will do what it takes. As long as they believe that, the Fed doesn’t actually have to do anything.
The WSJ didn’t call it QE, nor did Bloomberg. The market-manipulators at CNBC called it QE; and it was clickbait market manipulation. CNBC will say no matter what to push up stock prices. That’s just how CNBC is. But CNBC et al. got slapped on the hand for it by the Fed itself, in the FOMC meeting minutes.
You can see in the long-term yields that it is not QE, and that the bond market KNOWS it’s not QE; The 10-year and 30-year Treasury yields have risen since RMP was announced at the December Fed meeting.
QE announcements, and even pre-announcements back during the 2008-2014 QE series and during the pandemic, caused long-term yields to drop sharply. That’s the purpose of QE and QE announcements.
The bond market understands this just fine, it understands that this isn’t QE – and so yields have risen since the announcement.
The bond market sees the current balance sheet management as what it is: a shift at the Fed from long-term securities (MBS, Treasury notes and bonds) to short-term securities (T-bills), so a very slow and careful reverse “operation twist,” which over time puts upward pressure on longer-term yields, the opposite of QE.
The Fed is doing this ” reverse operation twist” very slowly as to not cause panic in the long-term bond market that would cause long-term yields to spike. They explained that in the minutes. They’re going to do this shift very slowly, spread over years.
And the bond market sees that the Fed reverted to its pre-QE balance sheet management of letting the balance sheet grow roughly with nominal economic growth — as determined by currency in circulation, the government’s checking account at the Fed (TGA), and liquidity in the banking system that responds to the needs in the growing economy.
But CNBC doesn’t talk to the bond market; it talks to people glued to their TV screens and bloggers, and it loads them up with BS so that they then will spread its BS.
The yield on 10 year US Treasuries has moved up very nicely to 4.19% and will keep marching much higher.
Yield | 5:05 PM EST
4.195% quote price arrow up +0.042
Well, it’s official. 2025 ends with $38.517T in debt.
$9T in short-term treasuries roll over next year.
I’d love to have Wolf do look back next year and give us the biggest one-week Treasury purchases. I think he stated several weeks back that we had $600B+ in one week with almost $550B of that being rolled over.
I realize it’s money in / out that’s just being re-invested, but these are gargantuan one-week numbers.
When will the 10Y – 2Y spread move past 1%? Will it exceed 1.5% in 2026 or more?
The biggest week last year that I reported on was $724 billion in debt sales in August as the government was refilling the TGA (the other two weeks I reported on were $694 billion and $602 billion).
https://wolfstreet.com/2025/08/08/government-sold-724-billion-of-treasuries-this-week-debt-hits-37-0-trillion-getting-ready-for-the-feds-shift-to-t-bills/
I now do this report monthly for the week of the 10-year and 30-year auctions, which usually occur near mid-month. I’ll do the next one on Jan 16 or 17 (Fri/Sat), for that week, which will include a 10-year and a 30-year auction. So these reports fall on the same period every month, and over time, we can compare how debt issuance is going.
Rolling over T-bills will become a huge part of the auctions as the amount of T-bills outstanding grows. We may get to some $1-trillion weeks in a couple of years, with most of it being T-bill roll-overs. T-bill auctions are a well-oiled machine.