Update on a slightly less ugly situation.
By Wolf Richter for WOLF STREET.
[The only and possibly dubious benefit of having delayed the release of the Q3 National Accounts, including GDP, till December 23 is that we get to discuss the US fiscal mess in terms of tax receipts and GDP on Christmas Eve! And the situation looks a little less grim. Merry Christmas everyone!]
A crucial issue of the US government fiscal situation: What portion of tax receipts are eaten up by interest payments on the monstrous federal debt?
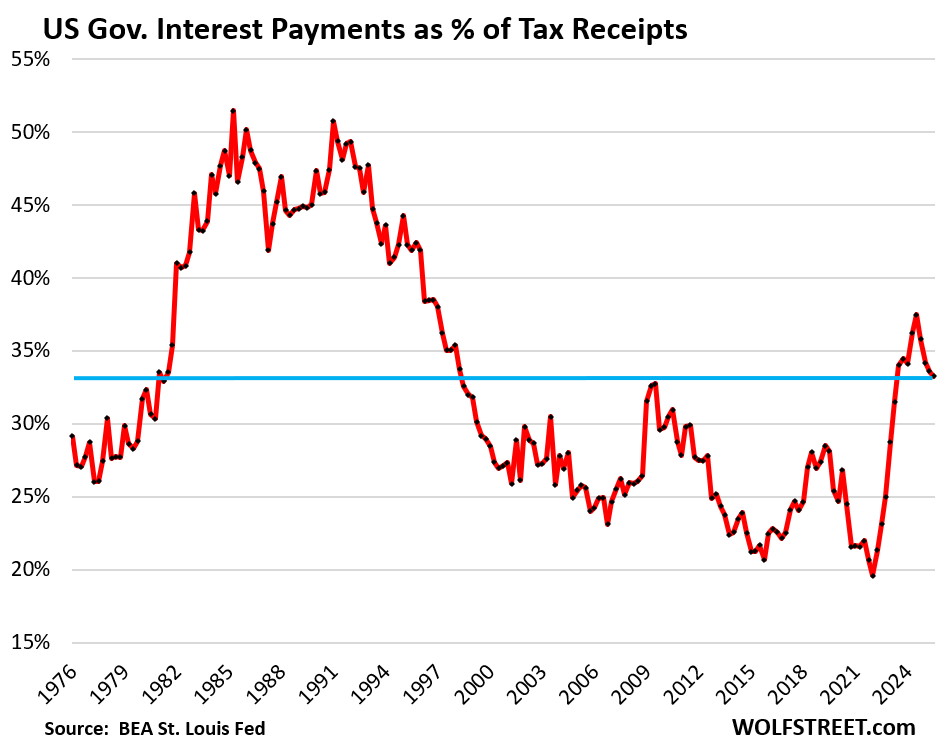
At the peak of the last fiscal crisis in the early 1980s, the ratio of interest-payments to tax receipts had exceeded a hair-raising 50%. It was a crisis because the 10-year Treasury yield was over 10% for six years in a row and went over 15% for a time; and the average 30-year fixed mortgage rate was over 10% for 12 years in a row and went over 18% for a time.
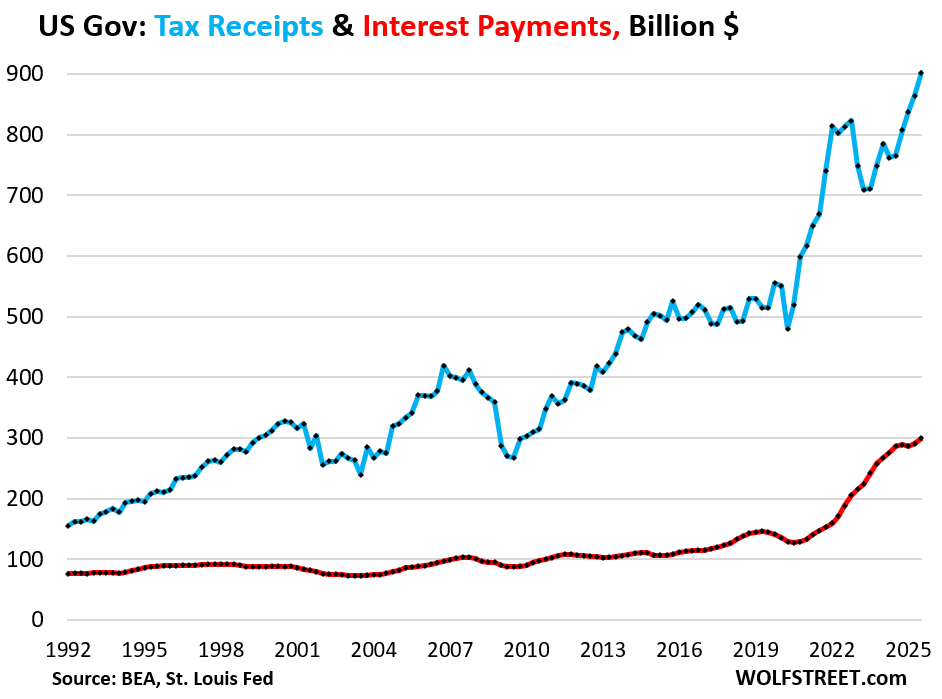
Tax receipts by the federal government jumped by $38 billion (+4.4%) in Q3 from Q2 and by $137 billion (+17.9%) year-over-year, to a record $902 billion. This includes $87 billion from net tariffs in Q3 (blue line in the chart below).
A growing economy generates more taxable income and higher tax receipts. Growing asset prices generate capital-gains taxes, but they’re very volatile. The year 2022 was lousy for stocks, and so tax receipts in Q1 and Q2 2023, when capital gains taxes for 2022 were paid, fell from the spike during the free-money pandemic years. And most of the tariff revenue is new, starting in Q2.
Interest payments by the federal government on its monstrous Treasury debt rose by $10 billion (+3.3%) in Q3 from Q2, to $300 billion (red in the chart below).
Interest payments don’t occur in a vacuum. They occur in the context of tax receipts – what’s there to pay for them.
This measure of tax receipts was released by the Bureau of Economic Analysis as part of its Q3 National Accounts data yesterday. It tracks the tax receipts that are available to pay for general budget expenditures, such as defense spending, interest payments, etc. Excluded are receipts that are not available to pay for general budget expenditures and are not included in the general budget, primarily Social Security and disability contributions that go into Trust Funds, out of which the benefits are then paid directly to the beneficiaries of the systems.
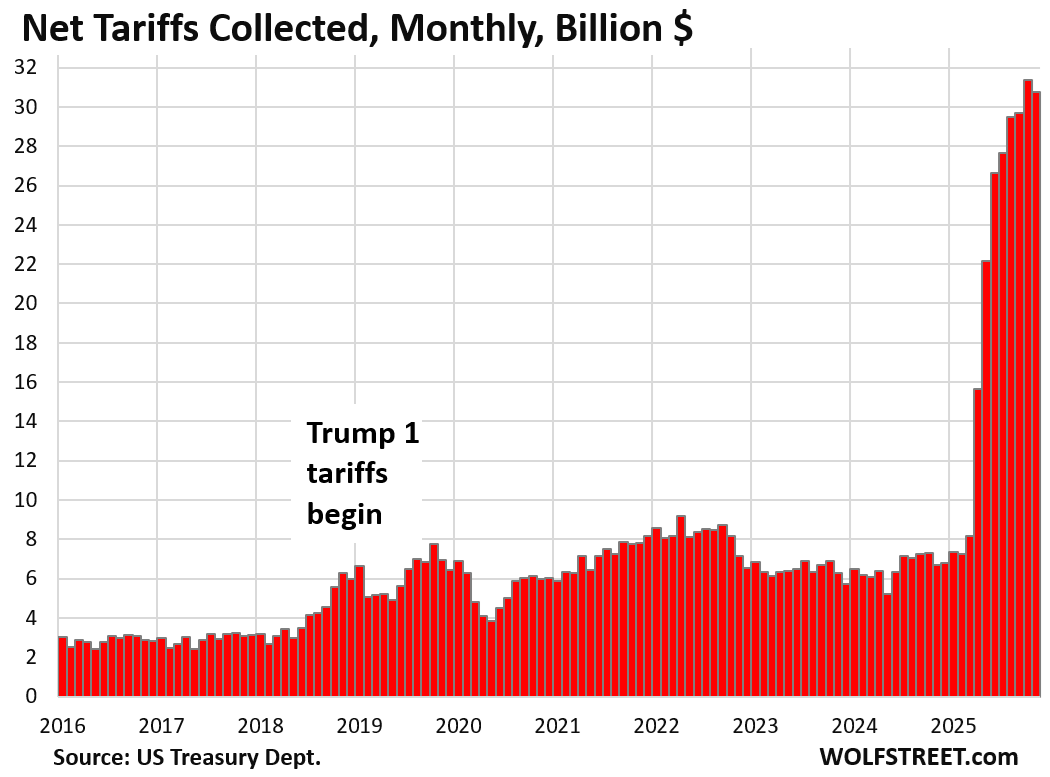
Tariffs are now a substantial contributor to tax revenues. In Q3, they added $87 billion to the tax receipts ($902 billion) that were available to pay for the interest expense and other general-budget expenses (chart through November, data via Monthly Treasury Statement):
Interest payments as a percent of tax receipts: Interest payments in Q3 ate up 33.2% of the tax receipts available to pay for them.
The ratio declined for the fourth consecutive quarter, driven down by the increase in tax receipts that outran the increase in interest payments.
The ratio was also helped by the average interest rate on the debt, which has remained roughly unchanged since mid-2024 – after surging in 2022 through early 2024 with the Fed’s rate hikes (Treasury bill rates) and QT (rates on long-term Treasury securities). More in a moment.
The recent high of the ratio occurred in Q3 2024, at 37.5%, which had been the worst ratio since 1996, when the ratio was already on the downtrend from the crisis times in the 1980s.
The magnitude and speed of this spike from the low point in Q1 2022 to Q3 2024 was unprecedented in modern US history:
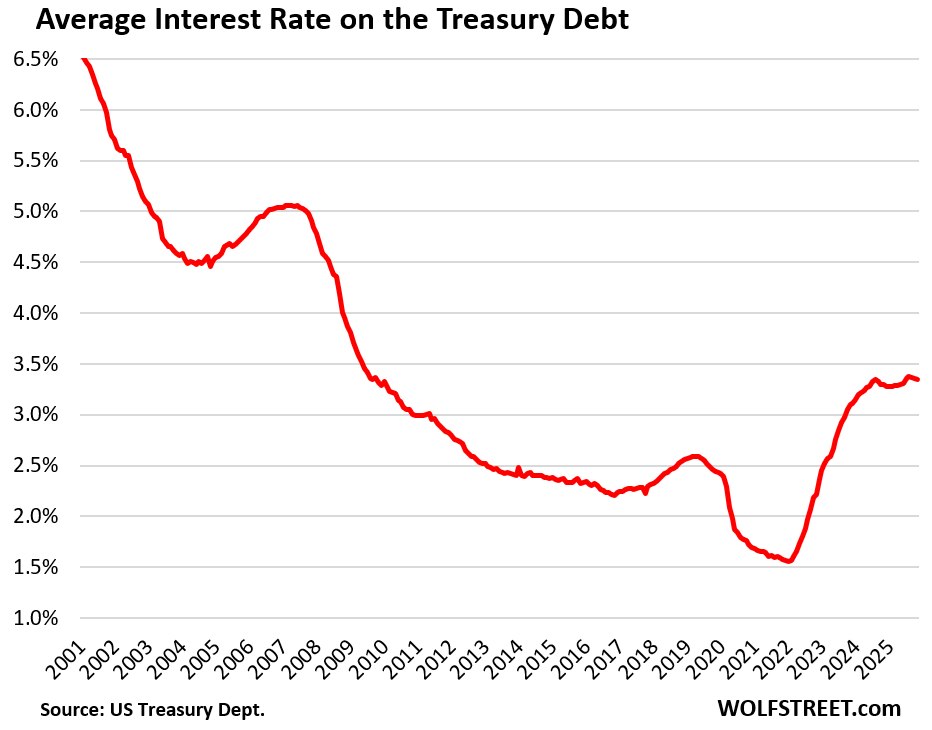
The average interest rate on the Treasury debt — now much higher than the historic low at the beginning of 2022 of 1.58% — has stabilized since mid-2024, and in November was 3.35%, same as in July, according to Treasury Department data.
New interest rates enter the interest expense when old Treasury securities mature and are replaced with new securities at the new interest rate, and when additional Treasury securities are issued to fund the deficits.
The $6.7 trillion in Treasury bills (terms between 1 month and 12 months) are constantly getting rolled over as they mature. T-bill interest rates, as sold at auction, track the Fed’s expected policy rates. As the Fed cut its policy rates, the interest rate that the government paid to sell new T-bills fell – lower interest costs for the government, and lower yields for investors.
But longer-term securities by definition are slow to cycle out of the debt, so changes in long-term interest rates filter only slowly into the debt as old maturing debt is replaced with new debt that comes with the new interest rates.
The interest rates at which the government can sell long-term Treasury securities have lurched up and down over the past three years, but within a range.
For example, over those three years, 10-year Treasury notes were sold at auction with yields from 3.3% and 4.6%. At the most recent 10-year note auction on December 9, the yield was 4.175%, in the middle of that range.
The ugly Debt-to-GDP ratio: Total Treasury debt at the end of Q3 was $37.6 trillion – though it’s now already $38.4 trillion. Nominal GDP in Q3 jumped to $31.1 trillion annual rate, as per the GDP data yesterday (WHOOSH, Went the Economy in Q3. The Fed Needs to Watch Out, Economy Is Running Hot).
So the debt-to-GDP ratio rose to 121.0% in Q3. But the ratio for Q1 and Q2 had been held down by the effects of the debt ceiling, which prevented the debt from ballooning. In Q3, after the debt ceiling was raised in early July, the debt made up for it and spiked.
But the debt-to-GDP ratio was down a hair from Q4 2024 (121.3%).
The Debt-to-GDP ratio = total debt (not adjusted for inflation) divided by nominal GDP (not adjusted for inflation). Inflation cancels out because the inflation factor affects both the numerator and the denominator equally.
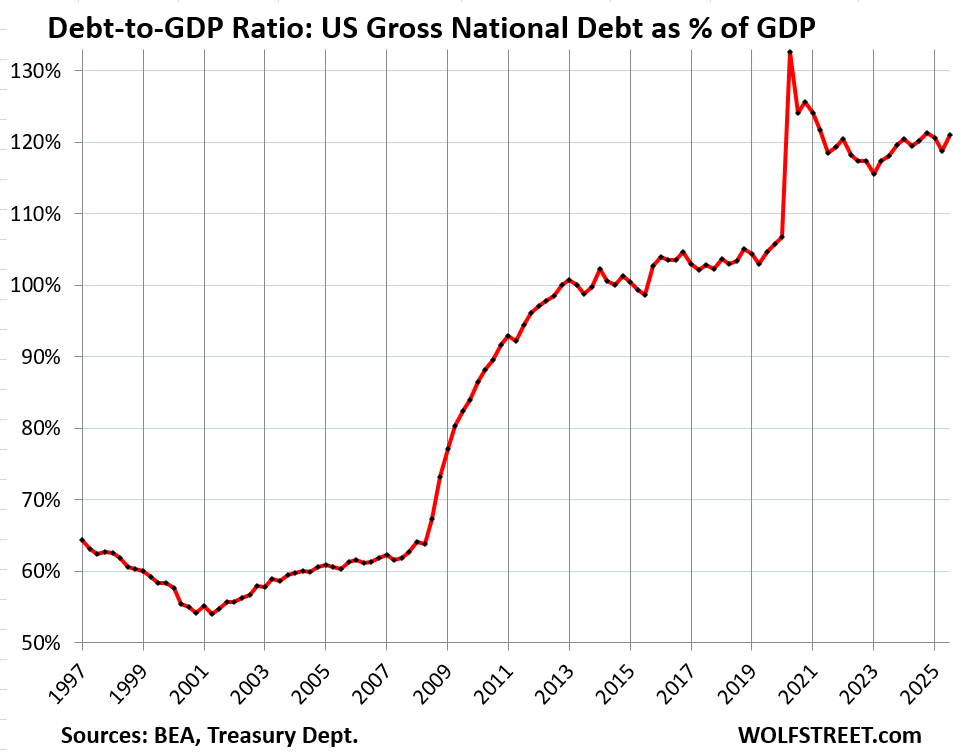
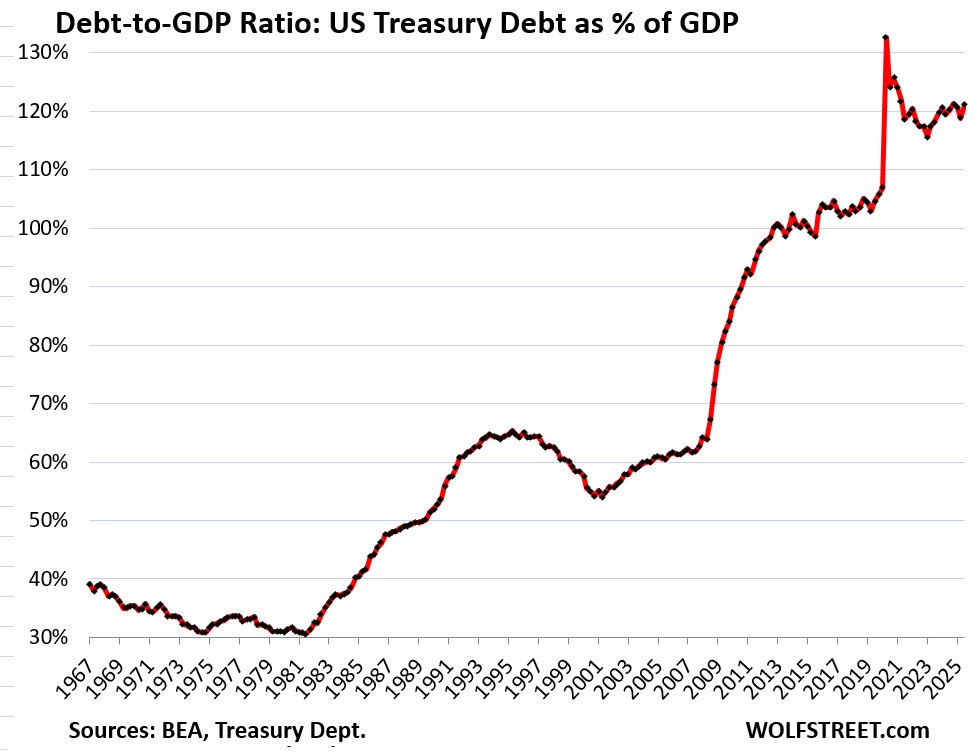
The long-term view is troubling. Each crisis causes the debt-to-GDP ratio to explode. But the recession in the early 2000s started a new trend: exploding the debt-to-GDP ratio without ever bringing it back down, not even a little bit, afterwards. It just kept rising until the next crisis, when it exploded again.
The lockdown during the pandemic was unique in that GDP collapsed and the debt exploded and the ratio when straight up in Q2 2020. As the economy reopened, and GDP bounced off, while the growth of the debt slowed somewhat to still very high growth rates, the ratio backed off but has remained in nosebleed territory.
Once upon a time, the debt-to-GDP ratio was below 40%:
A default on this debt is not in the cards. The US, by controlling its own currency, cannot default on debt issued in its own currency because it can always “print” itself out of trouble (Fed buys some of the debt).
But in an inflationary environment, printing money to service an out-of-control debt and deficit could cause inflation to spiral out of control, wreak havoc on the economy, and lead to years of wealth destruction and lower standards of living. Everyone knows this.
So the top option on the official wish list seems to be to trim the annual deficits a little – including through tariffs – to where economic growth (as per nominal GDP) and modest inflation (3%-5%) outrun the growth of the debt, which would gradually over the years whittle away at the problem. This wish list item assumes that no recession and no other crisis blow this scenario apart.
Enjoy reading WOLF STREET and want to support it? You can donate. I appreciate it immensely. Click on the mug to find out how:

![]()
Merry Christmas and Happy Holidays everyone!!!
Merry Christmas Wolf and thanks for the interesting charts as always. I promise I read the article too!
Marry Christmas from a warm Saipan!
Merry Christmas and a happy (and interesting) new year🎇
Same to you, Thanks, as always, for the great reporting.
Merry Christmas, Wolf! Cheers!!
What never seems to be a topic of discussion regarding tariffs is this; the American people, by electing politicians that determine policy, are ultimately responsible for the 38 plus trillion in debt. It is therefore entirely the responsibility of the American people to pay off that debt. If tariffs are one of those tools, then so be it. But not for that, the money needs to come from somewhere within the American pocketbooks. The worse possible solution is to kick the can to our children and their children.
The winning play is to renounce one’s U.S. citizenship and apply to become an Australian. Leave behind $330k in national debt per taxpayer and move to a place where the debt/GDP ratio is 43%.
One could do even better becoming Swiss or Danish!
I have a better idea. Since billionaires and corporations are the biggest welfare queens in the USA we tax them until they squeal like the pigs they are.
@Dave Sounds bold!
So, how much tax to make ’em squeal – 90%?
And which corporations?
Mom-and-pop LLCs and S-corps make up ~90% of US corporations—tax ’em all?
Speaking of chipping in: How many folks banging this drum voluntarily whip out the checkbook to send the IRS a nickel beyond what’s required – Nobody.
Yet those same hypocrites cry “tax the rich/corps” while supporting ACA subsidies that funnel billions to giant healthcare via marketplace handouts and risk adjustments.
Those swine are good to go, right?
Same old tired political narratives with zero rational foundation.
AmericaisforAmericans Said:
“American people… are ultimately responsible for the 38 plus trillion in debt… the responsibility of the people to pay off that debt.
The worse possible solution is to kick the can to our children and their children.“
The American Love of “logic,” -al fallacies.
Is it the can that was kicked to me? Or my sole responsibility?
The USD was de-pegged, and debt-financing was approved: both in the early 1970s.
I can equally say that anyone who was: under 18, or simply NOT in CONgress at the time of these events is not “solely responsible.”
The REALITY is that there’s a financially competitive global economy. The cold war was an arms race, that gave way to a race for financial dominance (through control of resources, amount of production and ultimately consumption).
It’s communism when it comes to paying for the party, but totalitarianism when the order is placed.
Merry Christmas!
Aye Merry Christmas and Happy Holidays to you and all the good posters here lurking in the comments section!
right back at ya wolf
My problem with “inflating the debt away” is the inflation also erodes the wealth of the very tax base that politicians expect to pay off the debt. Tariffs may or may not be a help as they are paid by the citizens of the importing nation thus, they also erode the wealth of the tax base expected to pay the debt. Further tariffs add to cost of foreign imports for inputs into manufacturing particularly hitting the businesses that manufacture products for export.
You mention this in the next to last paragraph also emphasizing lower living standards. By inflating ourselves into a lower standard of living, the location of lower standards is market driven and not of the choosing of those affected. If we were to spend less than total receipts, the location of the pain could be targeted to inflict the least damaging pain, and the wealth erosion would not be a problem. Afterall, it is wealth erosion or stated another way, erosion of the dollar’s purchasing power, that has been a major contributor to our debt problem as it has exacerbated the overspending problem.
Merry Christmas and Happy New Year
85% D:GDP was repeatedly proclaimed as the Maximum Mis-Management that a nat’l gov’t could Survive !!!!! Several bad gov’t$ repeatedly proved that right, until Baby George stuck it to USA. Then experts just forgot what they had preached for decades !!!!!! Debt declined under Nixon, Carter & Clinton. Debt Exploded during Reagan recession, Baby George’s housing Depression & Trump-Covid-Biden-Trump Tariff Tragedy !!!!
Don’t even think a crisis is needed, just the continued rollout of AI. I’m not anti-AI, just anti not doing anything at the government level to address the implications. That said, there is no slowing it down, partly because it is the current economic catalyst and also that just not how we roll.
What could gov’t do about AI ?
You know, the basic stuff of governments. Understand issues/ opportunities, draft legislation / regulations, pass it into law and so on. They are theoretically elected to represent best interests of constituents. If that isn’t the case then we have bigger problems!
It certainly isn’t the case and has not been for decades.
They are attempting to monopolize it, with little success, with initiatives like restricting critical hardware such as graphics chips to China.
However I feel that all this is really doing is to push China into spinning up indigenous production of said hardware.
Trump recently cleared the way for China to receive Nvidia’s latest chips.
Ringo, if China is buying Nvidia jobs, it’s to rip them off.
China is not stupid, and they don’t respect intellectual property rights. There’s no way they’re going to pay Nvidia’s 70% profit margin long term.
The us has already used the AI 1.0 chips to design the AI 2.0 chips.
Now we sell all the useless AI 1.0 chips.
Big brain thinking!
🧐 /s
Prepare for 30-40% job losses: Not spend fr’kn trillions of dollars to blow up the world with obsolete equipment. Invest in infrastructure. A wealth tax and repatriation of all tax haven monies and assets.
I ask why you think a person who legally accumulated wealth should be forced distribute it to others?
This for ”A Guy”:::
Maybe because what is ”legal” is a direct and very clear product of those with enough lack of morals to pay off those who make the laws AND enforce them so that they with insufficient morals can screw everyone else, etc., ad infinitum???
Nothing new anywhere, as it has been that way for as long as humans have had ”laws” …
Should be VERY Very clear that the folx who make the laws are the very well paid puppets of the rich and getting richer.
My ancestors and I have worked for the rich and ruthless for the last couple generations, and I was very close with more than a couple of the families that were known as ”old money.”
Only real delta in USA is that anyone with enough lack of morals can join the rich and richer; as opposed to older societies where, other than extreme valor in battle, or extreme beauty, ya had to be born into the rich and richer…
MERRY CHRISTMAS for all on Wolf’s Wonder!
AGuy, at least since 2009, the morality of much wealth accumulation is suspect.
And they still can’t send me a robot to fix my flat tire.
Cmon Robots! (GOB voice)
Wealth taxes are unconstitutional.
Property taxes are unconstitutional? They’re a form of wealth taxes.
A Guy:
Let’s look at US History:
1929: Stock Market Crash
1933: Gold Seizure at $20.67/oz.
1934: Government Re-prices Gold to $35/oz.
The “Why” is a longer explanation than the “what.” Today’s “how” looks different (for now). We’ll see what happens when they perceive a “crisis.”
Start with “support intellectual property law” – which would immediately crush large language models (like ChatGPT) that require access to proprietary content in order to exist. They are surfing the Internet, stealing all the content, “rebundling it” as AI, and making money off their theft. Ask any one of these “AI” systems who owns the content they are basing their systems on… and it isn’t the AI company.
AI is the crisis. Certain unnamed governments ;-) will spend exponentially more debt to try and “win” the Manhattan Project part deux race; to their folly.
Break out the popcorn bowl – gonna get interesting.
Frohe Weihnachten von Leipzig Wolf und alle und einen guten Rutsch!
Mr Wolf. Please have a look at a Value Added Tax, and how it would reduce our government deficit. Do this, please, before it is to late. Thank You and Merry Xmas
I HATE VATs. I lived in Belgium for a few years, had a small company there, and their VAT was something like 21%. And it’s added at every stage of the supply chain as that stage “adds value” (figured on the difference between costs and sales prices…). For companies, it is administratively cumbersome, and they have to do VAT declarations (similar to tax returns), and there are VAT audits, and VAT inspectors crawl all over your stuff because companies play games with the VAT calculations…. And it’s largely hidden from consumers. They just pay higher prices. No Thanks.
“I hate VATs”. The way I see it, tariffs are just a sneaky VAT inserted into the production / consumption process at just a different point in time. I know you’ll disagree with my statement, but I stand by it. They both have the sam3 reault.
Laughing Larry
After the White House claimed the same goofball nonsense that you just claimed, that the EU’s VATs were just like tariffs, the EU came out swinging and bashed that nonsense down loud and clear, pointing out how they’re different in fundamental ways: VATs make no difference between imports and locally produced goods, and are passed on by law automatically and in full to consumers; while tariffs tax only the importers on their imports, not local producers, and whether or not importers can pass on the tax is up to their customers. And if customers don’t bite because they can buy the same product for less from someone else, well, then, the importer eats the tariffs… and largely, that is what has happened. And for once, the EU was totally right. Tariffs are a corporate tax, just like corporate income tax. VATs are 100% and by law a consumer-paid tax.
Not to mention, after living on the German economy for several years in the late 80s, what you got was a 20% VAT and, a high income tax as well ! German authorities drive around checking for unlicensed TV antennas at the time to make certain you were paying your TV tax as well. Churches didn’t pass the plate in the same manner because when you signed in to the Finanzamt upon arrival and opening a business you put down your church affiliation and were taxed on that . 20% VAT on top of up to 55% income tax. Oil change in your auto was $350 marks ( $9 a quart for oil in 1988 ! ) So, forgive me for not going all-in for a VAT.
Merry Christmas –
First, not sure how this thread dove off topic so fast but here we go.
The AI comments are a little off.
The government isn’t doing “nothing” and AI isn’t running totally wild.
Congress and agencies are already treating AI like infrastructure — chips, power, data centers, exports — especially locking down top-end access to China.
It’s slow and messy, but that’s not the same as asleep or selling out. The “AI kills 30% of jobs” line is way overcooked — it kills tasks, shifts roles, boosts productivity, and creates new work, like every major tech wave before it.
Like it or hate it, AI isn’t a trend in the wind — it’s the future, and it’s already here.
Nobody knows what the impact of AI will be. Nobody knows how many jobs will be replaced or how many new jobs will be created that are not also performed by AI.
At this point billions in Capital are flowing into projects but there seems to be little visibility into what or if revenues will flow from these projects.
It could turn out that AI will represent a massive misallocation of capital and it will be that misallocation itself that will create the problems.
If AI delivers on what is promised, and more importantly, if Robotics deliver what Tesla and others promise the great challenge will be how to transition society to a model where income is separated from work. If AI delivers, it’s main impact will be to make communism possible, perhaps even inevitable.
Of course, “IF AI delivers”, is a really big “IF” and the “age of abundance” end state represents a happy vision but the transition to that end state may be where the disasters lurk especially given the nature of our political system.
danf51
Inevitable Communism – Huh?
Such doom-and-gloom nonsense—Let’s keep it real.
AI is already delivering all around you: it’s making people more productive, creating more jobs than it eliminates, and driving solid growth.
Companies deep into AI are getting real revenue boosts, cutting costs, and seeing wages rise faster.
The big investments aren’t reckless—they’re going where the payoffs are clear. This is fuel for the next economic surge.
If AI and robots bring real abundance, we’ll have more free time and better lives—maybe with things like universal basic income—while markets and innovation keep rolling.
AI actually expands choices: cheaper goods and energy, big advances in healthcare (faster diagnoses, precision surgery, new drugs quicker, less doctor burnout from paperwork), all driven by competition and ideas.
Tune out the Terminator Series and don’t sit so close to the TV you’ll go blind.
You can see it’s no light at the end of that tunnel. A.I. is still yet to turn a profit overall. And those datacenters that house it compete directly with human necessities: Water & Electricity. And China sees that America is betting everything on A.I. but they can do it better as they can build a 1.4gigawatt facility in 12-months because the CCP said so,, no need for permits and county commission approvals that add years to the build here in the USA. Kling A.I., for example, is just as good as Google Veo 3 but it’s much cheaper. China is gutting the profitability of A.I.
@AverageCommenter
A little light on the AI doom:
The U.S. has been building and running data centers for decades – 10× more than any other country, with thousands more in the pipeline, and they don’t “steal” water or power—they’re contracted, priced, and often fund grid upgrades.
To Democrats, it’s SUV déjà vu: SUVs didn’t end civilization, and neither will data centers.
AI doesn’t need every model to be instantly profitable—Real money is already being made selling: power, chips, networking, software, cloud. That alone will mint millionaires and billionaires long before the deepest AI breakthroughs hit—and they’re coming in HOT. The $20 billion Groq purchase by NVIDIA – HUGE.
The light in the tunnel is already blindingly bright.
And China? Fast. Cheap. Weak. and Second.
Thankfully, we have a strong POTUS who doesn’t apologize for U.S. strength and knows how to leverage it.
Merry Christmas Wolf!
What could gov’t do ?
How do the CPI-driven principal adjustments to TIPS and I-Bonds enter into the computation of interest paid? Are the daily (for TIPS) or monthly (for I-Bonds) principal adjustments treated as (non-cash) interest payments, or are the cash payments of those principal adjustments only treated as payments of interest at the maturity (or redemption) dates?
Government accounting is cash based. So I would think that the inflation protection that is added to the principal is accounted for as an interest expense in the budget when it is paid at maturity of the TIPS.
Since TIPS have been around for many years, there are several issues that mature each year, and when they mature, that inflation protection would be added to the interest expense.
TIPS balances are small, now $2.1 trillion, about 5.5% of the total debt.
Same with I-bonds. But they don’t mature. They’re redeemed by the holder (sold back to the government) when the holder wants to. After 30 years they stop accruing interest. But the holder has to actually redeem them to get their money back. It’s not automatic.
I-bonds and EE savings bonds are minuscule, about $150 billion in total, so they don’t matter at all.
Merry christmas and happy holidays to everyone.
May our investments all turn green.
Shorts mature in time.
(Engels will get sober soon)
The girl will talk to us in tomorrow…
I wish wolfstreet will become the main street…
Thanks for the wonderful 2025
Merry Christmas Wolf!
You probably don’t cover this topic but I am interested to find out impact of BRICS accumulating massive amounts of gold reserves to reduce dependency on dollar. It will be great if you weigh in your expertise and what BRICs is trying to accomplish and what if they will be successful.
Look at 20-year charts of the BRICS currencies. They (except for the RMB, the C) have plunged or collapsed against the hated USD.
Thus the emphasis on accumulating gold instead of fiat credibility?
It could work, eventually.
Merry Christmas Wolf
Thank you very much for your remarkable insights this year. Hope you get some downtime.
Take care and best regards.
For all the publicity and whining, tariffs according to Mr. Wolf are only about 10% of revenue. Inflation of 3% on 38 trillion of debt brings in 95 billion a month or about 10% as well. Boosting tariffs to 20% and squeezing in another 50 basis points of inflation would give about 33% of the budget. From this it looks like the budget deficits are overrated.
WTF? “Boosting tariffs to 20% and squeezing in another 50 basis points of inflation would give about 33% of the budget.” That’s a solution? oh my god.
In fairness to the original idea, Americans buy stupid amounts of imports at stupid low prices. The vast majority of this stuff becomes toxic landfill waste within a year or two. So why not tax this wasteful behavior?
Raising inflation would increase exports, boosting GDP and lowering debt/GDP. However it only works if interest rates stay below the rate of inflation, and the market gets to decide that.
The fairest idea would be a $1/gallon gasoline/diesel tax. It would reduce the number of gas guzzlers on the road, clean the air, and remove distortion from the U.S. auto market. It’s politically impossible though.
Chris
And you think raising taxes is a solution to spending problems why?
Thank you Wolf for a great year of reporting. All looked pretty good, higher GDP,higher tax receipts, and then….121% ratio!! Wow..the US has been on a spending spree for years, maybe decades. Without budgetary discipline we are in for a world of hurt. We the folks need to wake up.Having just retired, this gives me the jitters. Anyway, everyone have a Merry Christmas!
If you look at realistically our debt to gdp and interest payments were far higher in 1980 than now. There is hope.
Interest/Taxes has improved but Debt/GDP got worse.
80’s level interest rates would crush the U.S.
Merry Christmas Wolf and all, Feliz Navidad!
> and modest inflation (3%-5%) outrun the growth of the debt
So how’s this going to work in practice for the existing debt that will be rotated? If they let inflation run at 5%, what’s that going to do to the yield of newly issued long-duration bonds? Should be considerably higher yield if the bond market is functional.
They can switch to issuing mostly short duration treasuries. What are those going to be at when inflation is 5%? What happens if inflation blows out for a period to 8%+ because inflation is more volatile at higher % levels. Sitting in mostly short duration will add significant volatility to interest payments since those rotate quickly.
Don’t see how higher inflation helps reduce interest payment costs mid-term, especially with the existing debt level and the still relatively low average interest rate of 3.5%.
Real GDP and higher income growth per year sure helps. Inflation strategy doesn’t add up unless the plan is to control the full curve and screw over bond holders. Or fudge inflation numbers indefinitely.
Higher inflation means higher nominal GDP (nominal GDP growth in Q3 was 8.1%!) and higher tax receipts… see first chart, blue line. Tax receipts is what matters!
Tax receipts is what matters!
So does accountability: my new year’s wish is free press journalism and all the Trumper suckups to get their comeups
Hey Ho let the missiles go, We’ll be drinking beer.
Don’t get your knickers up, It’s that time of year.
Have a holly jolly Christmas, Christmas time is here.
Don’t get bugged when you all get mugged by the taxman, next year!
Santa now uses AI to review social media and comments for his naughty or nice list. Looks like another lump of coal for me. Merry Christmas.
Running higher inflation (say 5%) will crush the bottom 3/4’s of our K-shaped economy. That segment is already struggling.
And continuing to cut the deficit (around the edges) only slows the economy. I’m in Asheville NC and the “expected” FEMA funds for long term recovery from Helene aren’t being released as in recent prior storms.
Personally, I agree with his approach as the Federal Government has no business (and certainly not the funds) to bring disaster areas up to better than before. That’s the local and state’s responsibility. This approach started after Katrina when Congress passed sweeping increases in FEMA support to storm damage and well after the first year (e.g., there are $1M projects on FEMAs books for sand replenishment on North Carolina beaches from a storm in 2017!
Bottom line for me is high doubt that they can pull this off. Higher inflation will devastate lower income economy. Trimming budget will do same. I expect a dollar faith crisis in the next 5 year, probably sooner.
Besides a lot of thoughtful analysis by many smart people out there, gold pricing (not silver) is the most obvious reflection of the crisis coming.
Merry Christmas.
Higher inflation would entail higher wage increases that overall stay ahead of inflation.
During the sudden inflation shock in 2021 through mid-2022, wages didn’t increase as quickly and fell behind, but then wages increased faster than inflation and eventually caught back up and are now ahead. Wages don’t make the sudden moves of an inflation shock, but they do rise with inflation or faster if the inflation acceleration is not sudden, but over time. If wages keep up or stay ahead of inflation, 3-5% inflation rates would entail the same or higher wage increases.
The problem is that people get wage increases and it makes them feel good, and then they buy something and find out that it was just inflation. And it pisses everyone off.
“Higher inflation would entail higher wage increases that overall stay ahead of inflation.“
I love the certainty that you assert with this. Merry Christmas wolf.
“would” does not signify “certainty.” It shows that’s typically how it “would” go (not “will” go).
Not sure how Wolf turned off replies for just his response to you, but I had the exact same thoughts you did when reading his statement. And his response to you feels like a misunderstanding of English, this is truly bizarre.
Please explain Wolf, how is saying “xyz would happen” not a declarative if-then statement? Maybe you’re interchanging ‘would’ and ‘should’? Or maybe you missed some conditional statements after simply declaring wages would overall stay ahead of inflation? You then give a single most recent example as evidence of your assertion, but I have never seen economic research demonstrating this mechanism you conveyed as fact. If there are such studies, please direct me towards them as they seem pivotal.
1. Replies to my comment were not turned off. Comments can nest up to four deep, and that’s it (to avoid very narrow column on smartphones). If you want to reply to a comment that is already at the fourth nesting level, you click on the nearest reply button above it, which is what you did, and that’s how it worked. Don’t make up dumb conspiracy theories to explain what you don’t know.
2. Mr. House said CERTAINTY. My statement was in response to his CERTAINTY. Don’t twist that into BS.
3. Look at inflation-adjusted “real” (inflation adjusted) wages, for example the measures linked below. The spike in 2020 and 2021 was from the free money the government handed out. You will see that over the past three decades, inflation-adjusted wages were either flat or kept growing, meaning that wages grew as fast or faster than inflation. That’s how it normally is, but not always. In 2023, 2024, and 2025 wages outgrew inflation.
https://fred.stlouisfed.org/series/LES1252881600Q
And here is “real” (inflation-adjusted) disposable income per capita, which is a broader measure than just wages (2020 and 2021 were distorted by free government money handed to Americans):
https://fred.stlouisfed.org/series/A229RX0Q048SBEA
The large decline in U.S. government interest payments as a share of tax receipts occurred between 1990 and 2000. How much of that decline can be attributed to fiscal restraint (austerity), and how much to falling interest rates on government debt? I ask because the chart showing average interest rates on debt only goes back to 2001.
SUCCESSFUL austerity is what leads to falling interest rates on government debt. The 1990s were characterized by a Peace Dividend and a divided government that kept the political instinct to spend such “dividends” in check.
Wars are expensive… especially LONG wars. The 60s and 70s saw the Vietnam War… the 80s was the period of the Reagan defense buildup to win the Cold War… the 90s were relatively quiet (hence the improvement in the nation’s finances)… but the 9/11 attacks kicked off 20 years of “forever wars” in the Middle East that stretched the national budgets all out of shape.
We shall see if America can avoid any long wars in the coming years… if we can then we may can get the National Debt back under control simply through GDP growth. If not… then not.
What we saw was the economy out growing a much smaller debt.
That was a lot easier to pull off when the starting point was 40% debt/GDP than what it is now at 125%. It’s like how having one month of wages in credit card debt is a much easier problem than having 16 months. Especially if your lenders will cut your interest rate.
Kind of funny how the interest payments and tax receipts since the pandemic have doubled….kind of like almost everything else.
12-month totals from Q4 2024 to Q3 2025 compared to the prepandemic 12-month total of 2019:
Interest payments: +101%
Tax receipts: +61%.
Tax increase of 61% is a function of five years of economic growth: population growth (+14 million people), job growth (+8 million), inflation (+29%), corporate profit growth, etc. Plus now the new tariffs.
So staying on topic and to help anyone who is confused – what this article verifies: Trump’s plan is working — exactly as designed.
Nominal GDP is growing, inflation is moderate, real activity is steady, and revenues are outpacing deficits — with tariffs as a meaningful source of that revenue.
Interest payments are stable, debt-to-GDP isn’t exploding, and, as Wolf reminds us, “tax receipts is what matters.”
Growth is doing the heavy lifting, policy is working, and the data prove it.
You can “what-if” anything you want but today the data is all about WINNING!
Merry Christmas
Oh, debt/GDP is still growing I assure you. We’ll be well over 140% by the end of this administration.
The question is when do interest rates blow out? Do you know the administration’s opinion on this question?
@Chris B –
Debt/GDP has been climbing for 40 years, — but strong growth and smart policy can reverse it and that’s well underway for 2026- that is the real BLOW OUT to watch.
The big stuff from the Trump Administration—massive capex, tax-cut extensions, deregulation, and tariff revenue—is only starting to hit. That’s the real fuel for next year. Forecasts already point to stronger U.S. growth while inflation cools.
The economy just printed 4.3% growth, markets are at all-time highs, the Fed’s cutting rates, housing is getting cheaper, gas is back under $3, and holiday spending crushed it. Consumers are still spending and feeling good regardless of how the so called media likes to tell it.
Interest rates aren’t blowing out; they’re trending lower and Treasury demand is still rock-solid. Growth + revenue + lower rates = debt burden gets more manageable, not less.
2026 looks like re-acceleration, not crisis.
Fully half of that growth in 2025 was AI. If that bubble was to pop…
They had their chance to cut the budget and make real headway on the debt/GDP with DOGE and failed miserably. When they chose to increase the defense budget I knew all chances of that were gone.
During the 1980s interest rates were very high and somehow nothing fell apart. Today interest rates are low but national debt is high. Somehow everything works out in the end. Americans are actually lucky compared to other parts of the world. An interesting thing that is happening today is the expectation of future asset inflation to hide yearly income, but gold and bit coin have probably already run their course. The rich get richer because they are always thinking and worried about their money. I like a quote from Zorba the Greek: “Clever people and grocers, they weigh everything”
OILK is the answer.
JRAY
The Fed has morphed into something it was never intended to be.
It was first created as the “lender of last resort” in banking problems…
Now, it is the lender of FIRST resort with gimmicks like the Standing Repo Facility….where designated entities can tap into a pot of money to relend to others at very low rates. (Bank customers like Hedge Funds that feed speculation with cheap available money)
There is no discovery of interest rates based on supply and demand in a free market environment. The Fed prevents the free market.
The US Treasuries markets are the largest free market in the world and much larger than any other markets for anything.
How is a market “free” when the Fed is there to make certain interest rates do not rise beyond what they think is reasonable?
The SRF is there to hold down interest rates, not prop them up.
The Fed has 5 policy rates, which I list each time I discuss the FOMC rate-setting meeting. 4 of these policy rates bracket the Fed’s policy range for overnight interest rates, which is 25 basis points from upper and to lower end:
— Two “ceiling rates” (SRF and Discount Window) to keep rates from going far above the Fed’s policy range
— Two “floor rates” (ON RRPs and IORB) to keep overnight rates from falling below the Fed’s policy range.
This is called “rate control.” It’s the Fed’s job to control short-term rates as part of its monetary policies.
Happy Birthday Jesus!
I know we have the date wrong probably but as long as we remember you and what you said figure you have a sense of humor and will let it slide.
The Framework is His Appointed Times. Leviticus 23.
Kings are anointed (and born?) on Yom Teruah. Revelation 12:1.
May All People be Blessed!
Just saw this opinion piece in NYT. It suggests that the increased ownership of US debt by hedge funds is a significant risk factor.
The NY Times just now woke up to the “basis trade?” 🤣 Why were these people asleep for the last 10 years?
The basis trade — where hedge funds buy Treasuries and sell futures — essentially blew up the Treasury market in March 2020 until the Fed stepped in with huge QE. It has been discussed by the Fed many times, and I have discussed it here too, years ago.
The NYT bla-bla-bla bloat piece never mentioned the term “basis trade,” but that’s what it discussed eventually after the huge pile of bla-bla-bla, and it then even linked the Fed’s report from October on the basis trade, and that report had “basis trade” in the title, LOL.
Why do people still go to the NY Times for economic and financial news and analysis? You go to the NYT for your daily massive dose of Trump bashing, recipes, book reviews, how to put on makeup properly, and funny stories written by women about manhood.
Wolf….just asking…..
Is it not true that big hedge funds need treasuries to use in the SOFR or for other secured borrowings? I read an article that mentioned such, and said many are in the Caymans. Yes?
1. “…hedge funds need treasuries to use in the SOFR or for other secured borrowings”
SOFR (Secured Overnight Financing Rate) is an interest rate calculation by the New York Fed. It’s not a market, but an average rate of a certain part of the repo market. Hedge funds borrow in the repo market at various rates, and those rates are then part of what makes up the SOFR calculations.
2. Hedge funds borrow in the repo market to fund their Treasury purchases that they hold in the Cayman Islands and use as base for Treasury futures that they create and sell… that’s precisely the “basis trade.” The basis trade is a risk because it is hugely leveraged by borrowing overnight in the repo market.
LOL very accurate synopsis of the NYT
Fred: Federal Gov Current Tax Receipts: $3.6T/Qt. If SPX turns around
realized gains taxes will lift it up, before stalling and falling.
Gold indicates inflation. New innovative co might cannibalize the mag7. QQQ buying climax/AR was in big red Oct 10. In early Dec investors distributed shares. The first phase of the downturn will last until JP is gone.
Gold and silver both indicate nothing other than manic speculation.
Fred: the General Account is: $833B. The current tax receipts from
custom duties annual rate: $331B/Qt. Tax collection and custom duties went vertical under Trump. We never had anything like that.
The interest to tax receipt ratio may be improving but the other expenditures are going through the roof and far exceed the remaining 67% of receipts, hence the huge deficit. So perhaps the overall position is even worse than the 50% ratio of the early 80s would suggest?
An overall measure for that is the debt-to-GDP ratio (5th chart). The “debt” reflects ALL accumulated deficits since all deficits have to be borrowed. Nominal GDP (size of the economy) is what generates tax receipts.