Every housing market dances to its own dynamics.
By Wolf Richter for WOLF STREET.
In some markets, prices of mid-tier single-family homes, condos, and co-ops have sunk substantially from their peaks in 2022, 2023, or 2024. In other markets prices have continued to rise, though at a much slower pace than in 2021 and 2022. Here we track 33 large and expensive markets by Metropolitan Statistical Area or MSA (Census-designated urban areas often consisting of multiple cities).
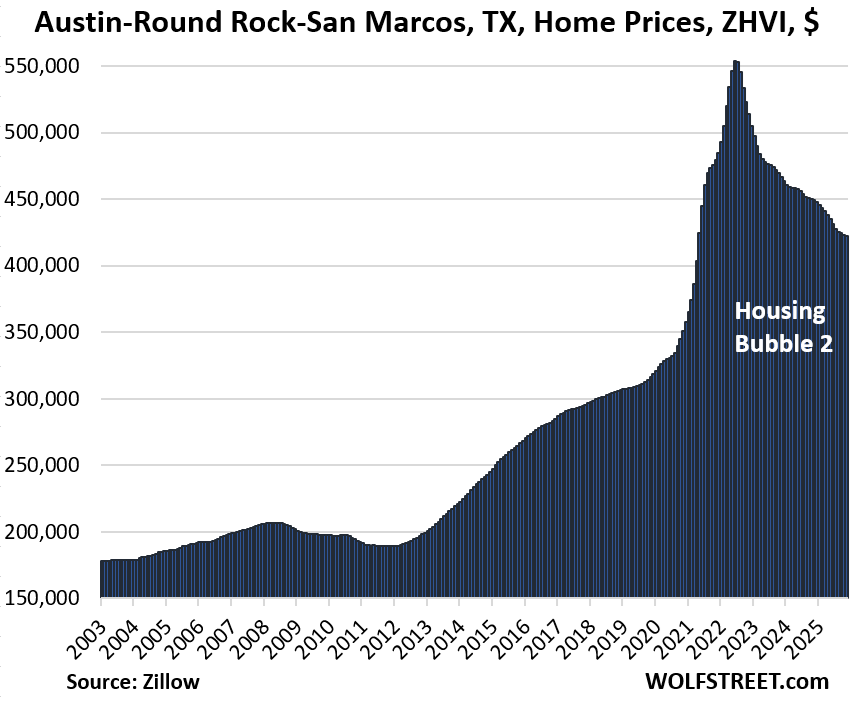
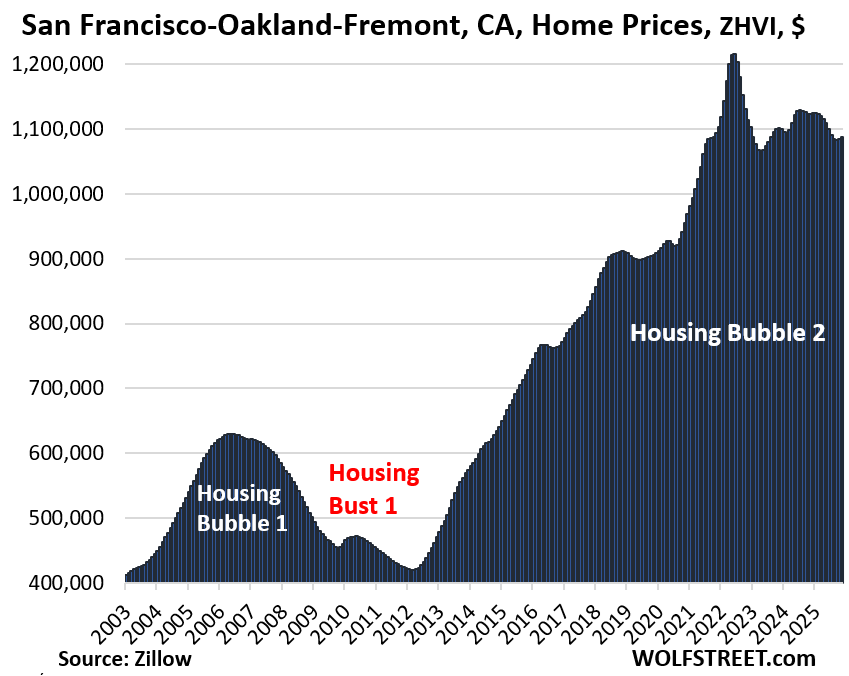
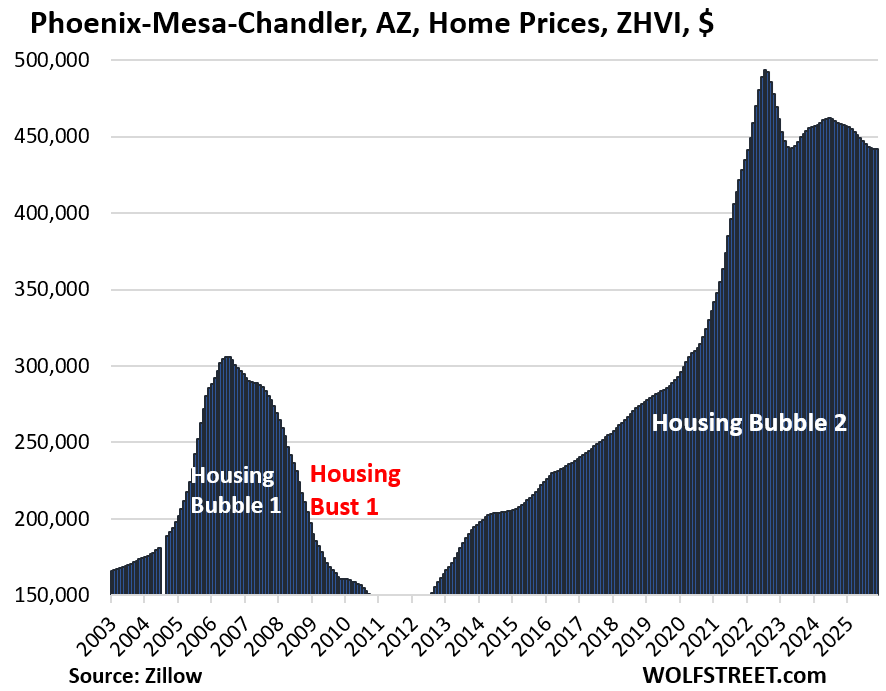
Prices in November declined year-over-year in 22 of the 33 MSAs that we track here, up from 6 at the end of 2024. The three MSAs with the biggest drops were Austin-Round Rock-San Marcos, TX (-23.6%), San Francisco-Oakland-Fremont, CA (-10.5%), and Phoenix-Mesa-Chandler, AZ (-10.4%).
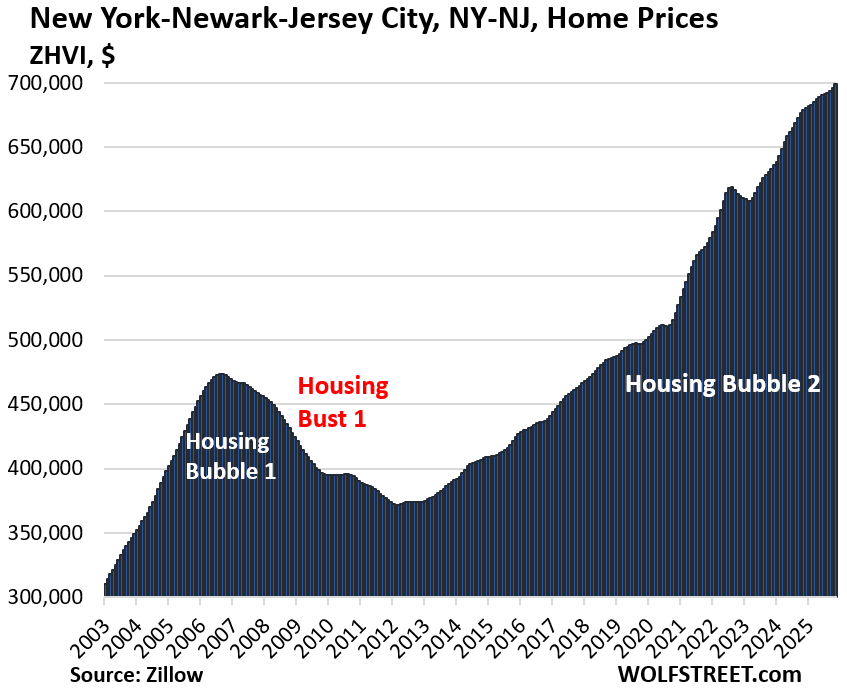
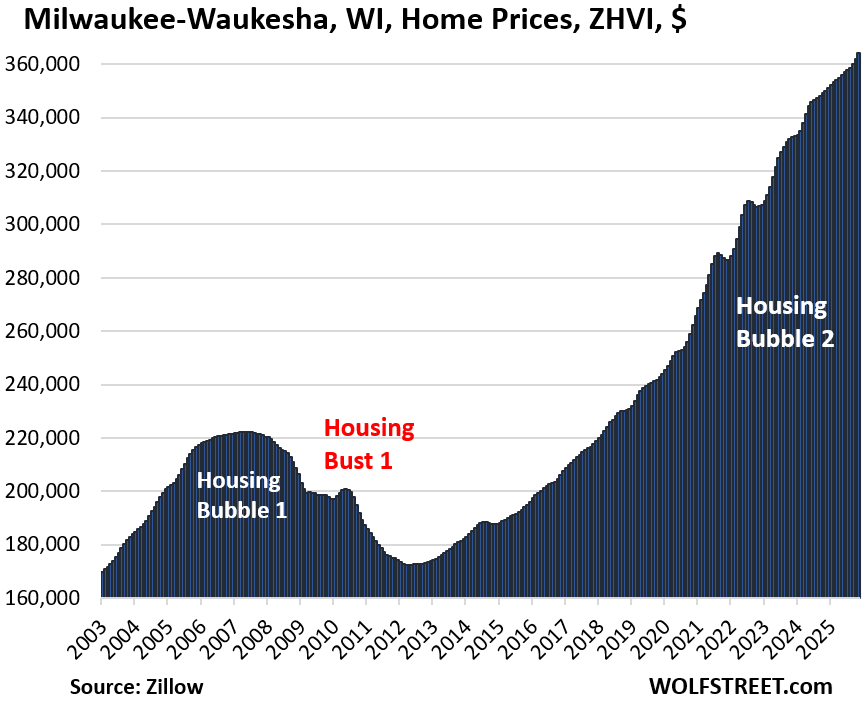
In 9 of our 33 MSAs here, prices rose to new highs in November. The three MSAs of them with the biggest year-over-year price increases were Milwaukee-Waukesha, WI (+4.1%), Chicago-Naperville-Elgin, IL-IN (+3.7%), and New York-Newark-Jersey City, NY-NJ (+3.0%).
To qualify for the 33 most splendid housing bubbles, the MSA must be one of the largest by population and must have had home prices of at least $300,000 at some point. Some metros that are large enough don’t qualify for this list because home prices never reached $300,000, despite the blistering surge of home prices in recent years, such as the metros of New Orleans, Memphis, Oklahoma City, Tulsa, Cincinnati, and Pittsburgh.
Prices were down from their highs in prior years in 23 of the 33 metros.
In 23 of our 33 metros, prices peaked in 2022, 2023, or 2024 and have declined since then. Of them, 17 experienced their peaks in 2022; Atlanta’s was in 2023, and the peaks of Miami, San Diego, Charlotte, San Jose, and Los Angeles occurred in 2024:
Percentage declines from their respective peaks in prior years through November 2025:
- Austin, TX: -23.6%
- San Francisco: -10.5%
- Phoenix: -10.4%
- San Antonio: -8.7%
- Tampa: -7.7%
- Sacramento: -7.3%
- Denver: -7.1%
- Dallas: -6.8%
- Orlando: -5.0%
- Miami: -5.0% (2024 peak)
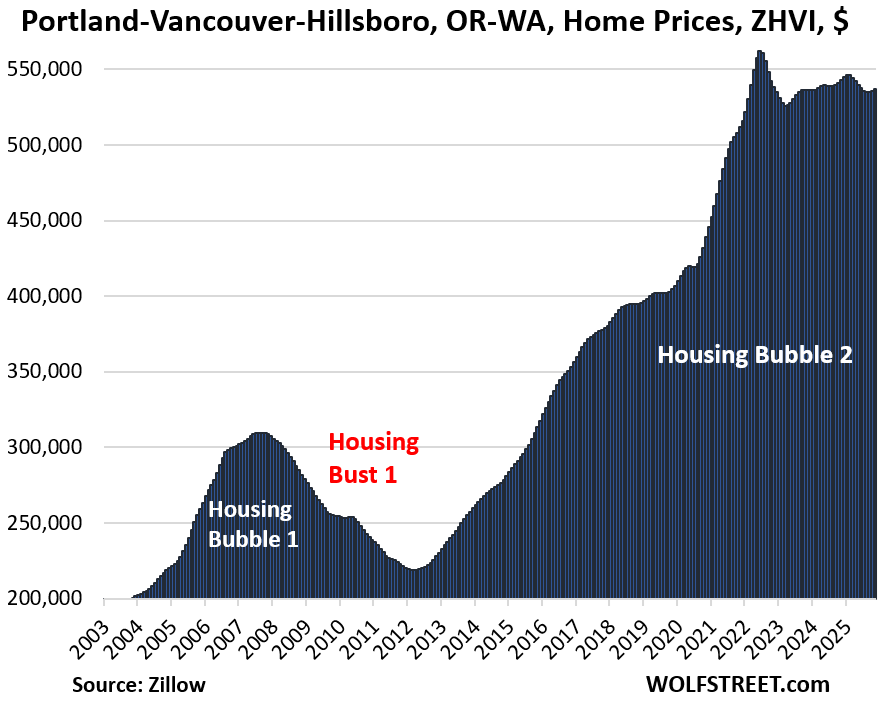
- Portland: -4.7%
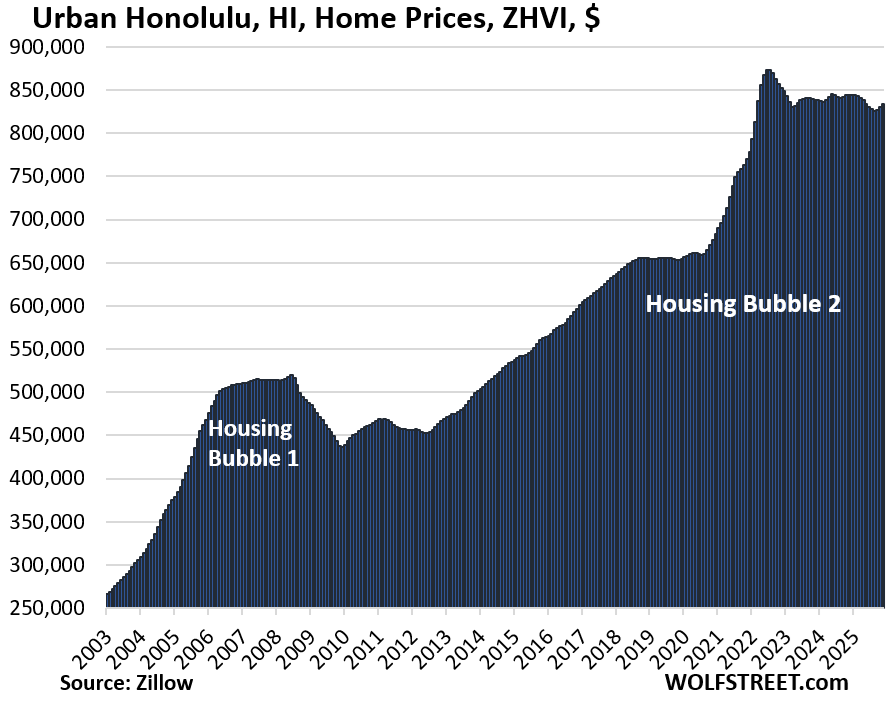
- Honolulu: -4.6%
- San Jose: -3.9% (2024 peak)
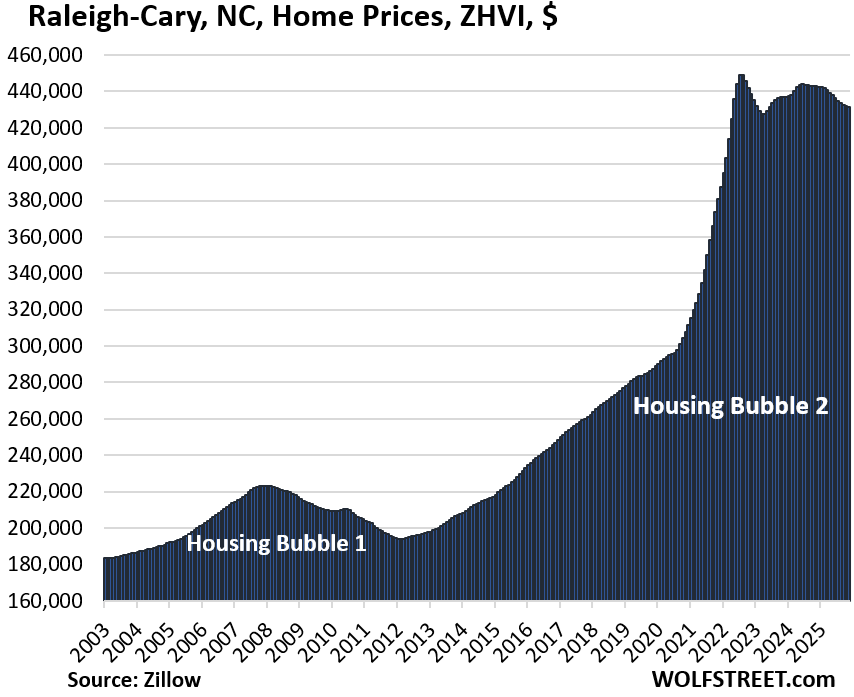
- Raleigh: -3.9%
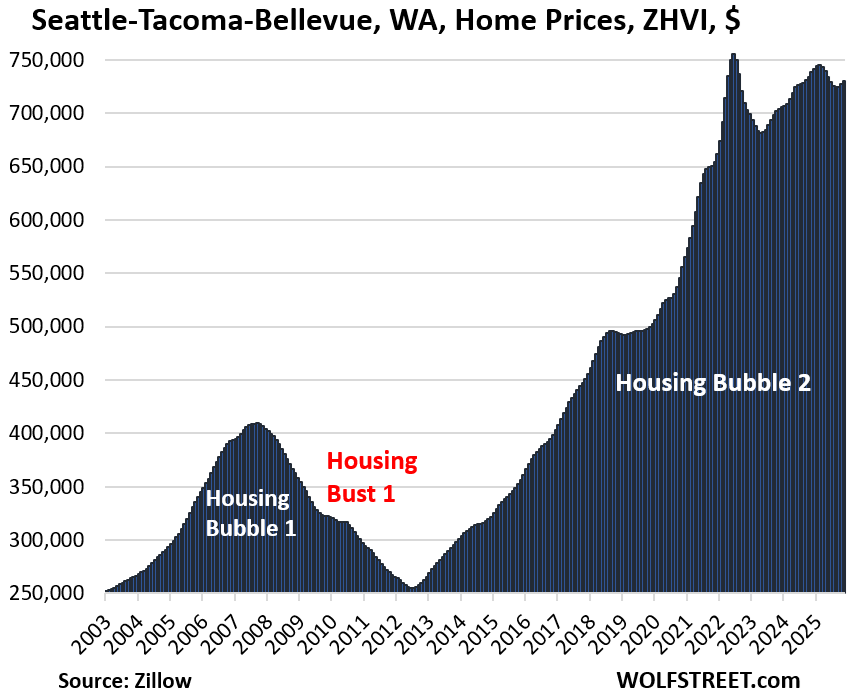
- Seattle: -3.4%
- Atlanta: -3.4% (2023 peak)
- Houston: -3.2%
- Las Vegas: -3.0%
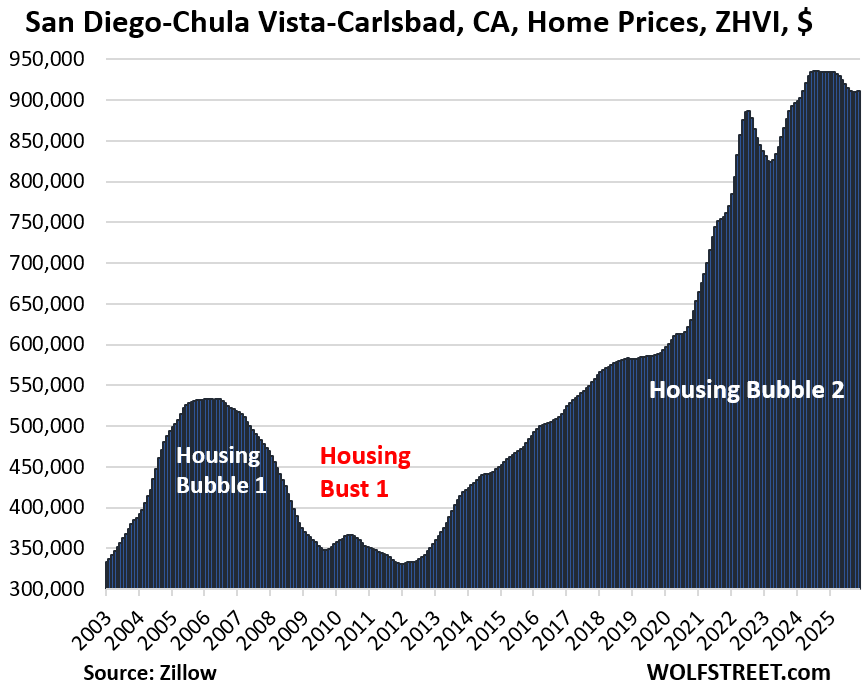
- San Diego: -2.7% (2024 peak)
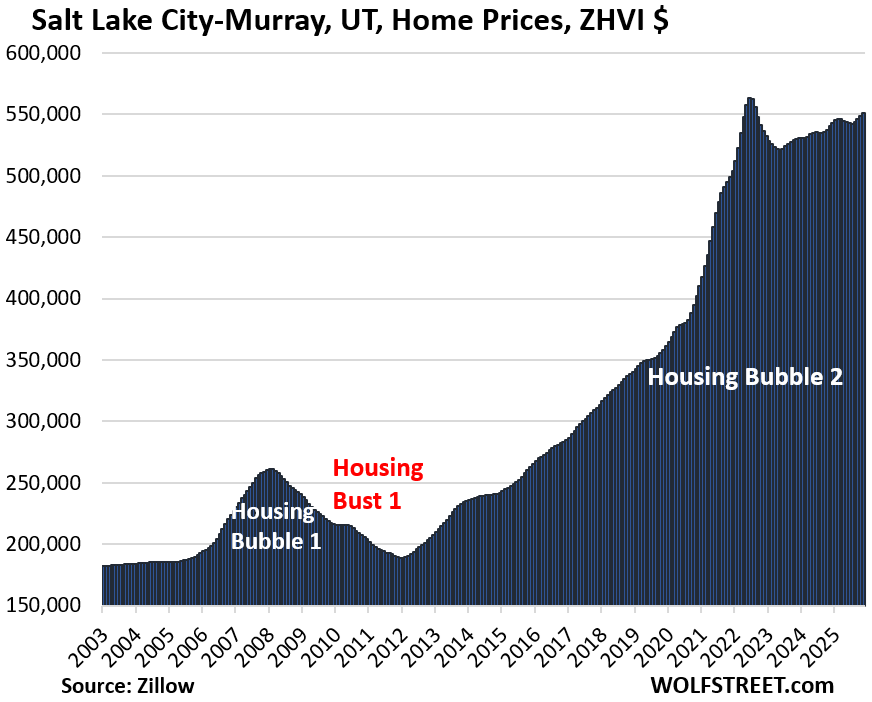
- Salt Lake City: -2.1%
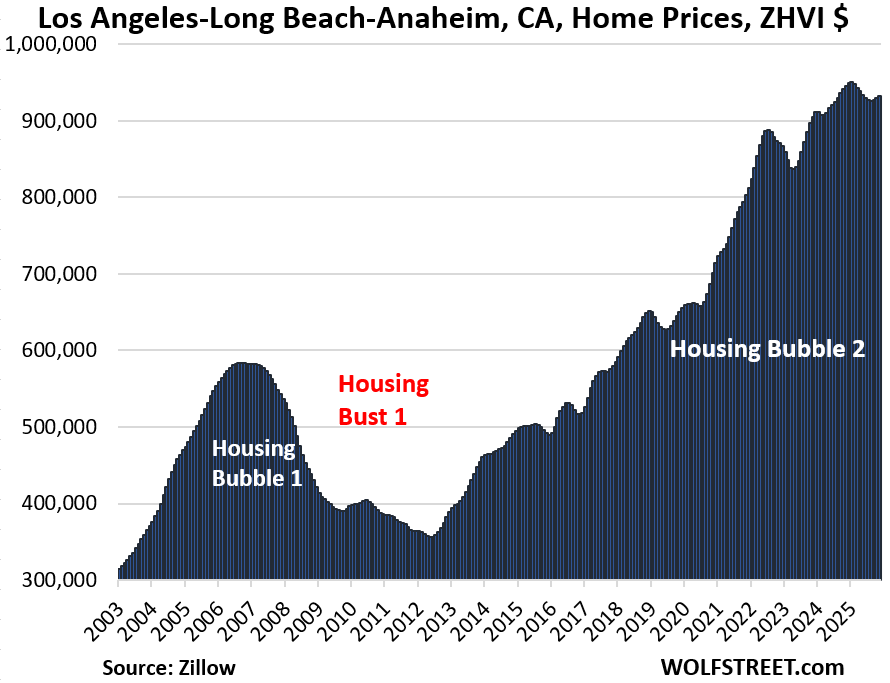
- Los Angeles: -1.8% (2024 peak)
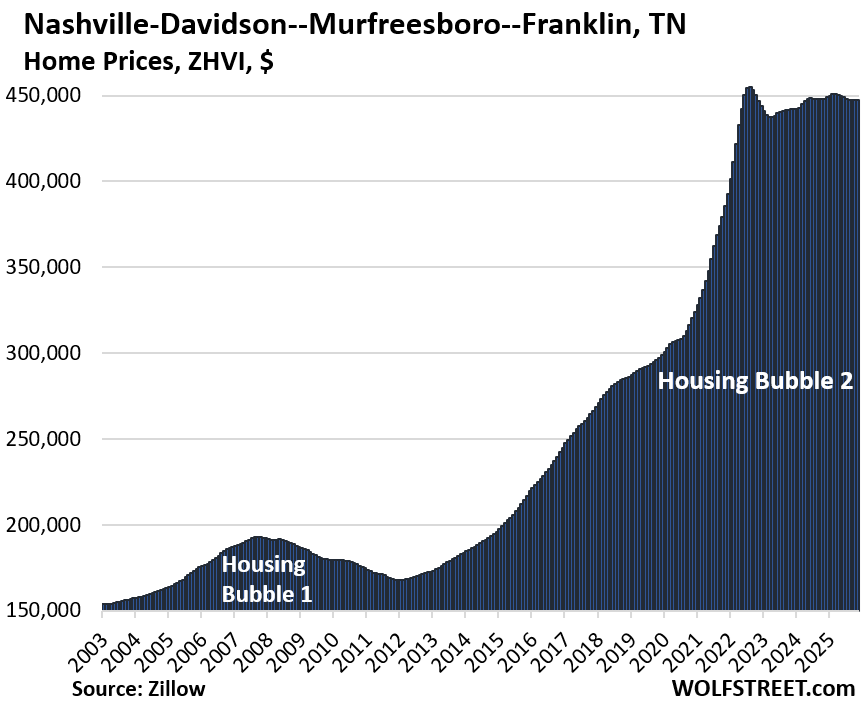
- Nashville: -1.7%
- Charlotte: -0.9% (2024 peak)
Prices reached a new high in 9 of the 33 MSAs (YoY % rise):
- Milwaukee: +4.1%
- Chicago: +3.7%
- New York City: +3.0%
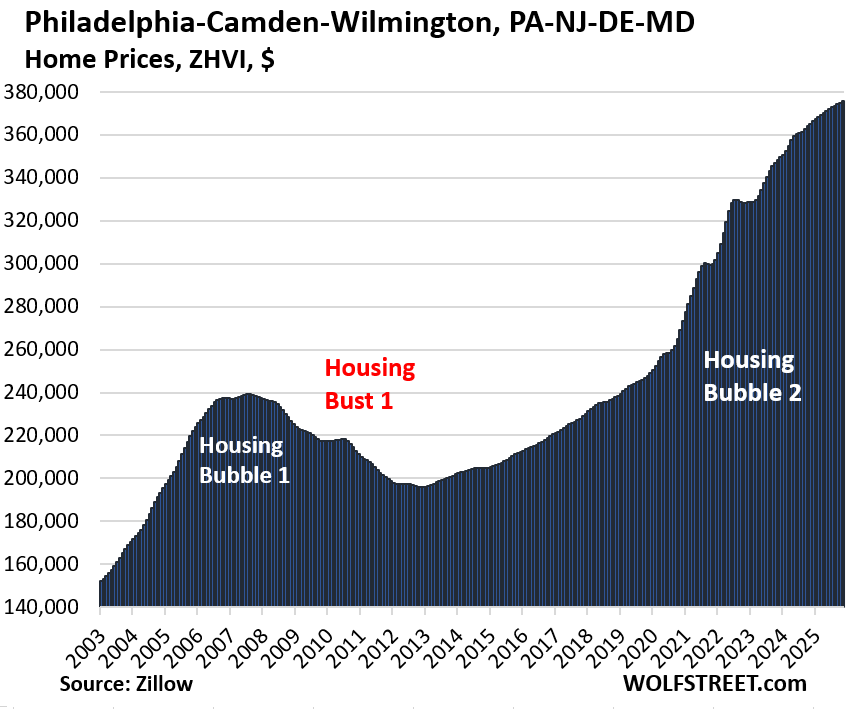
- Philadelphia: +2.9%
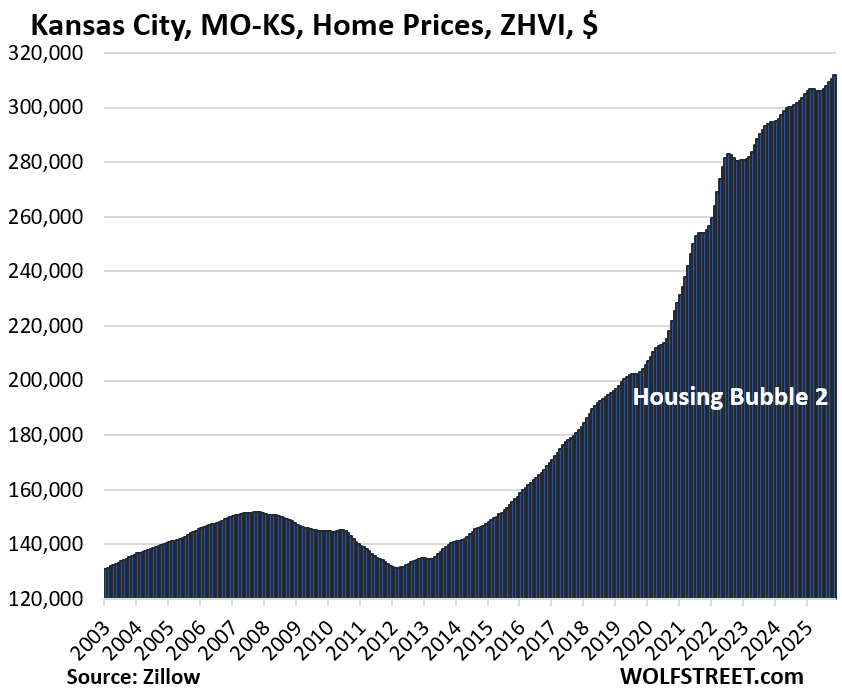
- Kansas City: +2.7%
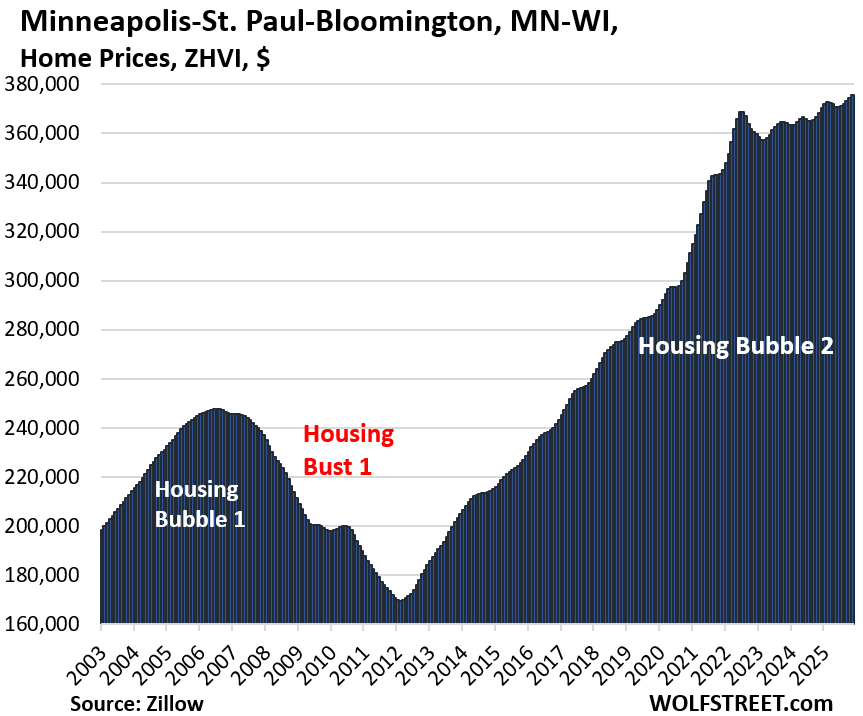
- Minneapolis: +2.0%
- Boston: +1.5%
- Columbus, OH: +1.5%
- Baltimore: +1.4%
Prices declined year-over-year in 22 of the 33 MSAs:
- Tampa, FL: -6.0%
- Austin, TX: -6.0%
- Miami, FL: -4.7%
- Orlando, FL: -4.4%
- Dallas, TX: -4.0%
- Phoenix, AZ: -3.4%
- San Francisco, CA: -3.2%
- Denver, CO: -3.0%
- San Antonio, TX: -2.9%
- Atlanta, GA: -2.9%
- San Diego, CA: -2.5%
- Raleigh, NC: -2.5%
- Sacramento, CA: -2.3%
- Houston, TX: -2.1%
- San Jose, CA: -1.9%
- Las Vegas, NV: -1.6%
- Honolulu, HI: -1.3%
- Los Angeles, CA: -1.3%
- Portland, OR: -1.1%
- Seattle, WA: -1.1%
- Charlotte, NC: -0.7%
- Nashville, TN: -0.1%
Methodology: All pricing data here for the 33 metropolitan statistical areas (MSA) are from the seasonally adjusted three-month-average mid-tier Zillow Home Value Index (ZHVI). The ZHVI is based on millions of data points in Zillow’s “Database of All Homes,” including from public records (tax data), MLS, brokerages, local Realtor Associations, real-estate agents, and households across the US. It includes pricing data for off-market deals and for-sale-by-owner deals. Zillow’s Database of All Homes also has sales-pairs data.
The 33 Most Splendid Housing Bubbles.
In the little tables, MoM = month over month; YoY = year-over-year. In the column furthest to the right: the percentage increase “since 2000.”
| Austin-Round Rock-San Marcos, TX, Home Prices | |||
| From Jun 2022 peak | MoM | YoY | Since 2000 |
| -23.8% | -0.3% | -6.0% | 147% |
Back to April 2021. Prices had exploded by 73% from January 2020 through June 2022. A little over half of that price explosion has been backed out:
| San Francisco-Oakland-Fremont, CA, Home Prices | |||
| From May 2022 peak | MoM | YoY | Since 2000 |
| -10.5% | 0.3% | -3.2% | 284% |
Back to August 2021. From January 2020 through June 2022, prices exploded by 33%.
The MSA includes San Francisco, much of the East Bay (such as Oakland), much of the North Bay, and goes south on the Peninsula into Silicon Valley through San Mateo County. It does not include the San Jose metro, which covers the southern portion of the Bay Area, and we’ll get there in a moment.
| Phoenix-Mesa-Chandler, AZ, Home Prices | |||
| From Jun 2022 peak | MoM | YoY | Since 2000 |
| -10.4% | 0.0% | -3.4% | 211% |
Prices exploded by 65% from January 2020 through June 2022.
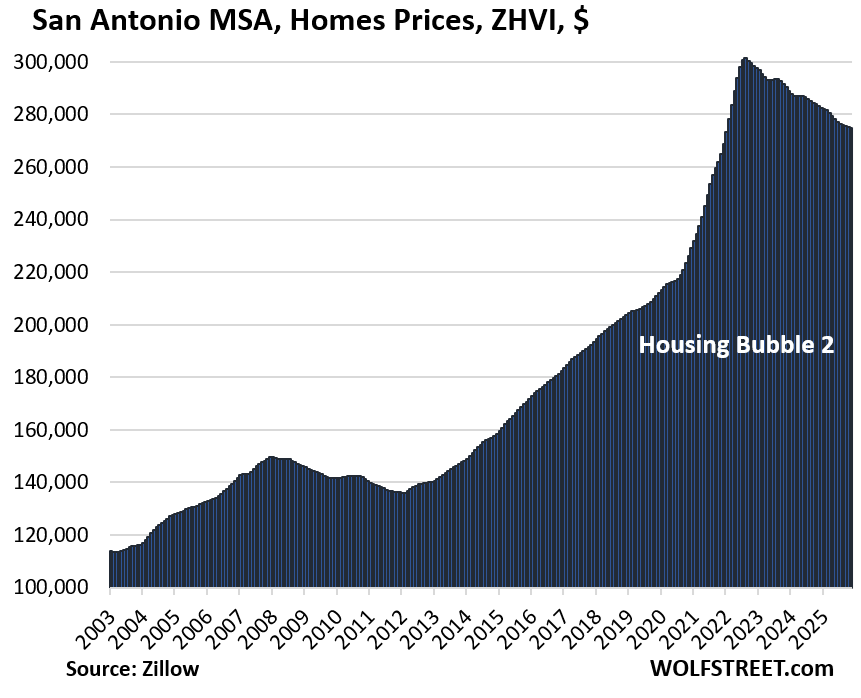
| San Antonio MSA, Home Prices | |||
| From Jul 2022 peak | MoM | YoY | Since 2000 |
| -8.7% | -0.1% | -2.9% | 143% |
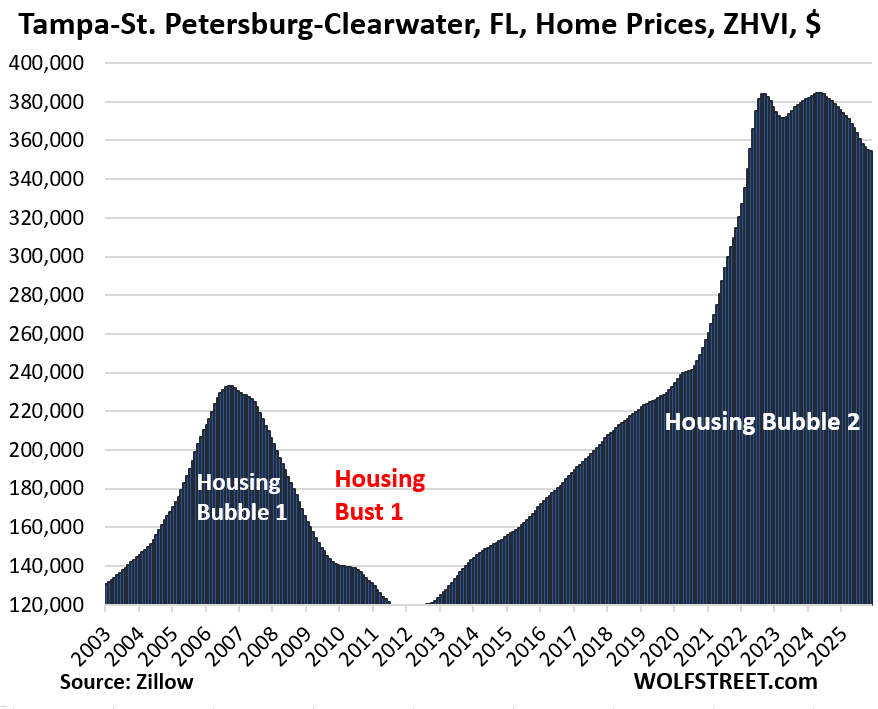
| Tampa-St. Petersburg-Clearwater, FL, Home Prices | |||
| From Jul 2022 peak | MoM | YoY | Since 2000 |
| -7.7% | -0.2% | -6.0% | 252% |
Prices exploded by 60% between January 2020 and June 2022.
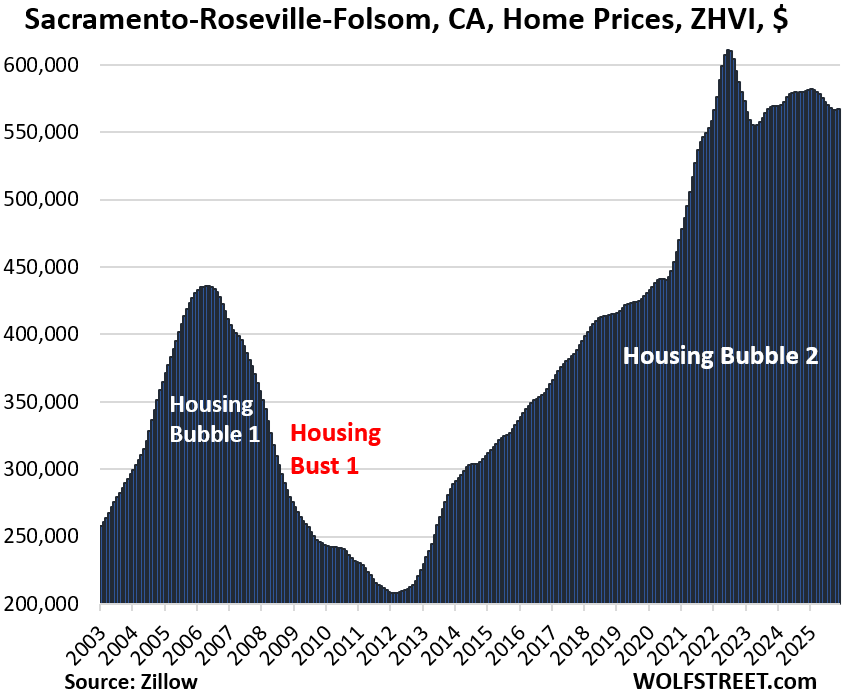
| Sacramento-Roseville-Folsom, CA, Home Prices | |||
| From July 2022 peak | MoM | YoY | Since 2000 |
| -7.2% | 0.1% | -2.3% | 239.5% |
| Denver-Aurora-Centennial, CO, Home Prices | |||
| From Jun 2022 peak | MoM | YoY | Since 2000 |
| -7.1% | 0.1% | -3.0% | 203% |

| Dallas-Fort Worth MSA, Home Prices | |||
| From Jun 2022 peak | MoM | YoY | Since 2000 |
| -6.8% | -0.1% | -4.0% | 183% |

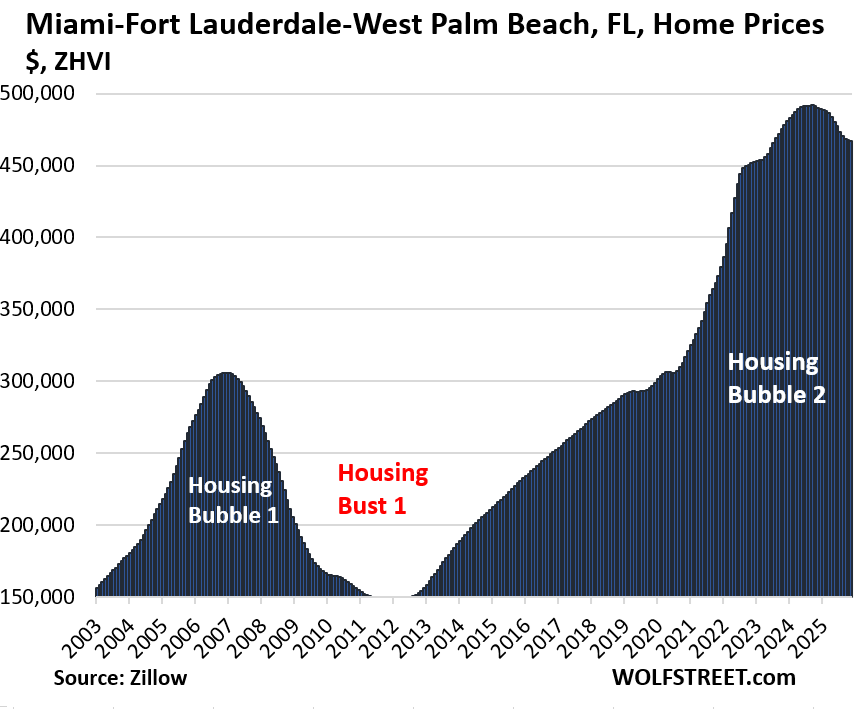
| Miami-Fort Lauderdale-West Palm Beach, FL, Home Prices | |||
| From Sep 2024 peak | MoM | YoY | Since 2000 |
| -5.0% | -0.2% | -4.7% | 312% |
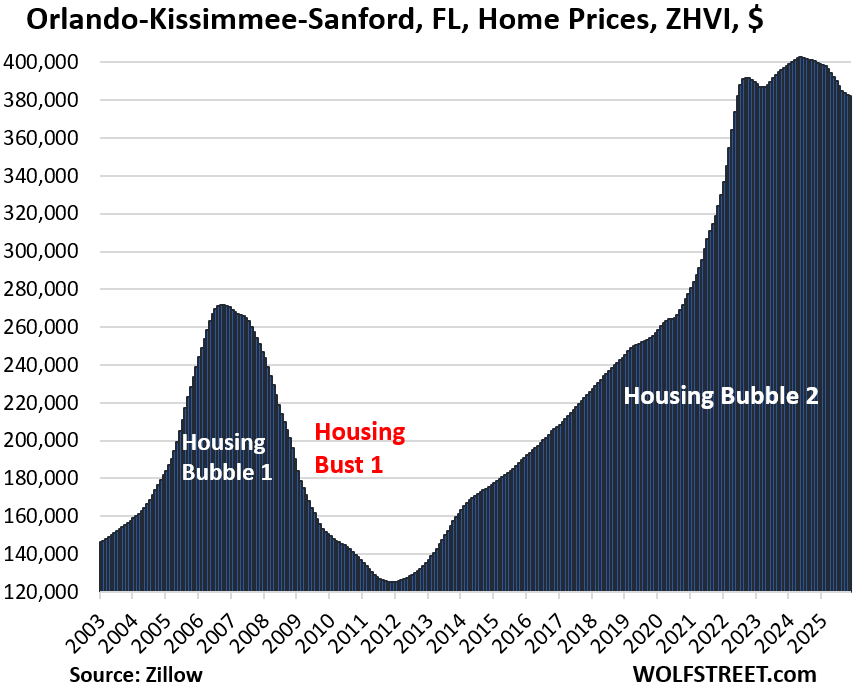
| Orlando-Kissimmee-Sanford, FL, Home Prices | |||
| From June 2022 | MoM | YoY | Since 2000 |
| -5.0% | -0.1% | -4.4% | 223% |
Prices exploded by 48% between January 2020 and June 2022.
| Urban Honolulu, HI, Home Prices | |||
| From Jun 2022 peak | MoM | YoY | Since 2000 |
| -4.6% | 0.4% | -1.3% | 279% |
| Portland-Vancouver-Hillsboro, OR-WA, Home Prices | |||
| From May 2022 peak | MoM | YoY | Since 2000 |
| -4.5% | 0.2% | -1.1% | 213% |
| Raleigh-Cary, NC, Home Prices | |||
| From July 2022 peak | MoM | YoY | Since 2000 |
| -3.9% | -0.1% | -2.5% | 152% |
| Seattle-Tacoma-Bellevue, WA, Home Prices | |||
| From May 2022 peak | MoM | YoY | Since 2000 |
| -3.4% | 0.4% | -1.1% | 235% |
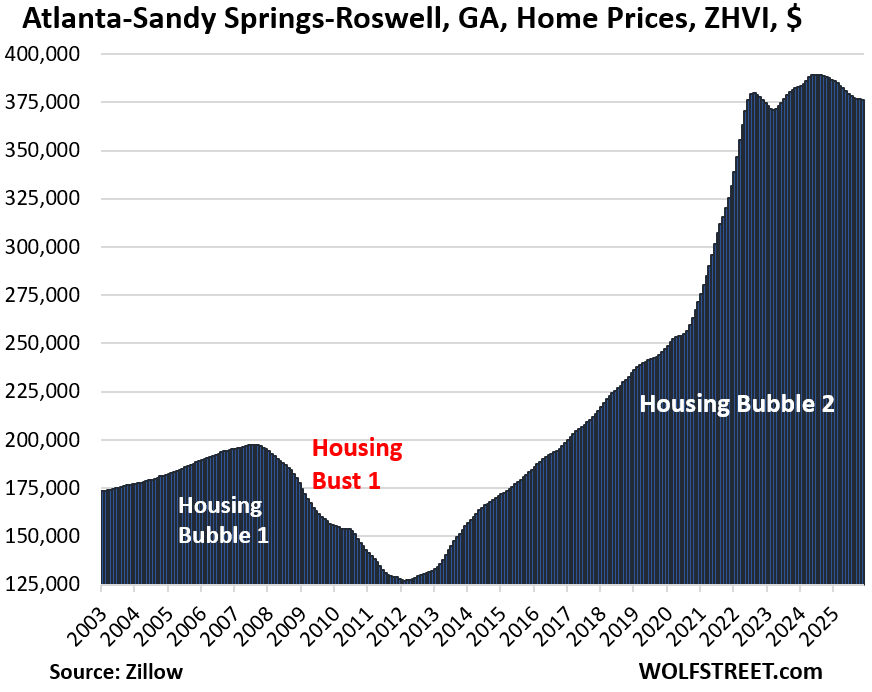
| Atlanta-Sandy Springs-Roswell, GA, Home Prices | |||
| From July 2022 | MoM | YoY | Since 2000 |
| -3.4% | -0.1% | -2.9% | 155% |
Prices exploded 51% between January 2020 and June 2022.
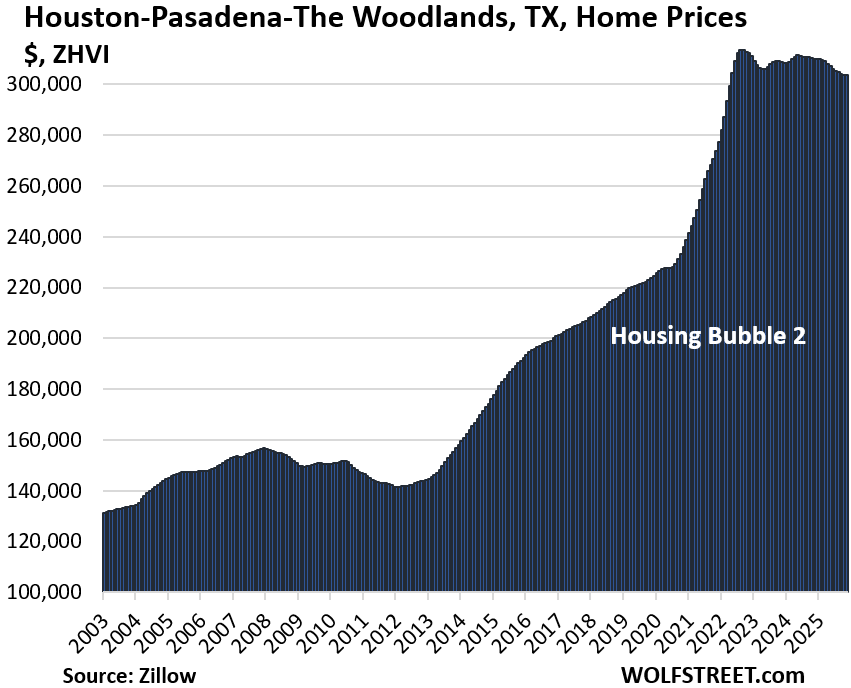
| Houston-Pasadena-The Woodlands, TX, Home Prices | |||
| From Jul 2022 peak | MoM | YoY | Since 2000 |
| -3.2% | -0.1% | -2.1% | 146% |
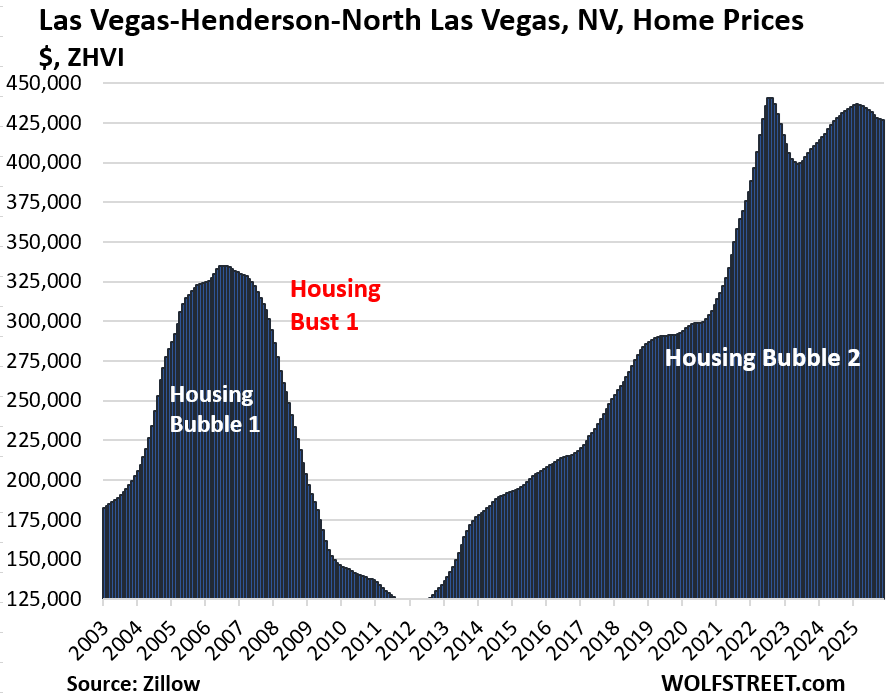
| Las Vegas-Henderson-North Las Vegas, NV, Home Prices | |||
| From June 2022 peak | MoM | YoY | Since 2000 |
| -3.2% | -0.1% | -1.6% | 177% |
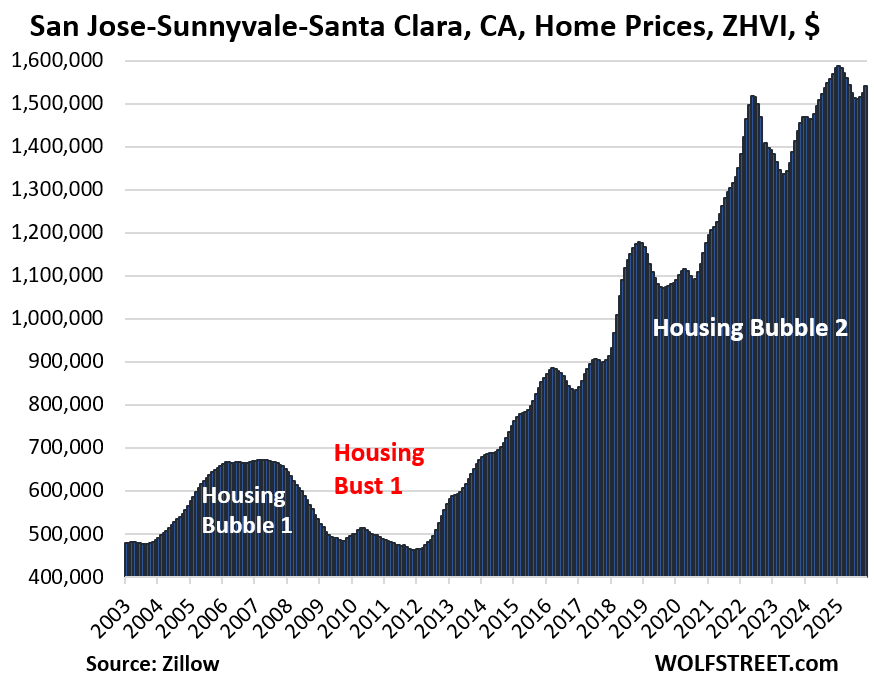
| San Jose-Sunnyvale-Santa Clara, CA, Home Prices | |||
| Fr Dec 2024 high | MoM | YoY | Since 2000 |
| -2.9% | 1.0% | -1.9% | 335% |
| San Diego-Chula Vista-Carlsbad, CA, Home Prices | |||
| Fr Jul 2024 peak | MoM | YoY | Since 2000 |
| -2.7% | 0.1% | -2.5% | 328% |
Prices exploded by 53% between January 2020 and June 2022.
| Salt Lake City-Murray, UT, Home Prices | |||
| From July 2022 peak | MoM | YoY | Since 2000 |
| -2.1% | 0.5% | 2.0% | 220% |
| Los Angeles-Long Beach-Anaheim, CA, Home Prices | |||
| Fr Dec 2024 high | MoM | YoY | Since 2000 |
| -1.8% | 0.4% | -1.3% | 327% |
| Nashville MSA, Home Prices | |||
| From July 2022 peak | MoM | YoY | Since 2000 |
| -1.7% | 0.1% | -0.1% | 216% |
Prices exploded by 50% between January 2020 and June 2022.
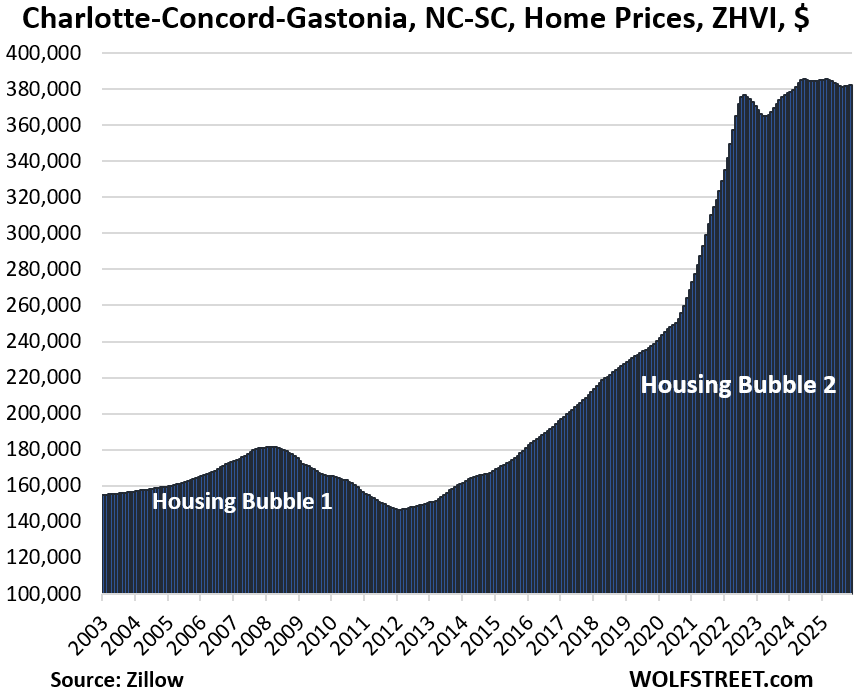
| Charlotte-Concord-Gastonia, NC-SC, Home Prices | |||
| Fr May 2024 peak | MoM | YoY | Since 2000 |
| -0.9% | 0.1% | -0.7% | 167% |
Prices exploded by 54% between January 2020 and June 2022.
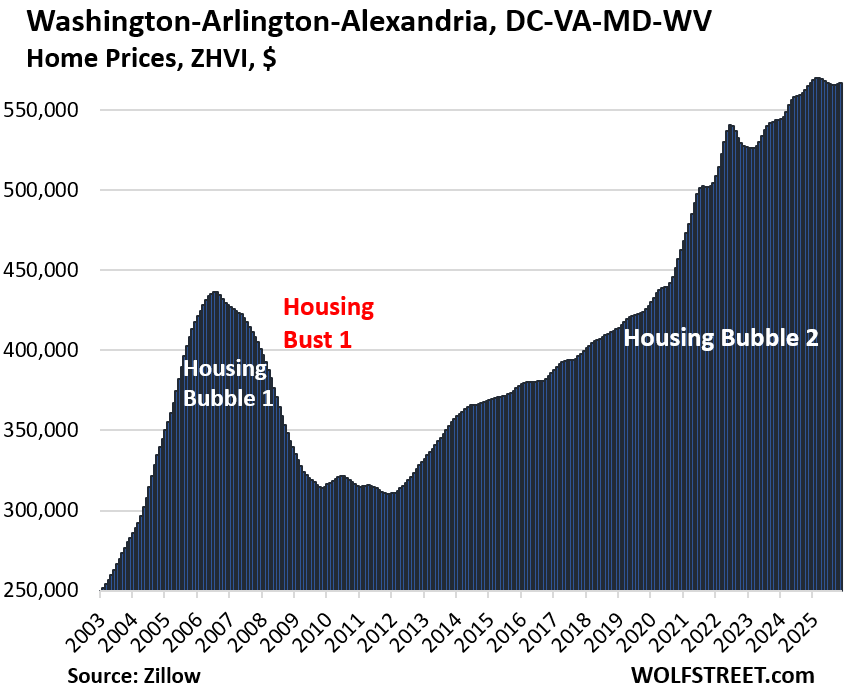
| Washington-Arlington-Alexandria, DC-VA-MD-WV, Home Prices | ||
| MoM | YoY | Since 2000 |
| 0.2% | 0.4% | 217% |
| Baltimore MSA, Home Prices | |||
| MoM | YoY | Since 2000 | |
| 0.0% | 1.4% | 178% | |

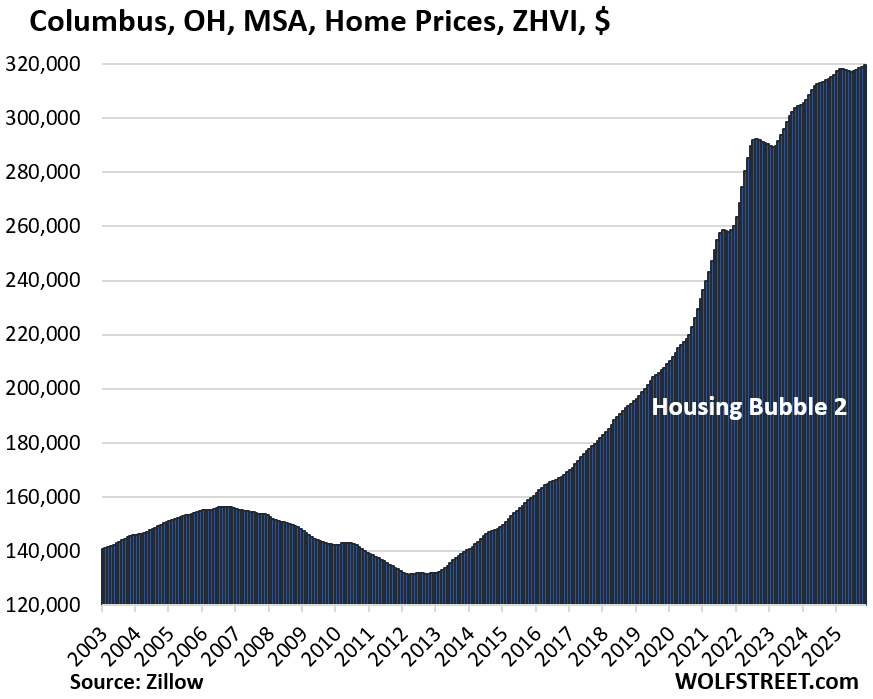
| Columbus, OH, MSA, Home Prices | ||
| MoM | YoY | Since 2000 |
| 0.2% | 1.5% | 156% |
Prices exploded by 43% between January 2020 and June 2022. From January 2020 through November 2025, prices exploded by 51%.
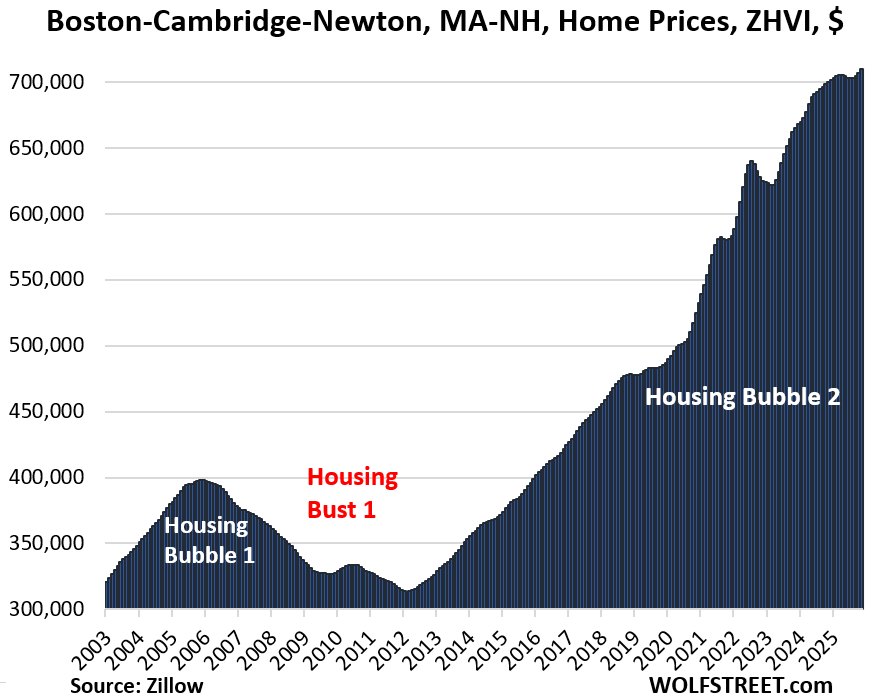
| Boston-Cambridge-Newton, MA-NH, Home Prices | ||
| MoM | YoY | Since 2000 |
| 0.4% | 1.5% | 229% |
| Minneapolis-St. Paul-Bloomington, MN-WI, Home Prices | ||
| MoM | YoY | Since 2000 |
| 0.3% | 2.0% | 162% |
| Kansas City, MO-KS, Home Prices | ||
| MoM | YoY | Since 2000 |
| 0.4% | 2.7% | 182% |
| Philadelphia-Camden-Wilmington, PA-NJ-DE-MD, Home Prices | ||
| MoM | YoY | Since 2000 |
| 0.2% | 2.9% | 210% |
| New York-Newark-Jersey City, NY-NJ, Home Prices | ||
| MoM | YoY | Since 2000 |
| 0.5% | 3.0% | 222% |
| Chicago-Naperville-Elgin, IL-IN, Home Prices | ||
| MoM | YoY | Since 2000 |
| 0.5% | 3.7% | 120% |

| Milwaukee-Waukesha, WI, Home Prices | ||
| MoM | YoY | Since 2000 |
| 0.7% | 4.1% | 154.8% |
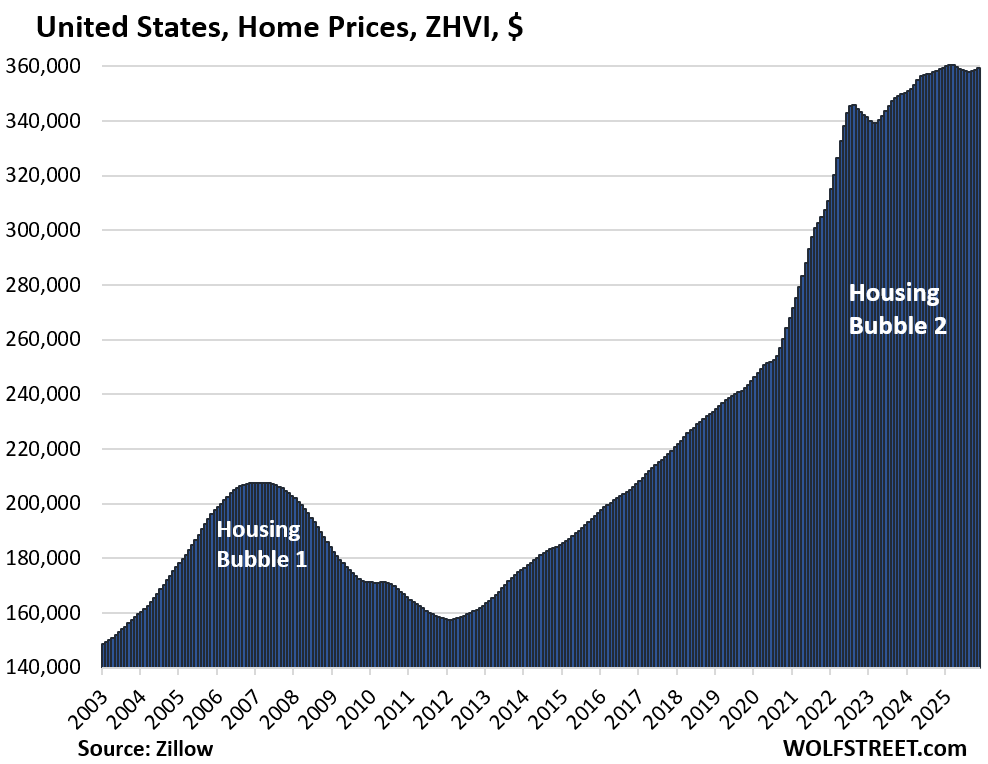
But at the national level, year-over-year price declines of mid-tier homes in some markets and increases in other markets balanced each other out, and on a year-over-year basis, prices were essentially unchanged in November, and down a hair from their peak in February this year.
And in case you missed it:
NAR Says Typical First-Time Homebuyer Age Was 40 in 2025, up from 33 in 2021. But Is this Accurate?
Enjoy reading WOLF STREET and want to support it? You can donate. I appreciate it immensely. Click on the mug to find out how:

![]()
A spectacular crash and hopefully the government stops inflating the assets (wishful thinking). I hope this all leads to lower rates to refinance by.
As much as I like to believe the probability this….I will have to bet that it’s more wishful thinking at this point…
Btw…paint sure do dry slow in some region…on the the hand, Austin looks great, those quick drying paint it’s making the watch the paint dry process less painful
Austin, TX: -23.6%
Los Angeles, CA: -1.3%
Portland, OR: -1.1%
Seattle, WA: -1.1%
The price spike in Austin was beyond ridiculous.
Seattle was correcting and then it just went right back up.
How is the government inflating any assets? Please do tell.
A Buffet-ism: Price must be considered relative to interest rates.
Interest rate repression happened worldwide, driven by central banks.
No sane free market would ever purchase a 10-year government bond at a yield of 0.5%.
The brain-melting ZIRP/NIRP era concluded with the blowoff top in house prices in many markets.
I know you’re reading Wolfstreet. I can only assume you understand that interest rates would never be “0,” or negative in a “FREE market Capitalist” system: unless a Mighty (governmental) force were to be bearing down on them.
“How is the government inflating any assets. Please do tell.”
I give you a few recent examples—when the Federal Reserve purchased junk bonds in 2020 to support the private corporate bond investors; when it paid off Silicon Valley Bank depositors in over FDIC limits; when it purchased mortgage bonds to support the housing market; and all of so-called QE. And filing by deficit spending, printing fiat money, and ignoring inflationary risks. Look at the recent price trends for silver and then try tell me they are losing control..
Jerome Powell and the FED buying trillions in mortgage-backed securities to steal housing from workers and families was criminal. There should be an investigation into why the decision was made to do that, and who put forth the idea to begin with.
Alas, these pigs are unaccountable. It’s hard to not want to dance on their graves after they meet their maker. They have hurt society so badly the damage is incalculable. It almost seems that things could never be the same again, that they distorted shelter to the point of an unattainable luxury.
This did not start with Powell. He just carried on the QE and ZIRP folly from Bernanke and Yellen which accelerated asset prices.
It’s all just coupons. And now we just have to ride out the next storm. These high prices are the big boomer assets, and as they really start churning, new prices in inflated dollars will be set. 2008 for housing is not coming, instead local market conditions are going to be more important. Seattle has Amazon and Microsoft money out the wazoo, and it shows. Look at Silicon Valley real estate, that has been expensive for how long?
I think just watching the news is surreal, the stock market is surreal, the bond market has serious cracks forming, but the mega businesses built on all this just have to keep churning everything.
How was any housing ‘stolen from workers’ at all? MBS instruments are just a way of funding mortgages and they would have sold in the markets easily had the Federal Reserve not bought a percentage of them.
Buying MBS is a way to keep mortgage rates low and minimize risk to lenders. That creates demand for housing.
Exactly has Bernanke intended when he wrote about QE in 2009.
Curious about the metros that didn’t qualify because their prices are below $300,000. In an economy where affordability is an issue why don’t you do a review the affordable metros.
If that is true, why did the Fed buy MBS?
You should ask yourself some obvious counter questions before commenting.
I think DC meant the opportunity was stolen.
Are you a high or are you trolling? Yes, MBS instruments would have sold in the markets easily without the Fed buying them, but not at sub 3% yields. It was those artificially low yields and rates that led to the housing bubble.
“Are you a high or are you trolling?”
Comment of the year!
One to remember over the holidays….
Boston region still making its way up even past the nosebleed section now!
Rick,while legally a N.H. resident am a licensed carpenter outside of Boston,in some areas starting to see minuscule drops and in N.H. seeing a slight bit more realistic pricing on smaller homes with a lot of land(my goal),that said,while watching daily am still at moment on buyers strike.
I checked out condos/townhomes in Southern California last night. Even with the price drops, the average HOA fees were over $700 a month. If you buy a $500K condo, you’re on the hook for $5K in property taxes plus another $8400 in HOA fees. $13K a year and that doesn’t even include utilities and insurance. That’s an affordability problem. Same goes for much of the US. Albuquerque, Tucson, and Phoenix have low cost condos, but HOA dues are $300-500 a month. Unless they include water/trash/internet, it’s just not worth it. And heaven forbid there’s a special assessment or in flood/fire/hurricane zone. A friend of mine who owns a condo said his special assessments continue to run over budget.
“And heaven forbid there’s a special assessment”
Amen. We had to fork over thousands for a pool replastering that didn’t need it. Then insult to injury the project was botched because no one was monitoring it.
Other foibles like handing over money for a paint job in a color you hated, a service company that sued because a resident had allegedly sexually harassed an employee, it seemed to never end.
When the HOA issues a special assessment to fund major maintenance and repair items — repairing a pool, replacing a central water heater, etc. — that’s really a bad sign. It should have built a reserve fund over the years that is large enough to pay for those things as they occur.
But yes, in my own experience, corruption at the HOA when doling out the work is aggerating.
My Parents owned a townhouse in Boca Florida. They got hit with a gigantic HOA assessment when the cable TV contract was sold. Turns out the original owner of the contract had an easement on the property. The new owners of the Cable contract was sued for millions and had criminal charges filed against them for theft. They won hands down and the owners of the townhouse got hit with a gigantic settlement fee. There was permanent lien on the property and the owner’s aires had the money owed taken out of the estate.
One of the reasons HOA are so expensive in a condo, the association pays the external insurance bill. The owner policy is essentially rental insurance on what’s inside the walls. HOA are getting expensive from insurance everywhere but in high fire areas way expensive. To comment on below; not many extremely wealthy people pay cash for real estate, they get mortgages or loans on their equities stake. The we work guy, Adam Neumann owed JPM for all of his private real estate, and Personal spending, after his fortunes fell JPM was stressed on how much money he owed them. He manage to pay it all off when he sold his we works stake.
My friend in socal pays almost $3K per month for taxes, insurance, and hoa before even the Mortgage kicks in.
His home is a new modest 2K sq ft townhome style home.
His home is classified as townhome but no shared walls, although walls are very close that one can touch hands with neighbors over windws.
It would be interesting to overlay homeowner insurance premium increases to some of these markets where the bubble has popped.
Some of the markets where prices are resilient may have homeowner premiums that have significantly increased but are still not a significant percentage of a mortgage payment. Ditto for property taxes. Ditto for HOA premiums/assessments.
This was my thought too. A lot of these markets in the South and CA might be dropping in price due to the insurance and reinsurance rates increasing.
Anecdotally …
In the Western Suburbs of Chicago prices appear to be pretty stable.
Many multiple family dwellings – Condo & Apartment Buildings – seem to be going up.
A few modest sized house for sale. Even fewer large homes being built. At least that’s
what I notice while we drive around the area.
FWIW
NW Indiana has been building thousands of houses for the past decade to absorb the influx of people moving from Illinois, but still need easy access to the Chicagoland area.
Used to be farmland south of Shererville but now nothing but communities
Bubble #2 decays. Small businesses deflate. The vacancy rate is rising.
The CPI is down nonstop since 9.1% in June 2022. Sam Altman cannot
pay rent. NVDA builds new data centers – with quantum chips and
Blackwell super chips – for themselves. Highly skilled workers will earn more money during deflation. Supermarket prices are rising bc we feed China. China deflates. Demand for oil deflates. The US gov headcount deflates. Tariffs deflates. ACA enrollment deflate. If the dems shut the gov down again ==> deflation will accelerate.
Except the dems did not shut down the government. The inept majority saw to that, and by then the damage had been done.
Hi Wolf, and I apologize unrelatedly to your piece today, FinTimes wrote today about JP Chase withdrawing $350bn from its Fed account to buy Treasuries, nothing this reflects how JP “has been preparing for the end of a period of easy profits in which it was paid to park cash at the Fed while having to pay many of its depositors close to nothing.” I mention this to you just in case it’s grist for a future article by you.
1. That’s not what the FT said. This is what the FT actually said:
https://www.ft.com/content/15b52695-3b3f-4e98-b321-47680dee6c4a
“JPMorgan Chase has withdrawn almost $350bn in cash from its account at the Federal Reserve since 2023 and ploughed much of it into US government debt, as the bank tries to defend itself against rate cuts that threaten to erode its profits.
“JPMorgan, which has more than $4tn in assets, slashed its balance at the Fed from $409bn at the end of 2023 to just $63bn in the third quarter of this year, according to data compiled by industry data tracker BankRegData.
And:
“The bank increased its holdings of US Treasuries over the same period from $231bn to $450bn, a move that allowed it to lock in higher yields in anticipation of the central bank cutting interest rates.”
2. It doesn’t change anything, except for JPM in that reserves at the Fed are instantly liquid, and Treasuries have to be sold for liquidity. But JPM still has lots of reserves and didn’t need to have $450 billion parked at the Fed in 2023, when it started trimming that huge pile.
FredW (and Mr. Richter),
Thanks for bringing up this slightly off-topic question (and Mr. Richter for addressing it). I was hoping for some commentary on this very subject!
“It was the best of times, it was the worst of times”~ Palantir CEO Alex Karp has paid a record $120 million for a ranch outside Aspen, Colo.. most high end ski resorts the high end homes over 20m are selling but not so good for everything else. It’s raining in park city today. Looks like the double top in equities is rolling over. Need the $vix to close above 18.53 for selling to pick up speed. Looking for Dow 30 to move to 45k and bounce to 46k it’s previous support before year end. the Dow 30 has traders attention until it pukes lower.
Much appreciate the correction about the FT article. Thanks.
Yeah I want to know if the house prices are mean or median. The median will be better but it is still be impacted by the “mixed” problem. What if the AI bubble created so much money in stocks and people are buying high end houses only with cash? The interest rate is not an issue here. At the low end, sales are low as people needing financing.
RTGDFA
The article tells you that these are prices of “mid-tier” homes (FIRST LINE! plus two more times), which crushes your theory right off the bat, and the article tells you what the methodology of the prices is (“Methodology” paragraph before the charts).
I see an uptick in the most recent data points in many markets. The methodology says this is seasonally adjusted data, so maybe it’s a statistical wobble, but the fact that it’s 3-month MA suggests there’s some momentum behind this. Could this be due to the 1.5% drop in the 30-year mortgage rate around this time? Did the Fed cut rates too soon?
The December report may help clarify things…
1. seasonally adjusted, month to month: 10 downticks, 2 no change, 21 upticks, a lot of those changes were minuscule
2. Not seasonally adjusted, month to month: 32 had downticks, some pretty big ones (Austin -1.0%), only Honolulu had a minuscule uptick (+0.07%)
The seasonal adjustments are pretty big this time of the year. And they can be off.
Anecdotally un Colorado in the last month I’ve had friends pull their house because no one would pay what they paid in 2022 for it despite then putting an additional $50k of work into it. Another friend made an extremely low ball offer on a condo near one of the resorts that had been sitting on the market. To his surprise it was accepted. I’m hearing more and more things like that but looks like no overall movement in prices based on the above data. I think everyone is waiting for spring 🤷
Waiting for spring is only a viable strategy if you have a family house in a decent school district where you can count on feeding frenzy of parents shopping. A condo near a resort doesn’t meet the same seasonality, nor do 55+ communities. If you’re selling one of those, take the offer and close ASAP.
It would be funny if the sellers waiting for spring discover that all other sellers waited for spring and a huge flood of homes suddenly appears on the market in the spring, while the buyers are still waiting for lower prices.
Yes. Everyone who pulled their house this past year is probably waiting for Spring. Saw more 8-10 month lease rentals posted than I could count. Waiting for the flood of new inventory…. maybe we’ll finally get the race to the door we’ve been waiting for
That’s exactly what we’re expecting to happen. We are selling this spring and are preparing to have massive competition from everyone who pulled their listings in 2025. We will be turnkey and have enough equity to meet the market where it’s at – if we need to cut, we will do so early and aggressively. Getting this place sold before the AI bubble crashes is paramount.
I haven’t really seen that behavior broadly. Some sellers, sure, but mostly it looks like a spot check. They list, test the price, and if they don’t get it, they just pull back. The more common mindset seems to be “we’ll wait until we have to.” There’s no urgency because they don’t feel economic stress in their day-to-day finances or portfolios. As long as that remains true, supply stays optional and sellers wait until their hand is actually forced.
Ok so it’s in a bubble, this is true from a standpoint of affordability. But all of this housing is luxurious and far beyond the thermodynamic output of the vast majority of workers. Somebody SERIOUSLY needs to implement an involuntary sunset clause against market, NIMBY and zoning rules, and fund a high density non market housing build project at scale across the country. Otherwise with this trajectory, there WILL be indignant measurable excess mortality in coming months and years.
Wolf, unsure if this is a typo or not: I was re-reading this article for my own interest and noticed that, while Washington does have its own little table and chart, the city isn’t mentioned in the text.
All good wishes to you.
Correct. It’s one of a few cities that didn’t fit the 3 categories that are mentioned in the text:
1. It has not declined from a high in a previous year (first list);
2. It has not set a new high (second list)
3. It is not down YoY (third list)