Food and energy prices spiked in the delayed Producer Price Index for September.
By Wolf Richter for WOLF STREET.
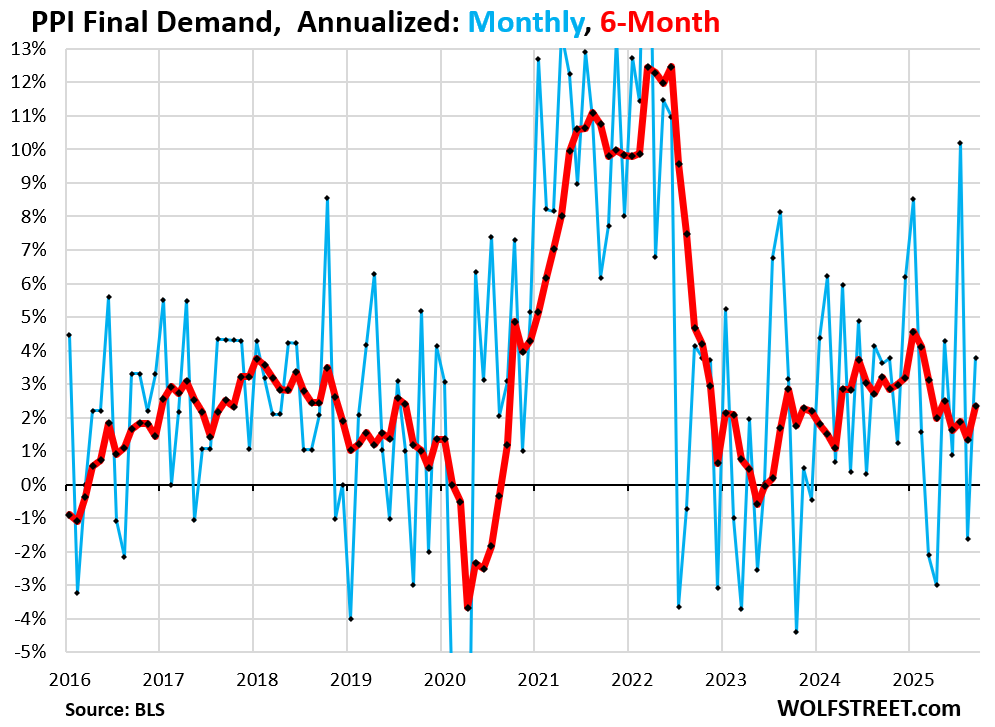
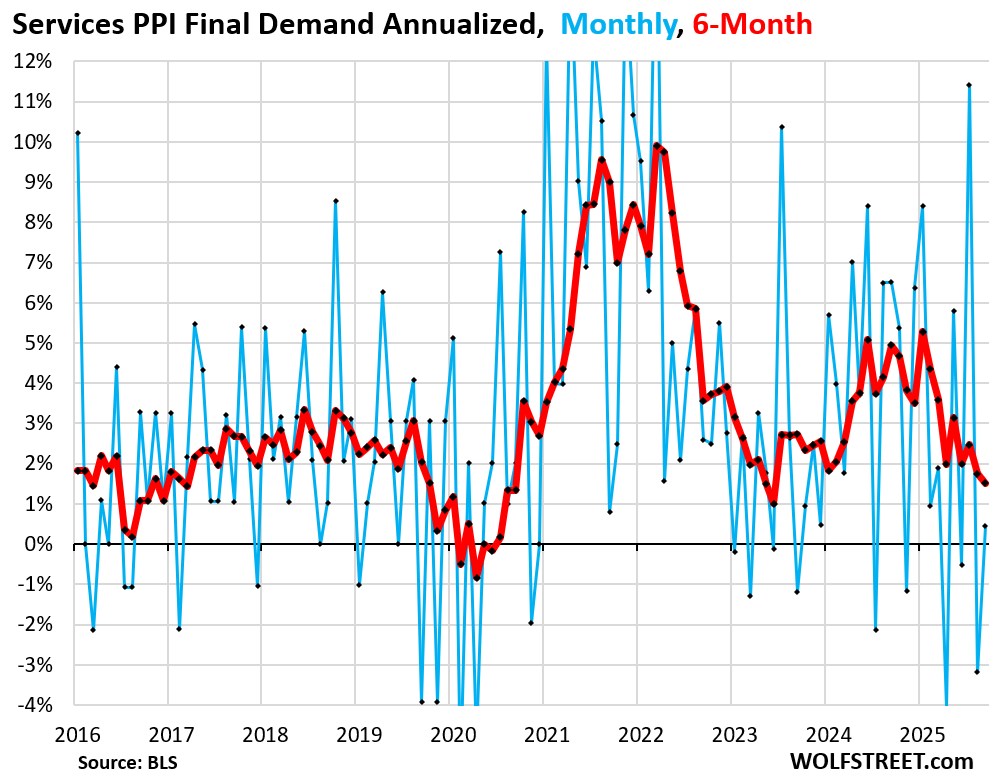
The Producer Price Index Final Demand bounced back in September, rising by 0.31% month-to-month (+3.8% annualized), after the drop in August (-1.6% annualized), seasonally adjusted, according to the delayed release by the BLS today (blue line in the chart).
- Food prices jumped by 1.1% (+14% annualized) month-to-month, after being essentially unchanged in the prior month.
- Energy prices exploded by 3.5% (+51% annualized), after a drop in the prior month.
- Finished core goods (without food and energy) rose by 0.17% (+2.1% annualized)
- Services prices bounced off the negative reading in August, which had followed the spike in July. The PPI for trade services dropped, while all other services combined rose, with Transportation and warehouse services spiking by 0.8% (+10% annualized).
The six-month average accelerated to +2.3% annualized in September, from +1.3% in August (red line in the chart):
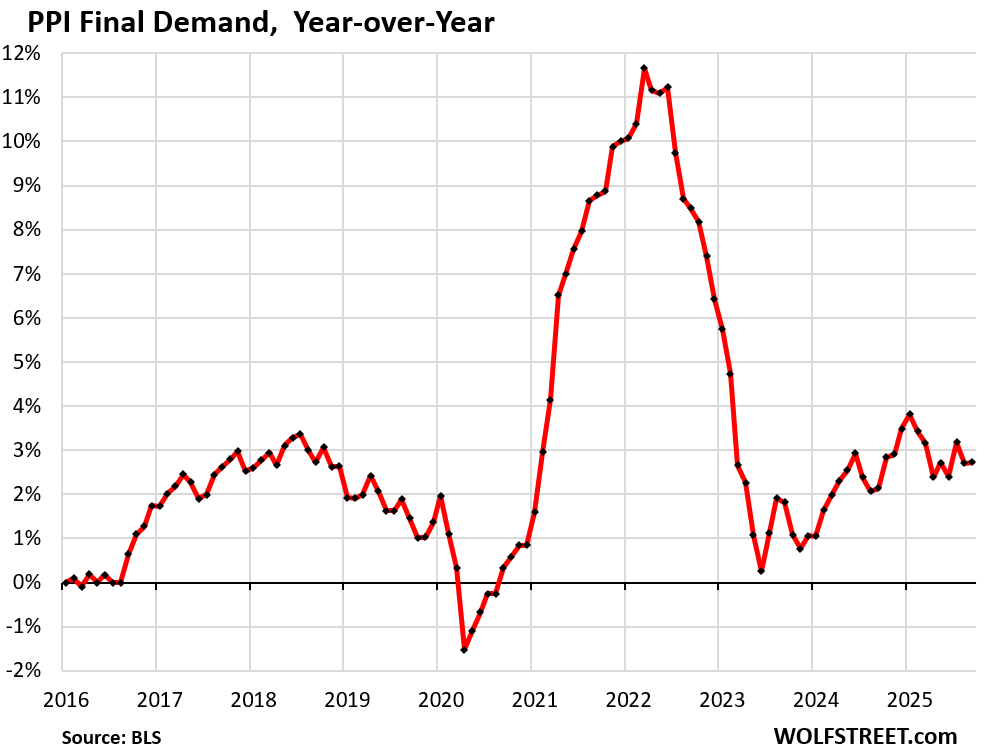
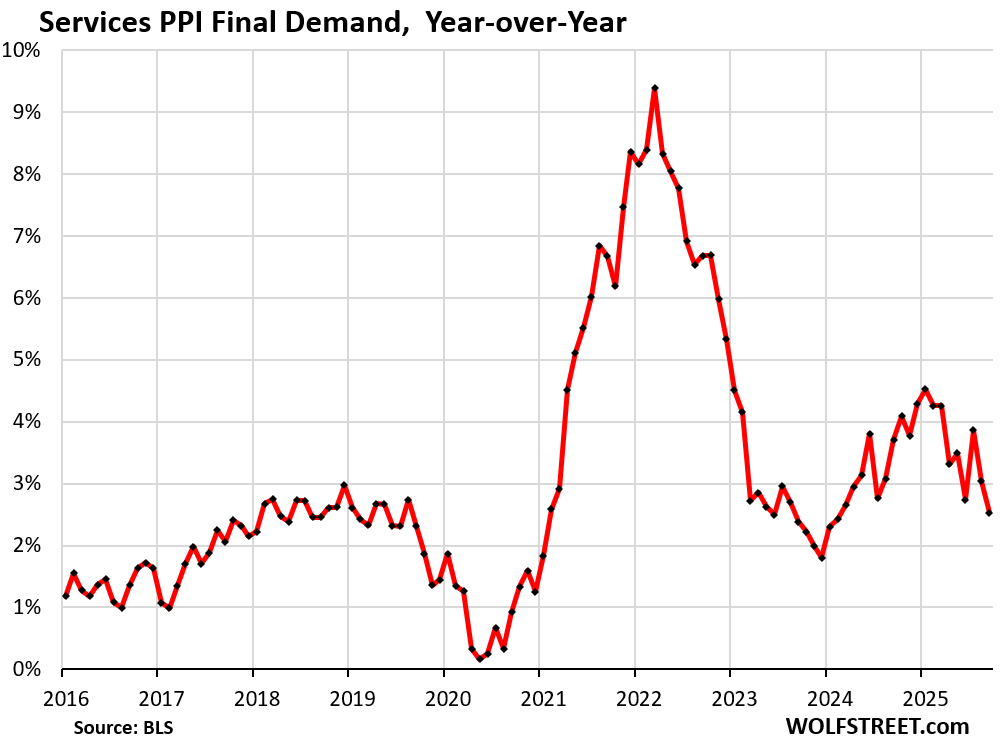
Year-over-year, the PPI Final Demand rose by 2.72%, and August was revised higher to +2.70% today, from the originally reported +2.60%, and July was also revised higher today.
June 2023 had marked the low point at near 0%. Since then, the PPI has accelerated in its zigzagging manner.
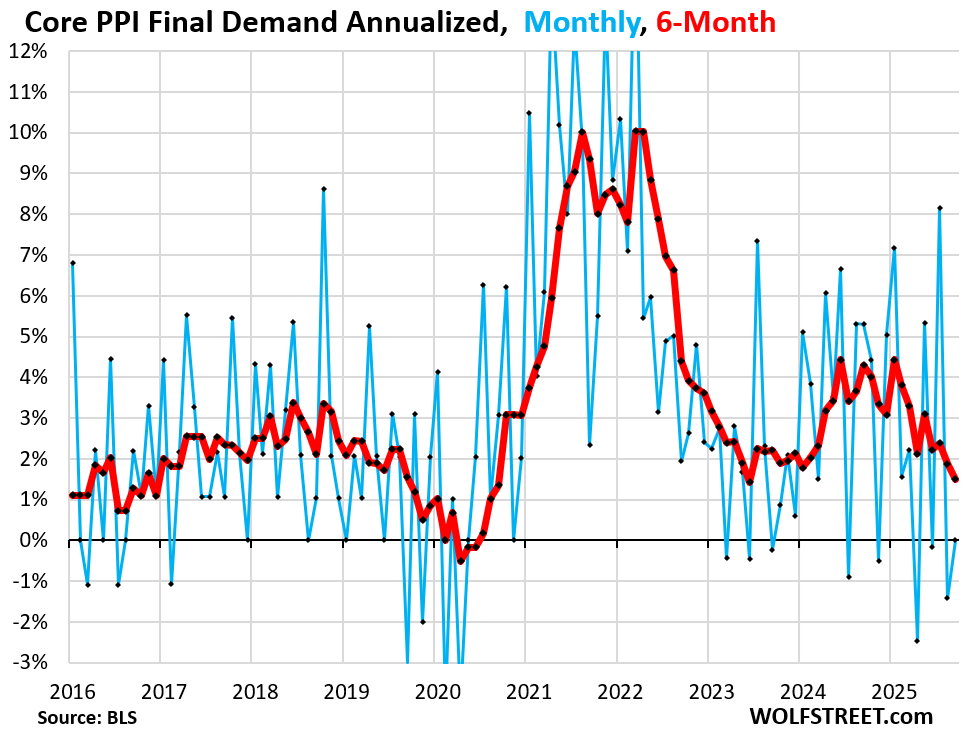
“Core PPI Final Demand, which includes all goods and services except food and energy, was unchanged in September after the drop in August.
The six-month average rose by 1.5% in September from August, a deceleration from the prior month.
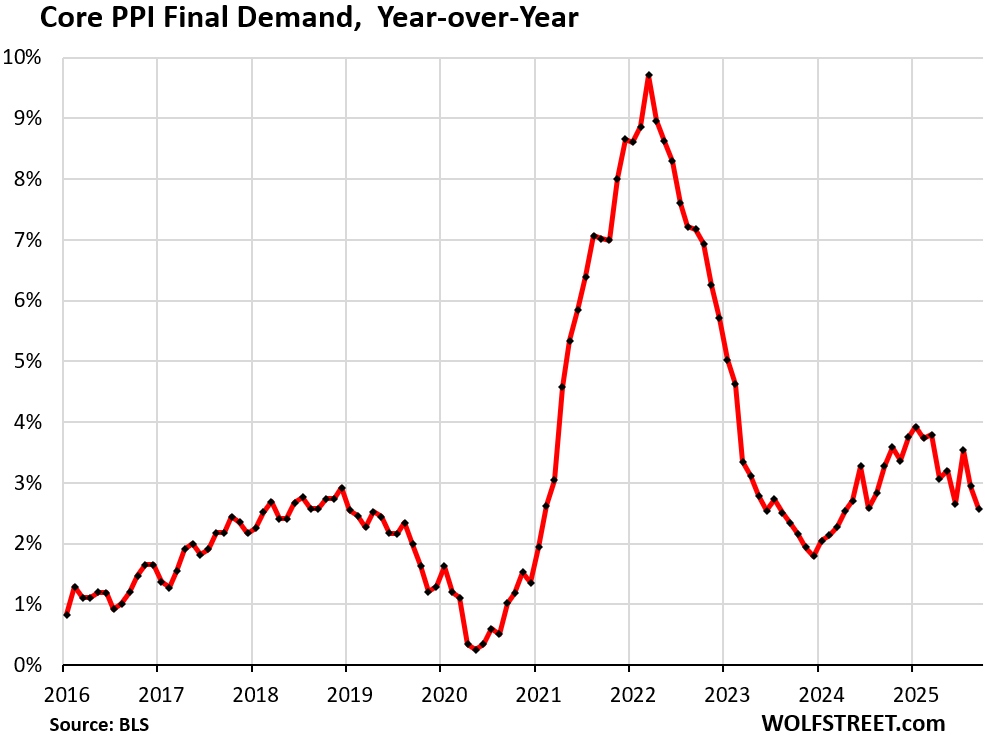
Year-over-year, the core PPI decelerated to +2.57%, but the prior month was revised up to +2.95% (from the originally reported +2.83%):
The PPI Final Demand Services edged up +0.04% (+0.4% annualized) in September, after the negative reading in August, which had followed the majestic spike in July.
The month-to-month change was a mix of:
- Transportation and warehousing services: +0.8%
- Final demand trade services: -0.2%.
- Other services: +0.1%
Year-over-year, the core services PPI rose by 2.53%, and August was revised up to +3.04% from the originally reported + 2.9%.
The PPI for “Finished Core Goods” rose by 0.17% (+2.1% annualized) month-to-month in September, after the jump in August that was revised up to +4.5% annualized (from the originally reported +3.8%).
The six-month average inched down to +3.46% from the upwardly revised +3.50% in August.
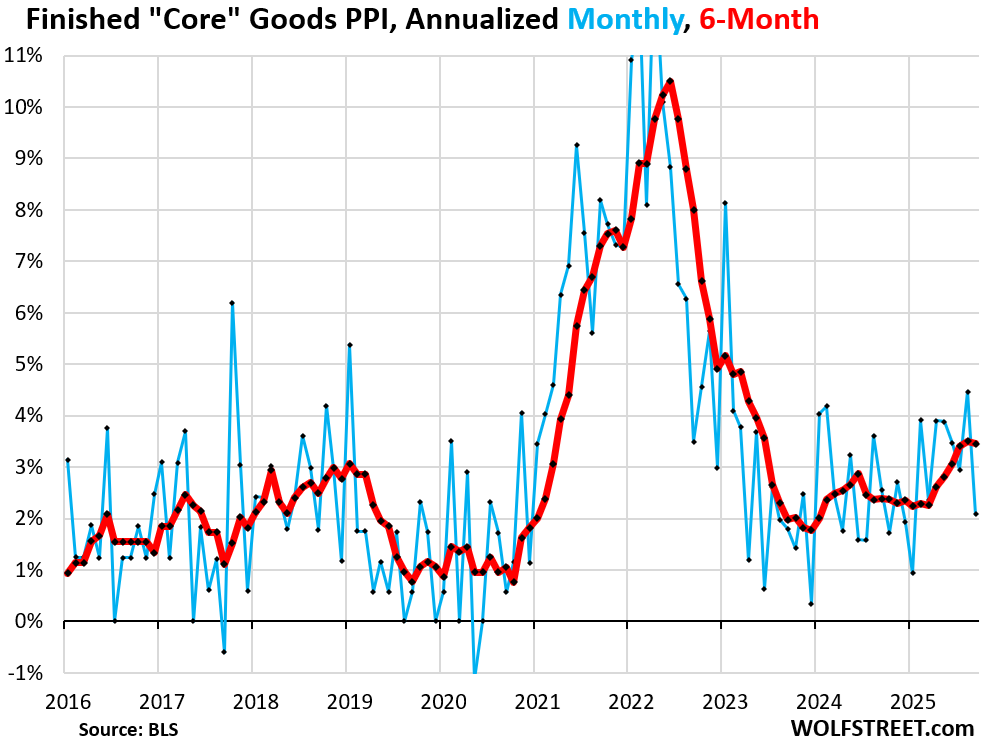
The tariffs paid by companies show up here indirectly. The PPI does not track import prices. It tracks prices that companies charge each other and thereby does not directly track the costs of tariffs that companies are paying on imported goods.
By tracking prices that companies charge each other, PPI indirectly tracks how companies distribute the tariffs amongst each other, as companies have had trouble passing them on to consumers, and consumer-facing companies have therefore resisted their suppliers’ efforts to pass on the tariffs to them.
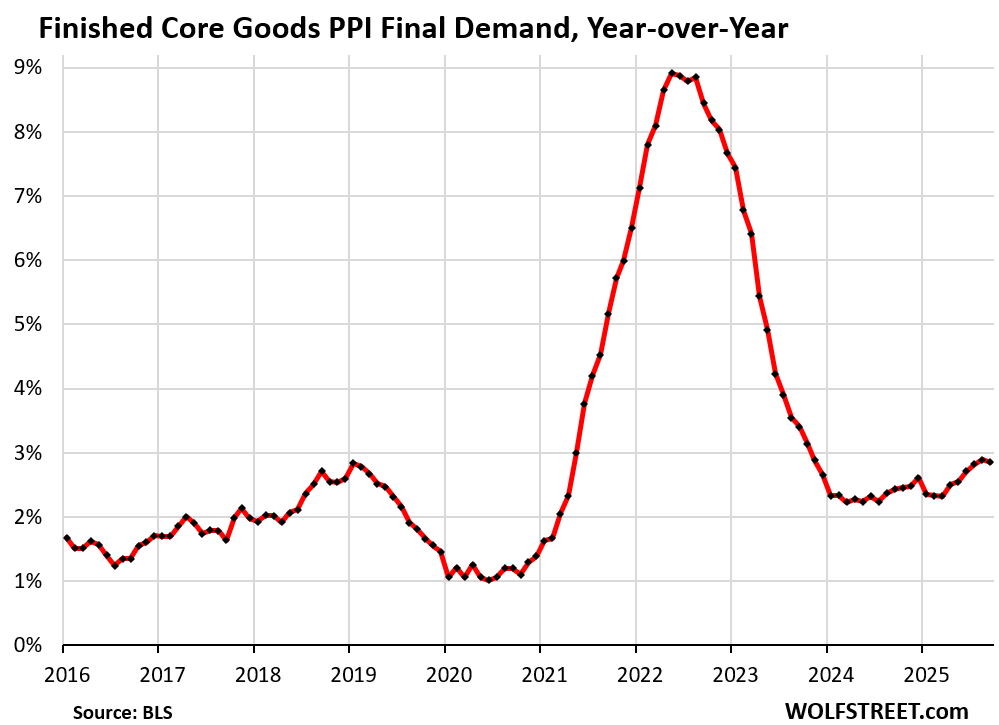
Year-over-year, the PPI for finished core goods accelerated slightly to 2.85% from the upwardly revised August reading (+2.89%).
Enjoy reading WOLF STREET and want to support it? You can donate. I appreciate it immensely. Click on the mug to find out how:

![]()
Wolf – how does PPI feed into CPI or the Core PCE gauge preferred by the FED? Is it in any way correlated?
PPI does not at all feed into CPI.
But some PPI data, such as for Financial Services, are also included in the PCE price index, which the Fed likes to look at at. But they’re not included in CPI.
PPI is not correlated month to month with CPI or the PCE price index. But over the longer term, the trends are similar.
Dow closes over 660 points higher as stocks continue rebound off November lows
DJIA +1.43%
SPX +0.91%
COMP +0.67%
RUT +2.14%
VanEck Gold Miners ETF (GDX) -0.21% (+130.38% YTD)
Jan is that you?
It priced in the same rate cut for the 10th time.
Bond market is being just as dumb. 10y back under 4%.
Buy all the things!!!!
Curious Boy: CPI and PPI are somewhat related, but they can diverge at times, such as when prices of imports rise materially, as PPI doesn’t reflect these prices, except in some indirect ways.
I believe rate of change charts do not tell the entire story.
Accumulated price increases, say for the past 5 years, reveals what people are dealing with…the rate of change incremental add ons are just “straws” on the “camel’s back”……..
“what people are dealing with”
No, no, no… people are NOT dealing with PPI. This is producer price inflation, price increases between companies. Consumers don’t pay for these goods and services. Consumers pay for consumer goods and consumer services, which have consumer price inflation, which is tracked, by the Consumer Price Index (CPI), and my CPI articles include LOTS of price level charts. All you have to do is look at them, for example:
https://wolfstreet.com/2025/10/24/food-inflation-the-price-spikes-of-beef-coffee-eggs-and-dairy/
https://wolfstreet.com/2025/09/11/cpi-inflation-dishes-up-another-nasty-surprise-as-it-tends-to-do/
I didnt make myself entirely clear.
I meant to address the accumulated inflation across the board….all of it……(not just PPI) and how it is just stacked upon stacked, compounded, snowballing…
Some refer to it as “Legacy” inflation…..that is what people are dealing with. Small changes offer little to no relief from previous inflationary “damage”.
Thanks
Yet despite this the 10-year dropped, hope for a December rate cut went up, stock market up on rate cut hopes and an average 30-year fixed conventional mortgage dropped 12-basis points per Mortgage News Daily.
Make it make sense…..
Supposedly it was because of the rumor that Trump is going to appoint Hasset for Fed chair. He’s supposedly a dove. I suspect it’s just the algos doing their thing.
If they think the Fed is not serious about inflation, watch the 10 year start to go up again.
Agree. Wish there as a blog or website that was dedicated to the analysis and discussion of the major players in the bond market. There are constant large issuers in addition to the US government, there are constant large investors like big bond funds, life insurance, hedge fund trying to make decisions. There are traders with huge inventories of bonds to buy,sell, hedge and manage. There is the huge derivatives market on rates called swap market. Collectively, they are Mr Market. And, they have to deal with Treasury demand and Sec Treasury comments. Then there is the FED nonsense, growing and contracting balance sheet under various names and programs, and all the FED speech.
I would like more information and analysis from MARKET and get plenty of info from commentators on U S Treasury and FED actions.
“yet despite this the 10 year (rate%) dropped”?
I agree. Why? Besides obvious that players demand for 10 year up and thus rate down. Would like to hear from insurance company CIO saying we bought more duration because here is what we saw, we see and we believe will soon happen.
CB
It only makes “sense” when one looks back at financial history…
Take BCCI for example….and I’m not talking about the Board of Control for Cricket in India -g-
O’s TARP? Seriously, talk about an ‘in your face’ acronym to the poor and middle class!
Canada’s TD Bank was recently caught red handed laundering Cartel $$ into the bond market.
In essence, what you ask for(clarity) will never be provided. We can only go by what Wolf provides.
I too am genuinely wondering who is buying 10 years of USG debt at <4% (and in what amounts).
Who was the genius that some time back said ‘transitory’ (or temporary) inflation. Was she yelling (😏) or something? Anyway, i hope the person who brought up that concept didn’t win the Nobel prize in economics.
One side we have all trends where CPI & PCE is going up or staying around 3% range while Target is 2%. Other side, we have FOMC doves coming out to protect Wall St. I can understand 50BP cuts as Insurance for labor market turning weak.
Till last Friday, Markets had reduced rate cut expectations (FedWatch 30%)
Then Powell sent his Deputy John Williams to tell us expect another cut in December. After that its like 80-90% now. Based on FOMC members speeches, only 3-4 voting members opposing additional cut. I am sure 1-2 of them will fold and vote whatever Powell says. So expect another cut in December meeting.
FED to STOP QT in December and do another cut. Isn’t that nice Xmas for Wall St. Whole argument about Support Labor market by doing another 25 BP cut is BS. The companies doing layoffs are not cash starved. They are spending Billions in AI. So this 25BP cut doesnt help Labor market.
Real People are suffering in Services and daily life necessities.
I hate this Dovish FOMC. But reality where FED is catering to Wall St more than American People who they claim to serve.
“But reality where FED is catering to Wall St more than American People who they claim to serve.”
The game of cutting rates to help main street, to address unemployment…..the cutting has little effect on the advertised targets….but ramps up the net worth of the asset holders. Clever.
What cuts will reverse these latest layoffs, layoffs due more to other factors than what are described as “restrictive” rates? How can rates this LOW be called restrictive?
“PPI Inflation Bounces Back”
Sounds like a perfect reason for a rate cut. Is Powell still sniffing glue, or is that the President’s behind he’s got his nose into?
Hi Wolf,
Possible typo? Or, maybe I misunderstand the calculation:
‘ by 3.5% (+51% annualized) ‘.
Best wishes to you.
Thank you for all your proofreading behind the scenes over the years! Highly appreciated!
In this case, the calculation is correct. “Annualized” shows what would happen in an entire year if the month-to-month increase (+3.5%) continues for 12 months. This is obviously not going to happen, but that’s what annualized means. A 3.5% month-to-month increase is huge.
“Energy prices exploded by 3.5% (+51% annualized), after a drop in the prior month.”
Month 0: $100
Month 1: $100 + 3.5% x $100 = $103.50
Month 2: $103.50 + 3.5% x 103.5 = $107.12
Month 3: $107.12 + 3.5% x 107.12 = $110.87
…
Month 12: $146.00 + 3.5% x 146.00 = $151.11
So if for 12 months, the month-to-month increase is 3.5%, the total increases from $100 to $151, so by 51%. You can do this on a spreadsheet, but there’s actually a handy-dandy formula for annualizations.
Thanks for taking the time to explain that, now I understand.
I learn a lot here!