Prices fell year-over-year in 22 of the 33 metros. In 9 of the 33, prices rose to new highs.
By Wolf Richter for WOLF STREET.
Prices of mid-tier homes in October declined year-over-year in 22 of the 33 large and expensive metropolitan statistical areas (MSAs) that we track here, up from 6 at the end of 2024. In those metros there is lots of supply.
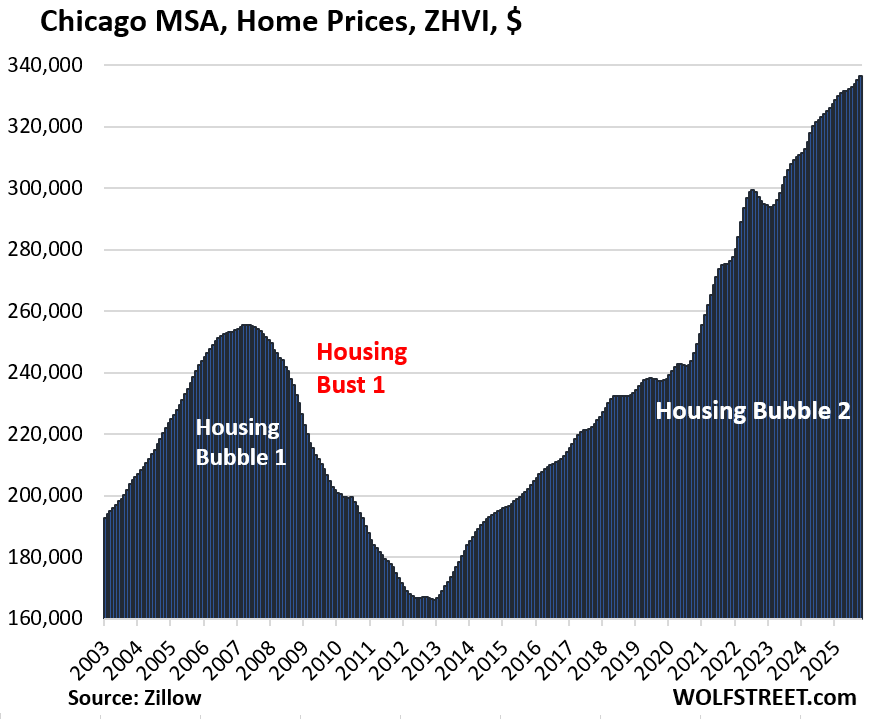
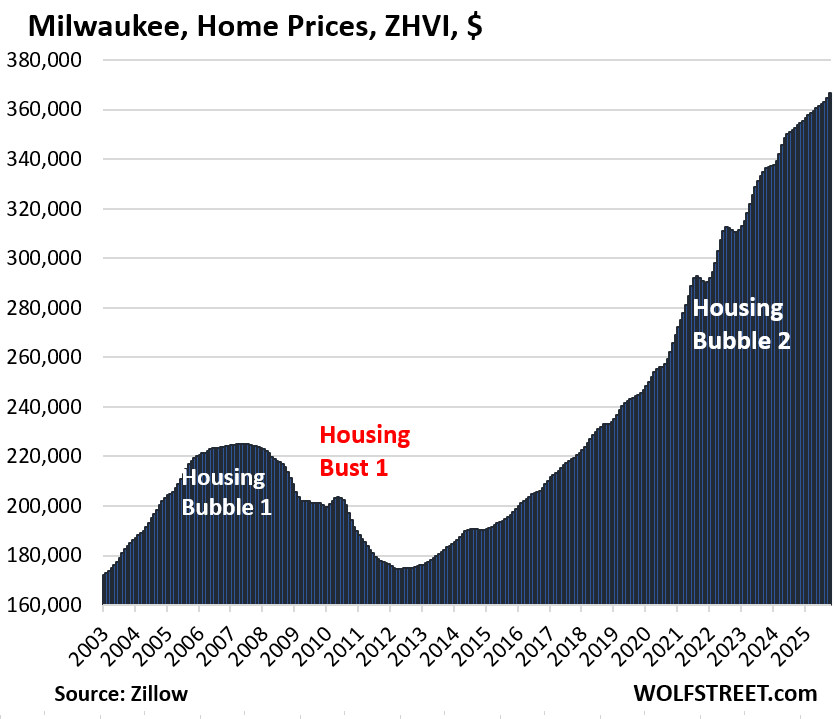
In 9 of our 33 MSAs here, prices rose to new records amid tight supply. The top two MSAs where prices rose the most year-over-year were the Milwaukee MSA (Milwaukee-Waukesha-West Allis, WI) at +3.7% and the Chicago MSA (Chicago-Naperville-Elgin, IL-IN) at +3.6%.
MSAs are Census Bureau designated large urban areas with multiple cities. Here, they’re named by the largest city in the MSA.
To qualify for the 33 most splendid housing bubbles, the MSA must be one of the largest by population and must have had home prices of at least $300,000 at some point. Some metros that are large enough don’t qualify for this list because home prices never reached $300,000, despite the blistering surge of home prices in recent years, such as the metros of New Orleans, Memphis, Oklahoma City, Tulsa, Cincinnati, and Pittsburgh.
Prices declined year-over-year in 22 of our 33 MSAs in October:
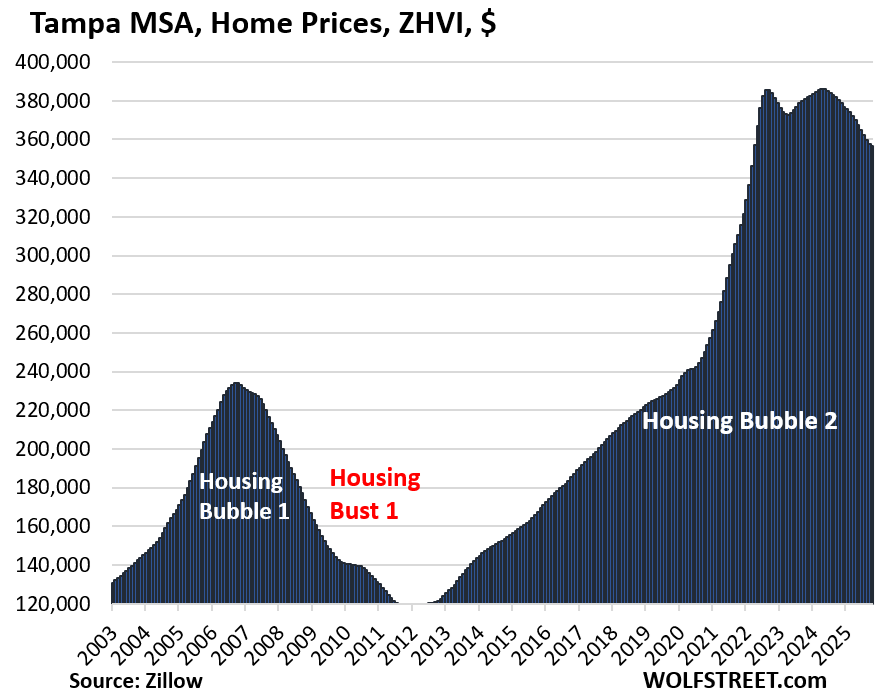
- Tampa, FL: -6.3%
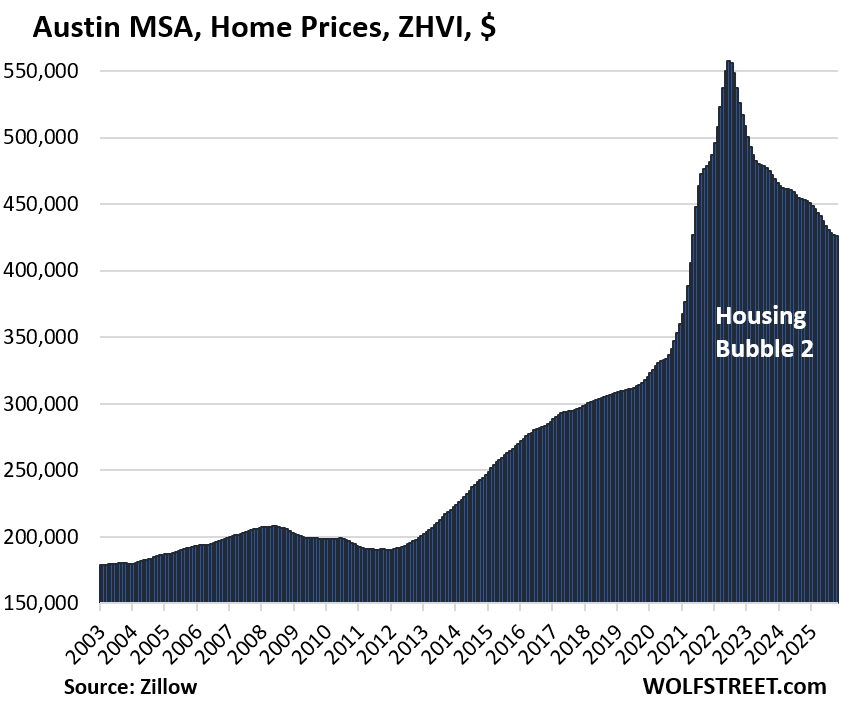
- Austin, TX: -6.0%
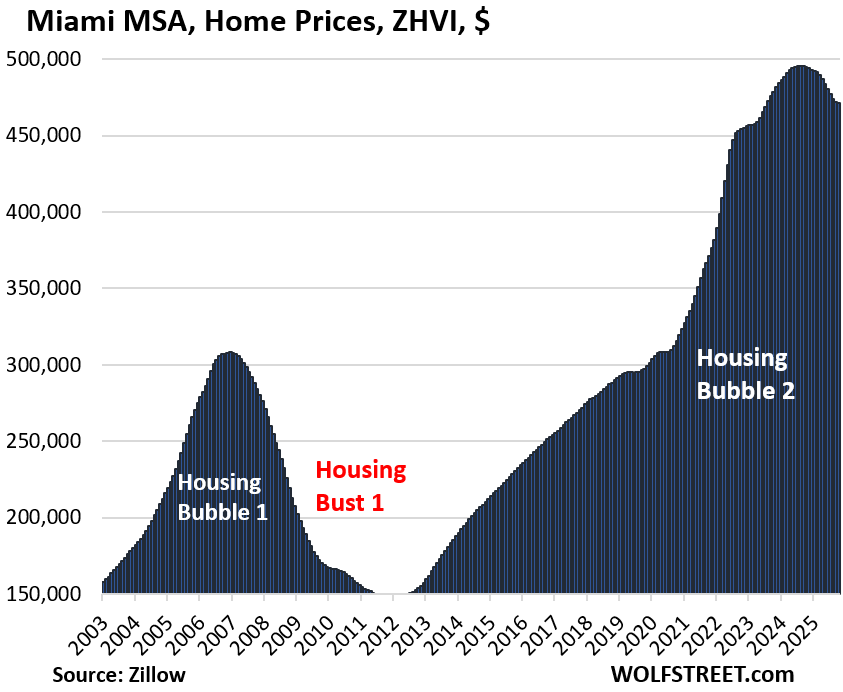
- Miami, FL: -4.8%
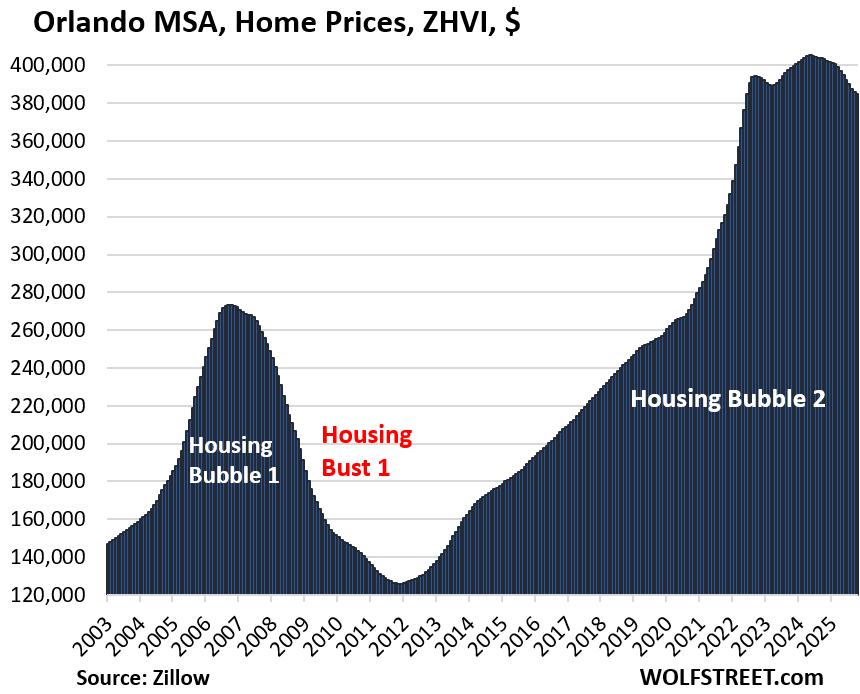
- Orlando, FL: -4.5%
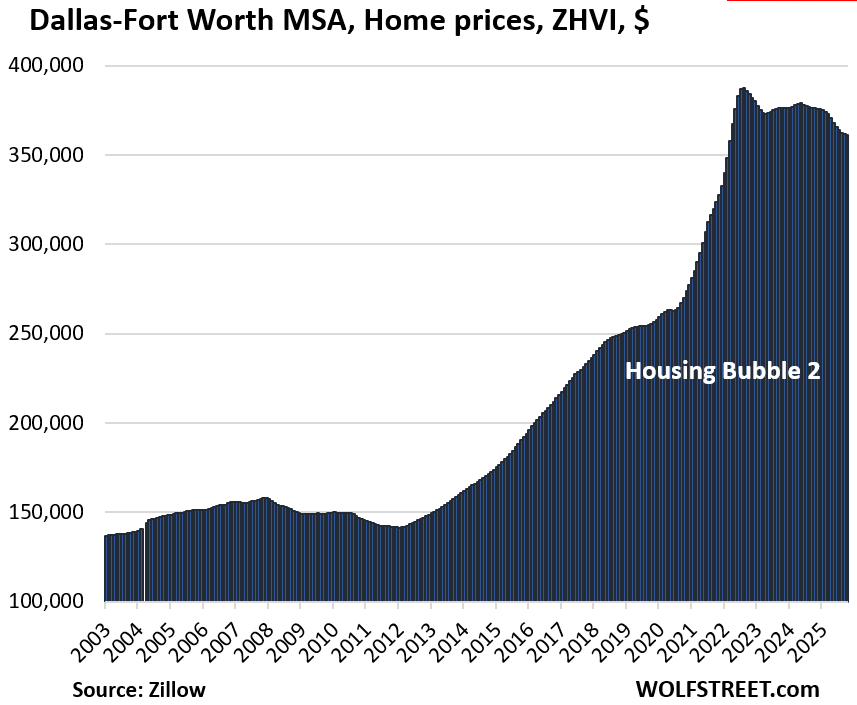
- Dallas, TX: -4.0%
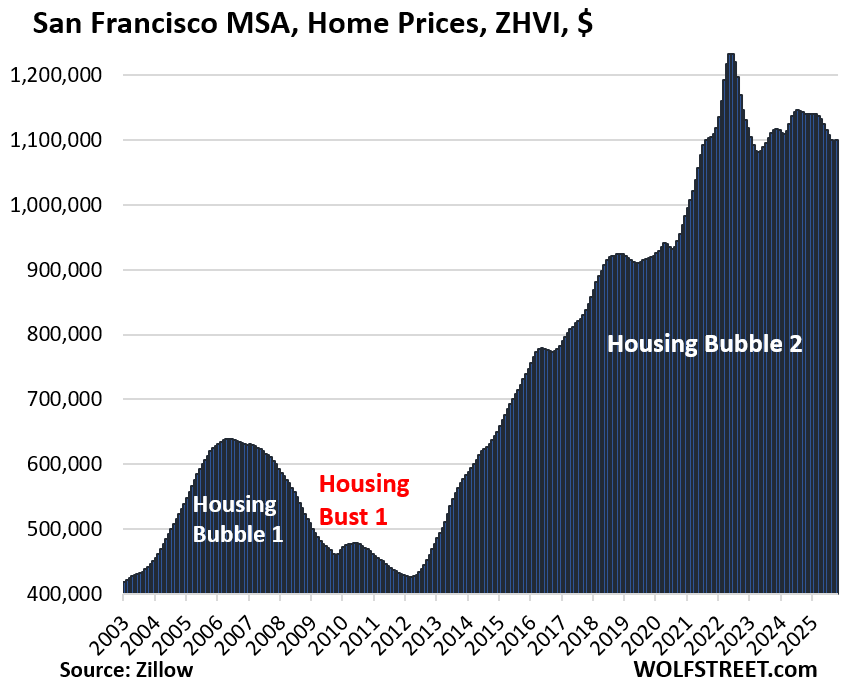
- San Francisco, CA: -3.5%
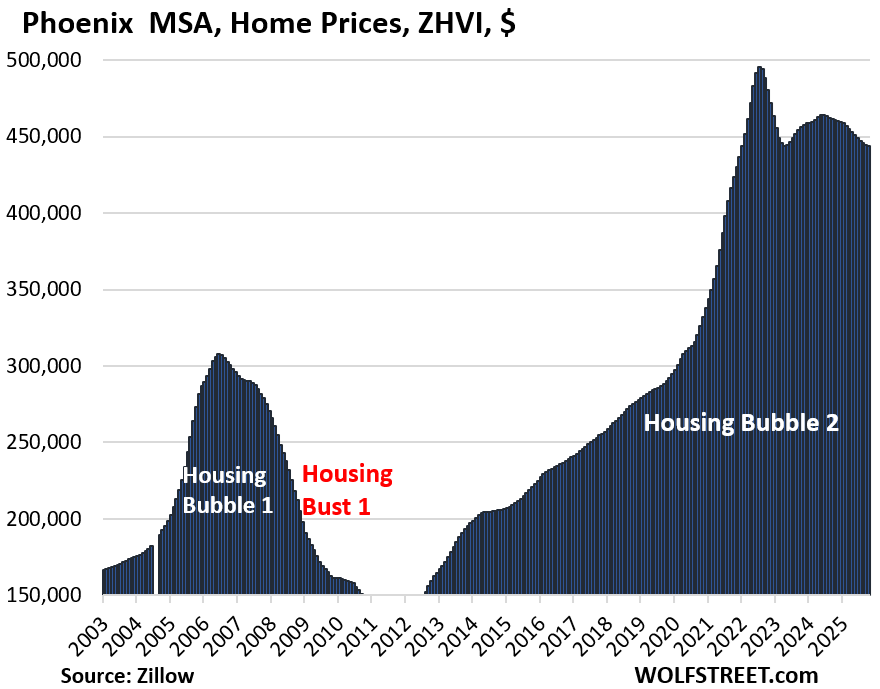
- Phoenix, AZ: -3.6%
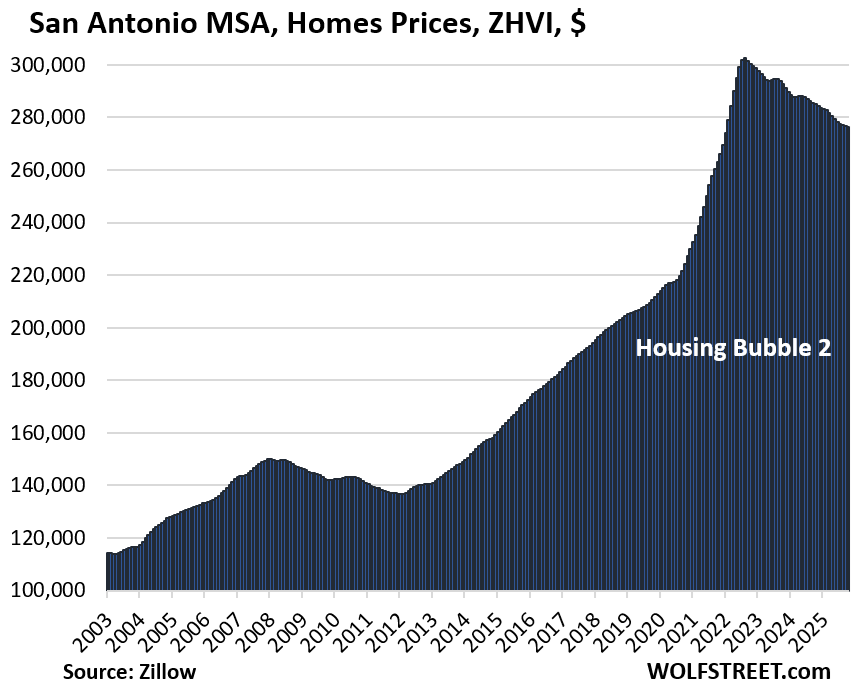
- San Antonio, TX: -3.1%
- Atlanta, GA: -3.0%
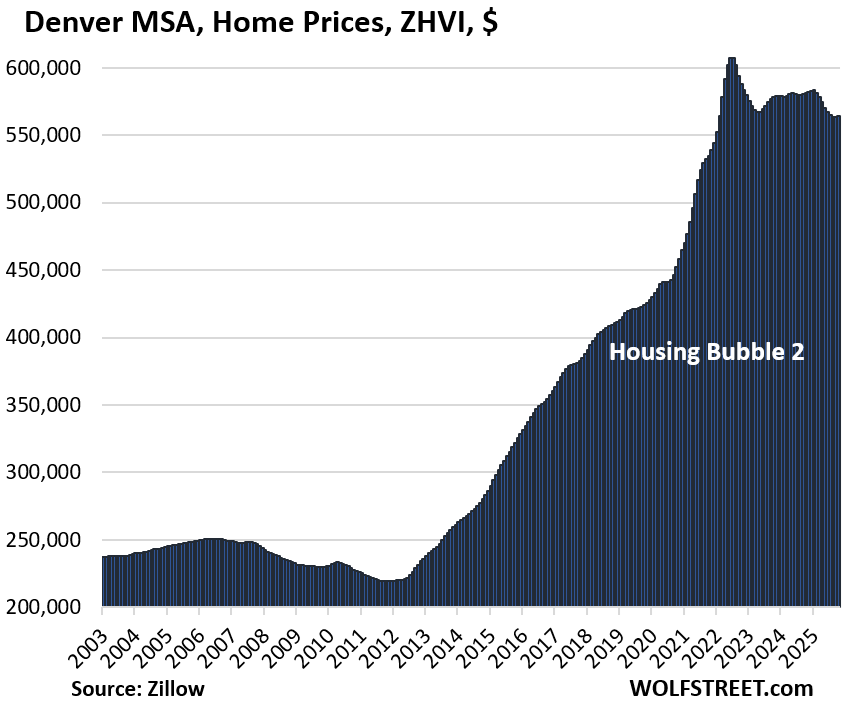
- Denver, CO: -3.0%
- San Diego, CA: -2.6%
- Raleigh, NC: -2.5%
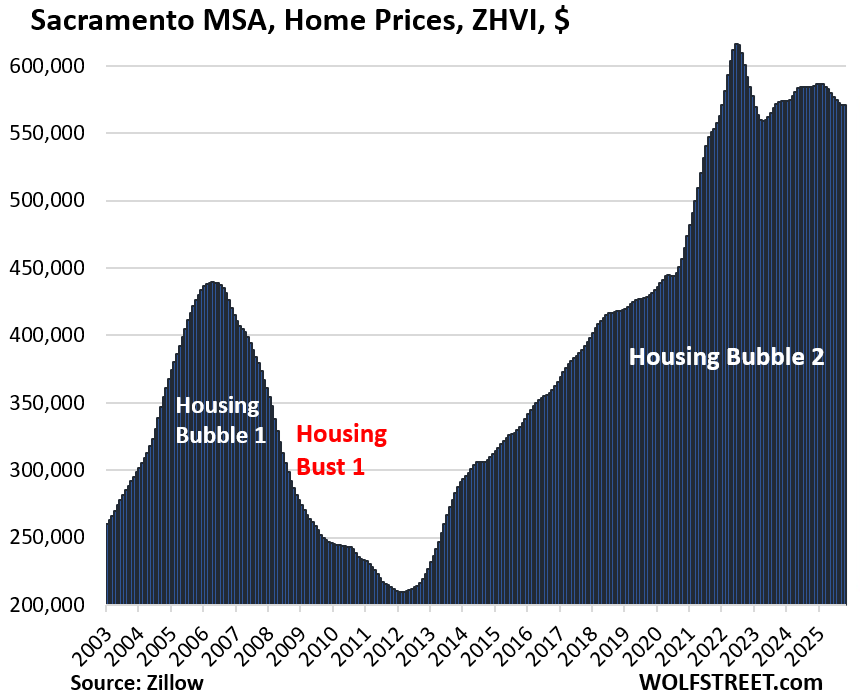
- Sacramento, CA: -2.3%
- Houston, TX: -2.1%
- San Jose, CA: -2.1%
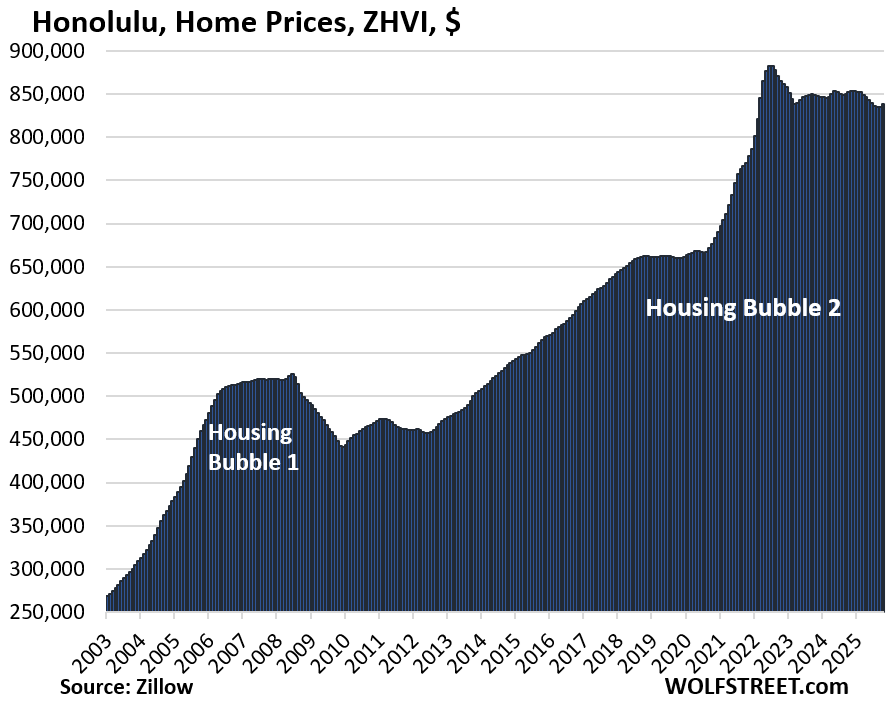
- Honolulu, HI: -1.6%
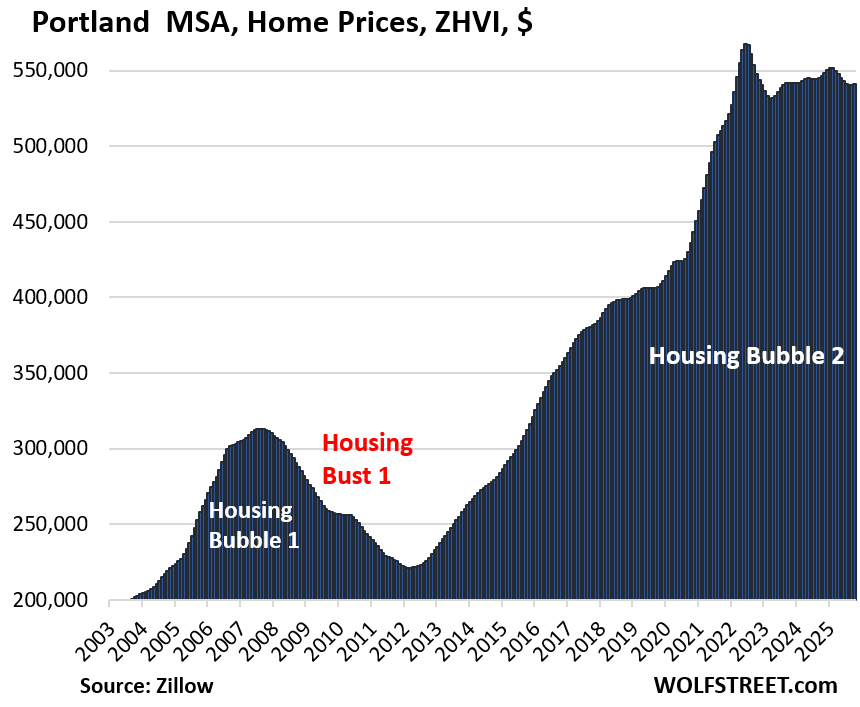
- Portland, OR: -1.0%
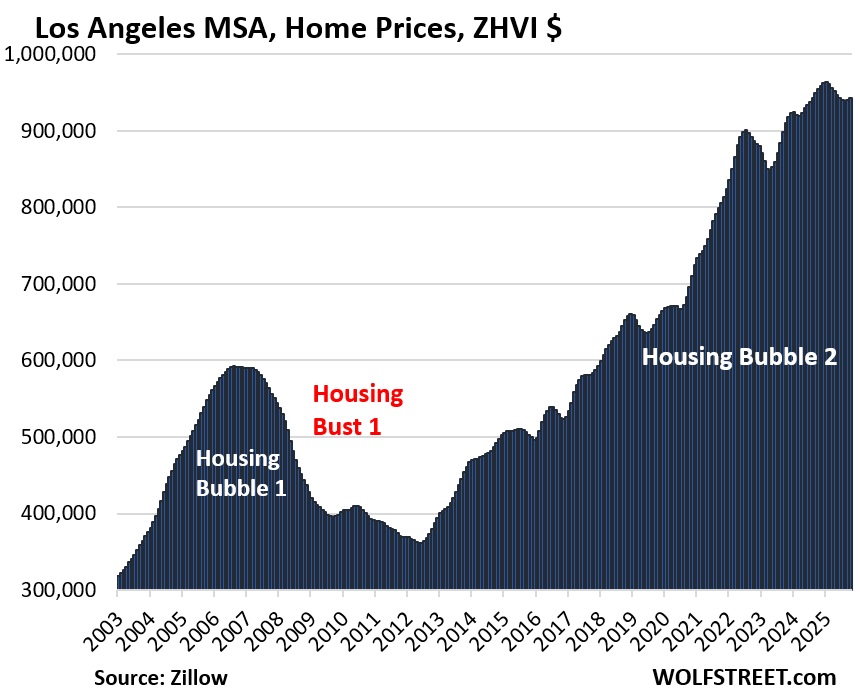
- Los Angeles, CA: -1.2%
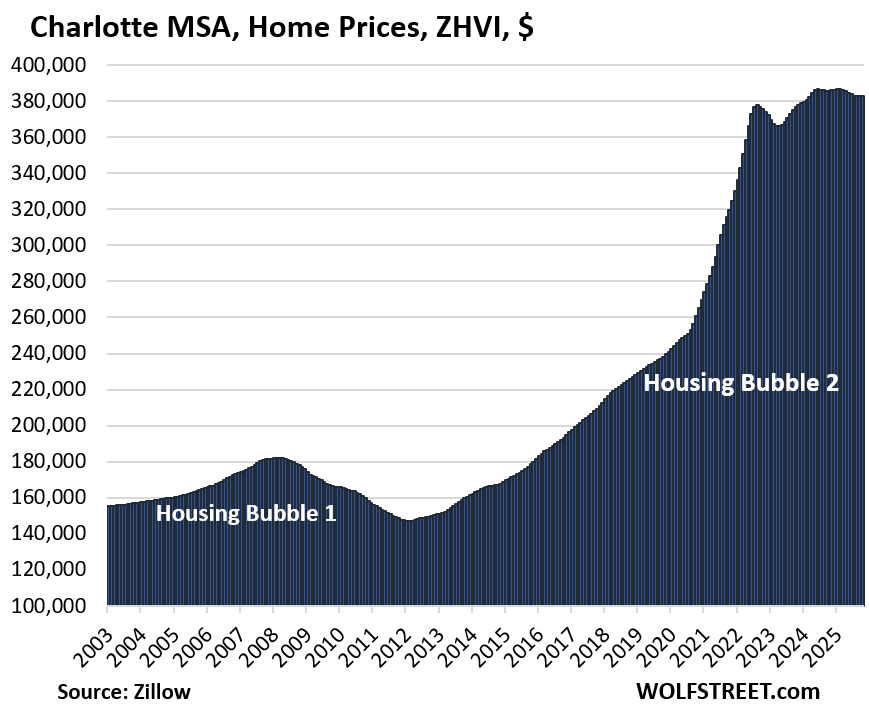
- Charlotte, NC: -0.7%
- Seattle, WA: -1.0%
- Las Vegas, NV: -1.1%
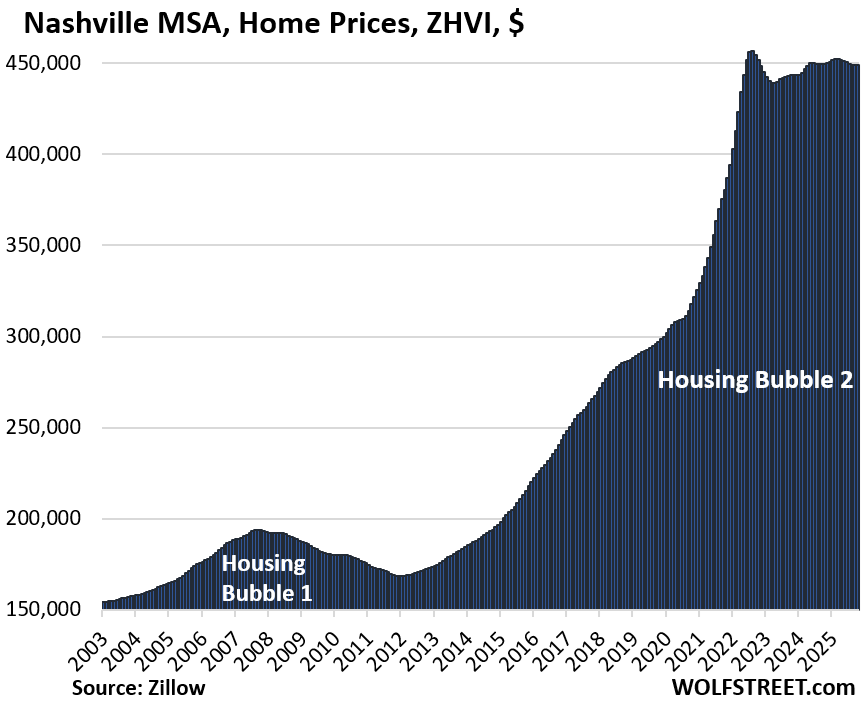
- Nashville, TN: -0.1%
Prices were down from their highs in prior years in 23 of the 33 metros.
Prices were down from their peaks in 2022, 2023, or 2024 in 23 of our 33 metros, amid ballooning supply and low demand. The top entry among the 33 metros was the Austin MSA (Austin-Round Rock-San Marcos, TX), where prices of mid-tier homes have plunged by 23.6% since mid-2022.
Of the 33 MSAs here, 17 experienced their peaks in 2022; Atlanta’s was in 2023, and the peaks of 5 (Miami, San Diego, Charlotte, San Jose, Los Angeles) were in 2024:
Percentage declines from their respective peaks in prior years:
- Austin, TX: -23.6%
- San Francisco: -10.8%
- Phoenix: -10.4%
- San Antonio: -8.7%
- Denver: -7.1%
- Sacramento: -7.3%
- Tampa: -7.5%
- Dallas: -6.8%
- Honolulu: -5.0%
- Portland: -4.7%
- Orlando: -5.0%
- Miami: -4.9% (2024 peak)
- San Jose: -3.9% (2024 peak)
- Seattle: -3.7%
- Raleigh: -3.8%
- Atlanta: -3.3% (2023 peak)
- Salt Lake City: -2.6%
- Houston: -3.1%
- San Diego: -2.8% (2024 peak)
- Las Vegas: -3.0%
- Los Angeles: -2.2% (2024 peak)
- Nashville: -1.7%
- Charlotte: -0.9% (2024 peak)
Methodology: All pricing data here for the 33 metropolitan statistical areas (MSA) is from the seasonally adjusted three-month-average mid-tier Zillow Home Value Index (ZHVI), released today. The ZHVI is based on millions of data points in Zillow’s “Database of All Homes,” including from public records (tax data), MLS, brokerages, local Realtor Associations, real-estate agents, and households across the US. It includes pricing data for off-market deals and for-sale-by-owner deals. Zillow’s Database of All Homes also has sales-pairs data.
The 33 Most Splendid Housing Bubbles.
In the little tables, MoM = month over month; YoY = year-over-year. In the column furthest to the right: the percentage increase “since 2000.”
| Austin MSA, Home Prices | |||
| From Jun 2022 peak | MoM | YoY | Since 2000 |
| -23.6% | -0.2% | -6.0% | 147% |
Lowest since April 2021. Prices in the Austin-Round Rock-San Marcos MSA had exploded by 73% from January 2020 through June 2022. And some of that crazy price explosion has now gotten unwound:
| San Francisco MSA, Home Prices | |||
| From May 2022 peak | MoM | YoY | Since 2000 |
| -10.8% | 0.1% | -3.5% | 282% |
Back to August 2021. From January 2020 through June 2022, prices exploded by 33%.
The San Francisco-Oakland-Fremont metro includes San Francisco, much of the East Bay (such as Oakland), much of the North Bay, and goes south on the Peninsula into Silicon Valley through San Mateo County. It does not include the San Jose metro, which covers the southern portion of the Bay Area.
| Phoenix MSA, Home Prices | |||
| From Jun 2022 peak | MoM | YoY | Since 2000 |
| -10.4% | -0.1% | -3.6% | 211% |
Back to January 2022. Prices exploded by 65% from January 2020 through June 2022.
| San Antonio MSA, Home Prices | |||
| From Jul 2022 peak | MoM | YoY | Since 2000 |
| -8.7% | -0.1% | -3.1% | 143% |
| Tampa MSA, Home Prices | |||
| From Jul 2022 peak | MoM | YoY | Since 2000 |
| -7.5% | -0.3% | -6.3% | 252% |
Prices exploded by 60% between January 2020 and June 2022.
| Sacramento MSA, Home Prices | |||
| From July 2022 peak | MoM | YoY | Since 2000 |
| -7.3% | 0.0% | -2.3% | 239.1% |
| Denver MSA, Home Prices | |||
| From Jun 2022 peak | MoM | YoY | Since 2000 |
| -7.1% | 0.1% | -3.0% | 203% |
| Dallas-Fort Worth MSA, Home Prices | |||
| From Jun 2022 peak | MoM | YoY | Since 2000 |
| -6.8% | -0.1% | -4.0% | 184% |
| Orlando MSA, Home Prices | |||
| From June 2022 | MoM | YoY | Since 2000 |
| -5.0% | -0.3% | -4.5% | 223% |
Prices exploded by 48% between January 2020 and June 2022.
| Honolulu, Home Prices | |||
| From Jun 2022 peak | MoM | YoY | Since 2000 |
| -5.0% | 0.4% | -1.6% | 277% |
| Miami MSA, Home Prices | |||
| From Sep 2024 peak | MoM | YoY | Since 2000 |
| -4.9% | -0.2% | -4.8% | 312% |
| Portland MSA, Home Prices | |||
| From May 2022 peak | MoM | YoY | Since 2000 |
| -4.7% | 0.1% | -1.0% | 213% |
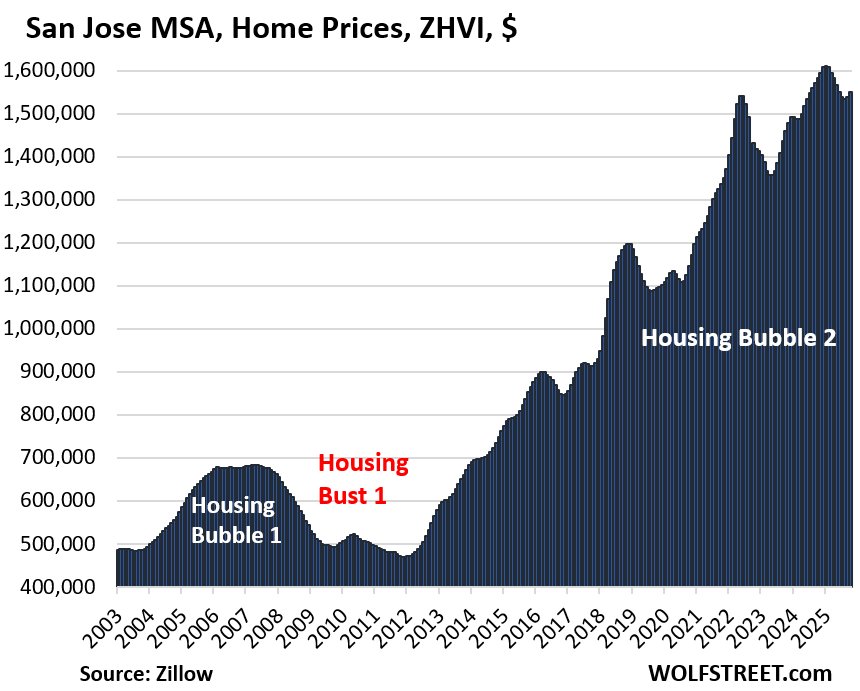
| San Jose MSA, Home Prices | |||
| Fr Dec 2024 high | MoM | YoY | Since 2000 |
| -3.9% | 0.7% | -2.1% | 331% |
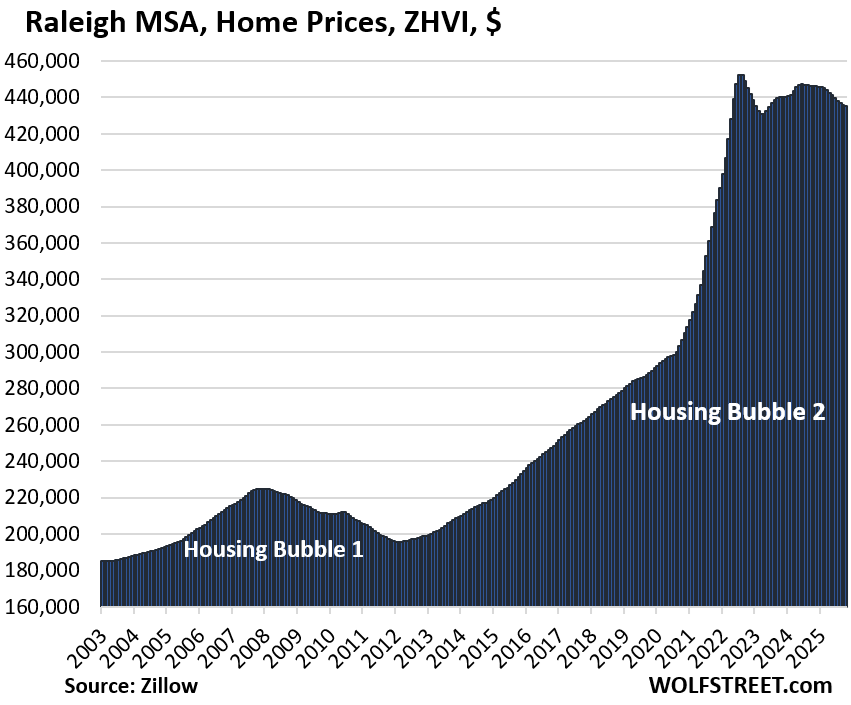
| Raleigh MSA, Home Prices | |||
| From July 2022 peak | MoM | YoY | Since 2000 |
| -3.8% | -0.1% | -2.5% | 152% |
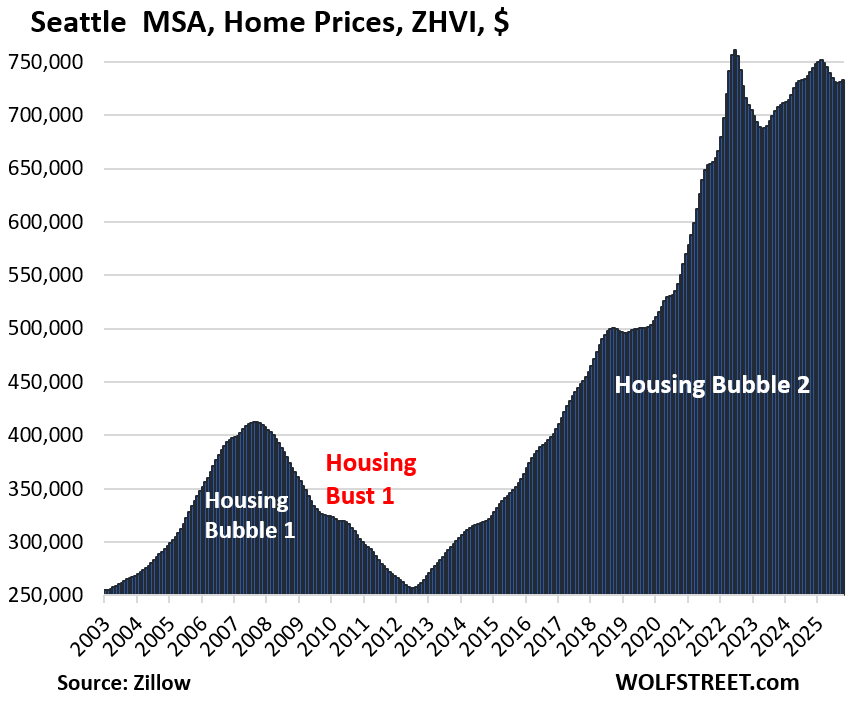
| Seattle MSA, Home Prices | |||
| From May 2022 peak | MoM | YoY | Since 2000 |
| -3.7% | 0.3% | -1.0% | 233% |
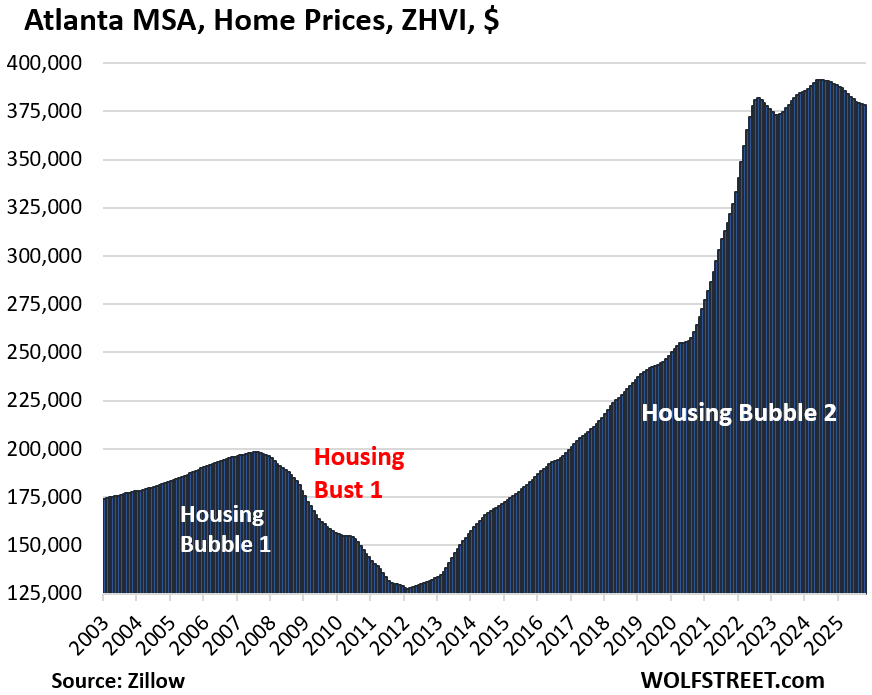
| Atlanta MSA, Home Prices | |||
| From July 2022 | MoM | YoY | Since 2000 |
| -3.3% | -0.1% | -3.0% | 155% |
Prices exploded 51% between January 2020 and June 2022.
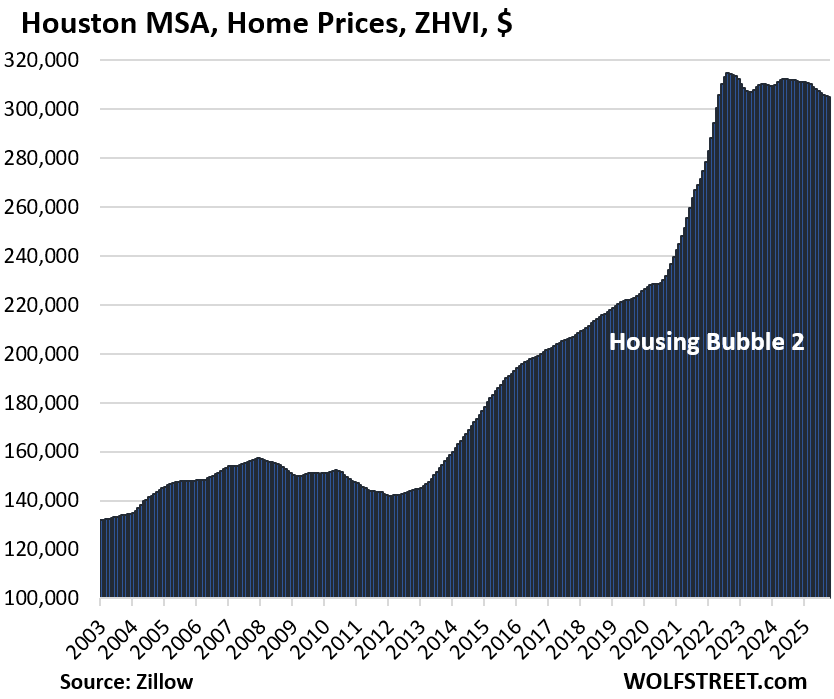
| Houston MSA, Home Prices | |||
| From Jul 2022 peak | MoM | YoY | Since 2000 |
| -3.1% | -0.1% | -2.1% | 147% |
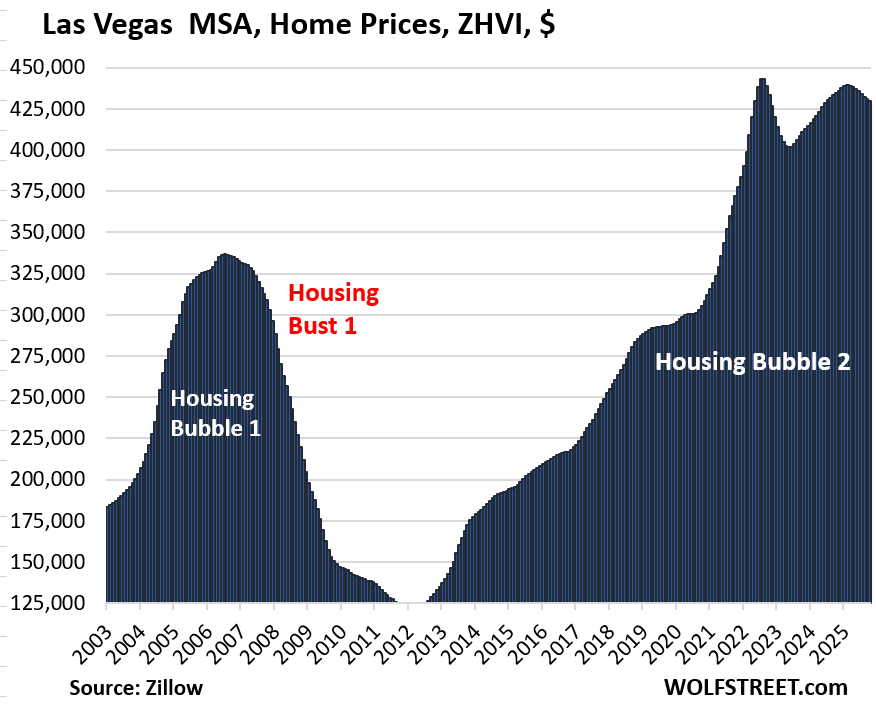
| Las Vegas MSA, Home Prices | |||
| From June 2022 peak | MoM | YoY | Since 2000 |
| -3.0% | -0.2% | -1.1% | 177% |
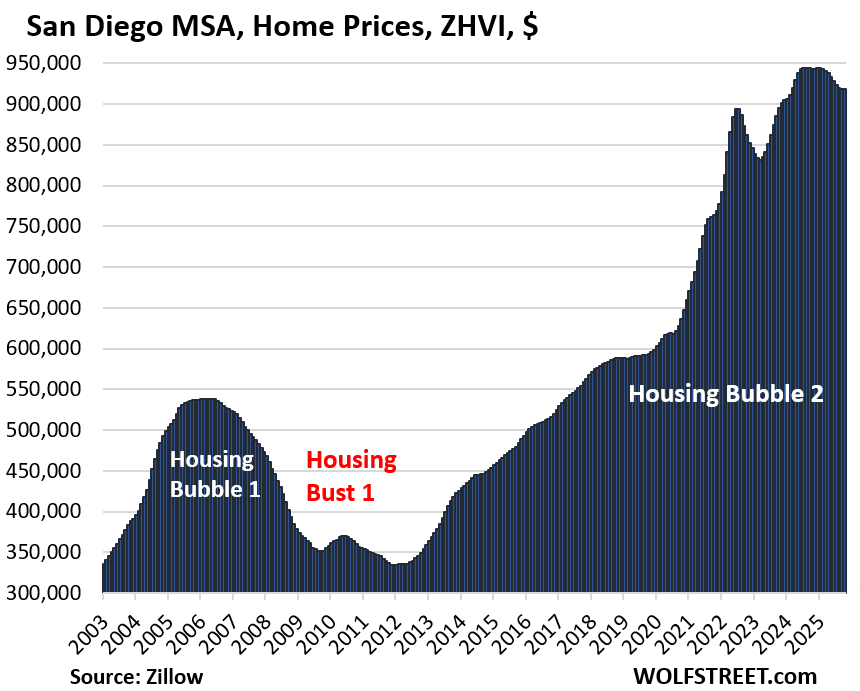
| San Diego MSA, Home Prices | |||
| Fr Jul 2024 peak | MoM | YoY | Since 2000 |
| -2.8% | 0.0% | -2.6% | 327% |
Prices exploded by 53% between January 2020 and June 2022.
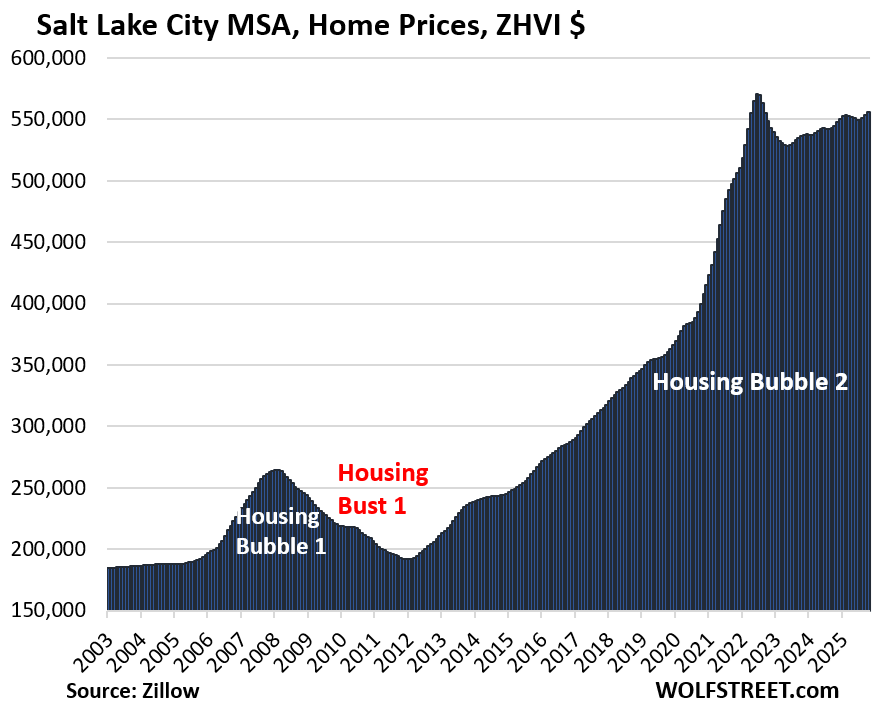
| Salt Lake City MSA, Home Prices | |||
| From July 2022 peak | MoM | YoY | Since 2000 |
| -2.6% | 0.5% | 2.1% | 218% |
| Los Angeles MSA, Home Prices | |||
| Fr Dec 2024 high | MoM | YoY | Since 2000 |
| -2.2% | 0.3% | -1.2% | 326% |
| Charlotte MSA, Home Prices | |||
| Fr May 2024 peak | MoM | YoY | Since 2000 |
| -0.9% | 0.1% | -0.7% | 166% |
Prices exploded by 54% between January 2020 and June 2022.
| Nashville MSA, Home Prices | |||
| From July 2022 peak | MoM | YoY | Since 2000 |
| -1.7% | 0.0% | -0.1% | 215% |
Prices exploded by 50% between January 2020 and June 2022.
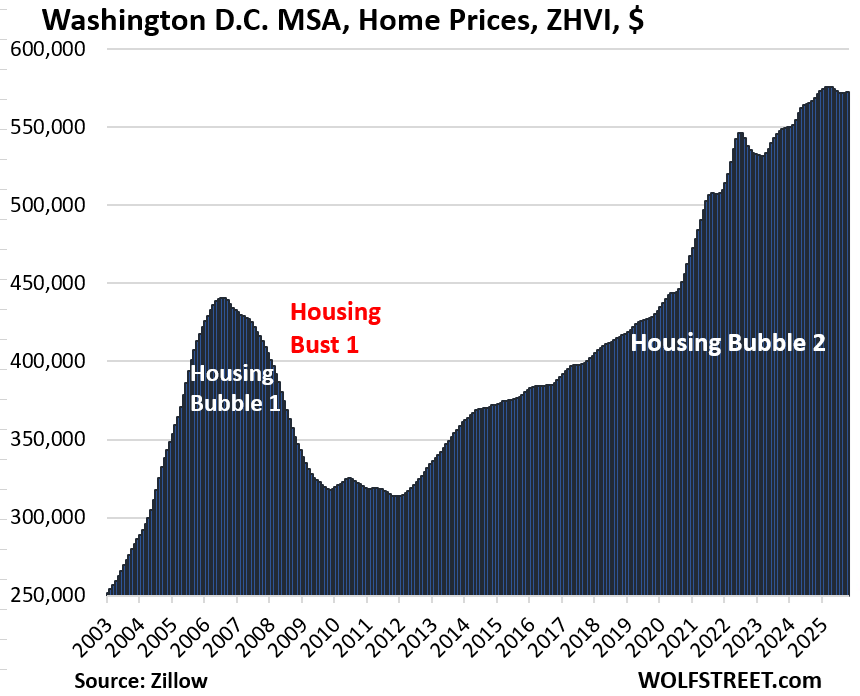
| Washington D.C. MSA, Home Prices | ||
| MoM | YoY | Since 2000 |
| 0.1% | 0.6% | 217% |
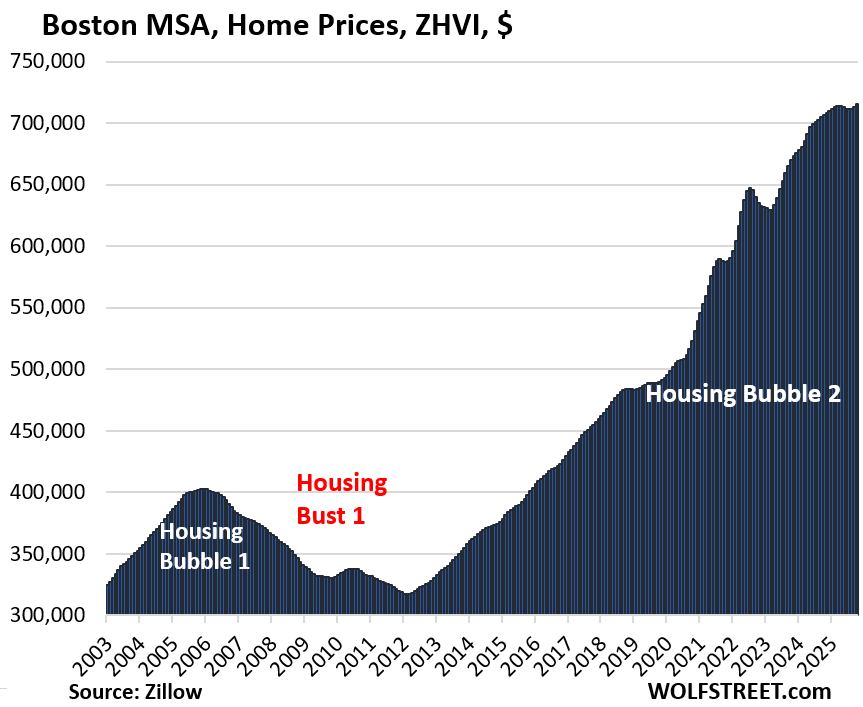
| Boston MSA, Home Prices | ||
| MoM | YoY | Since 2000 |
| 0.4% | 1.2% | 227% |
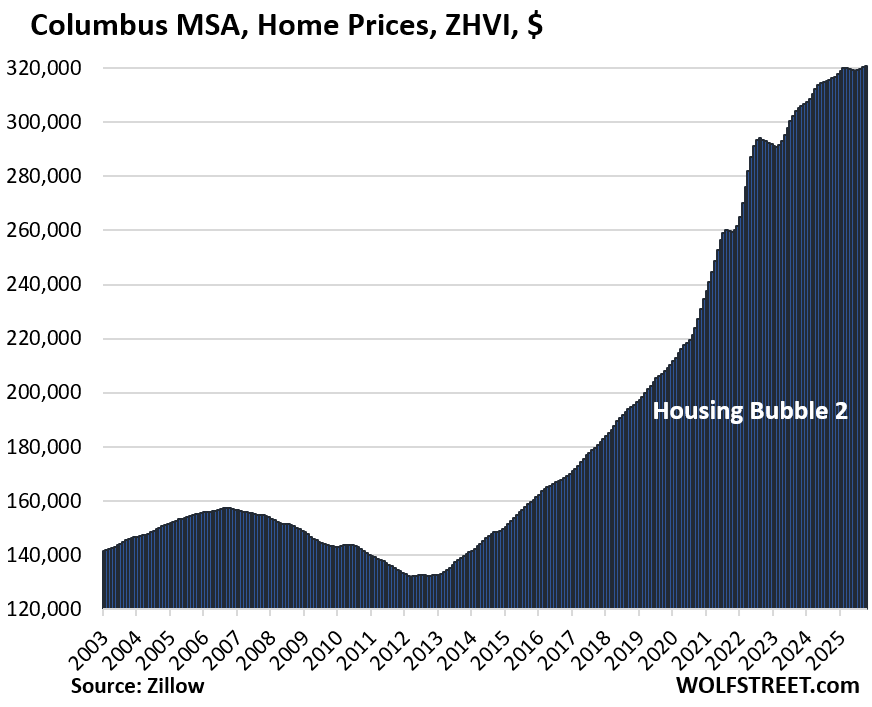
| Columbus MSA, Home Prices | ||
| MoM | YoY | Since 2000 |
| 0.2% | 1.4% | 156% |
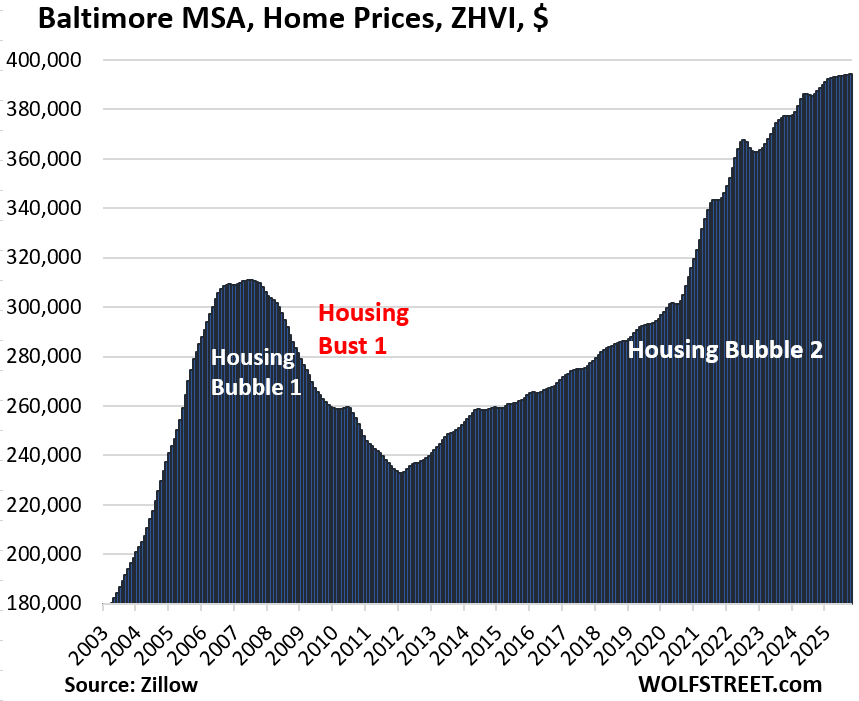
| Baltimore MSA, Home Prices | |||
| MoM | YoY | Since 2000 | |
| 0.0% | 1.8% | 178% | |
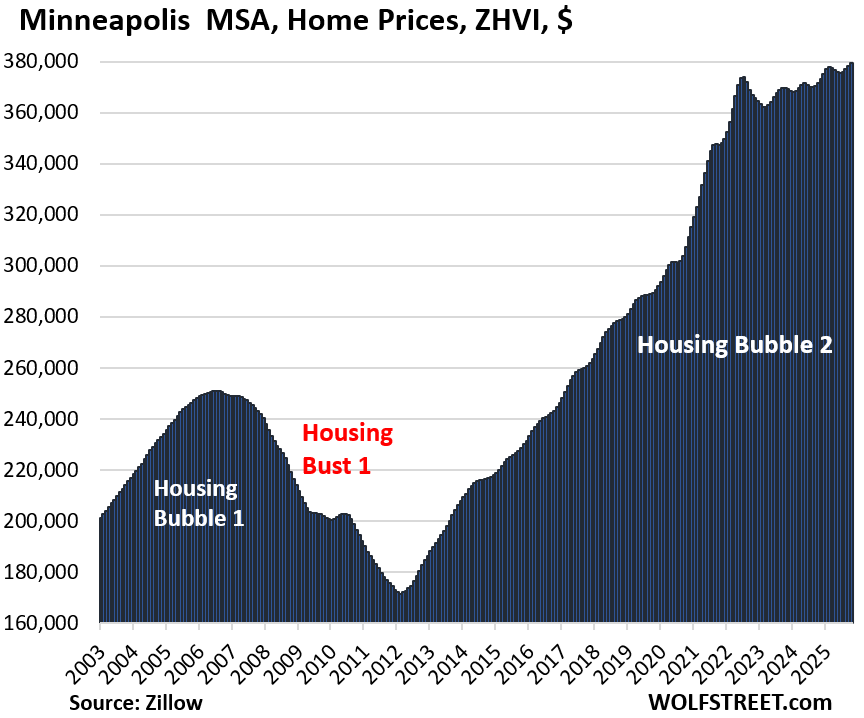
| Minneapolis MSA, Home Prices | ||
| MoM | YoY | Since 2000 |
| 0.3% | 2.1% | 161% |
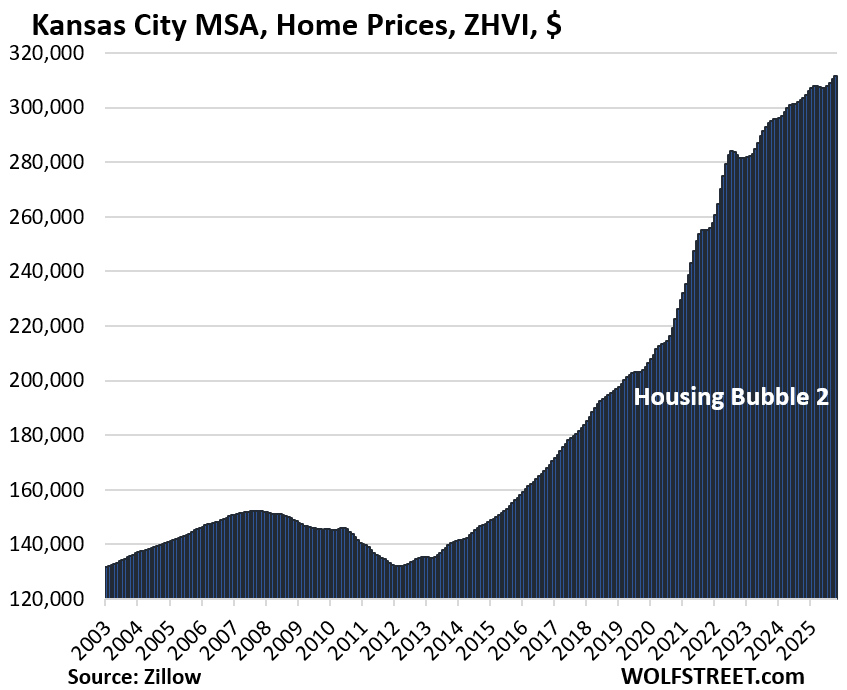
| Kansas City MSA, Home Prices | ||
| MoM | YoY | Since 2000 |
| 0.4% | 2.6% | 181% |
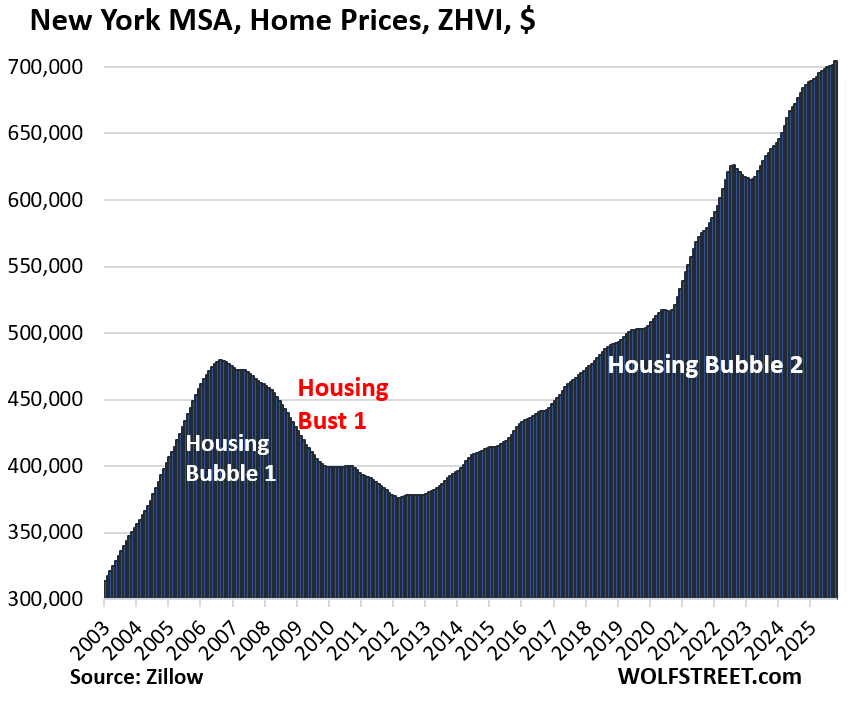
| New York MSA, Home Prices | ||
| MoM | YoY | Since 2000 |
| 0.3% | 2.9% | 221% |
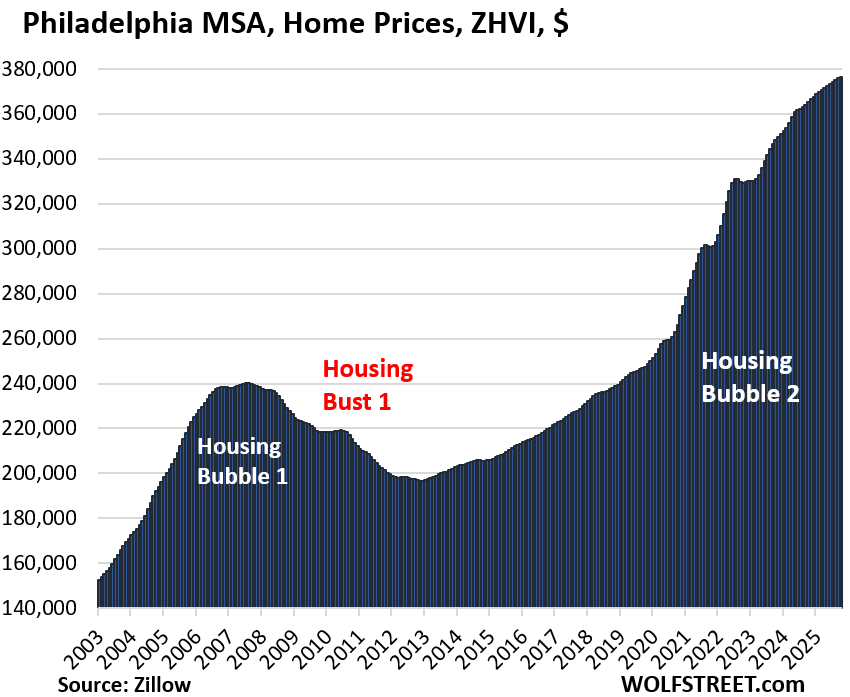
| Philadelphia MSA, Home Prices | ||
| MoM | YoY | Since 2000 |
| 0.1% | 3.0% | 209% |
| Chicago MSA, Home Prices | ||
| MoM | YoY | Since 2000 |
| 0.4% | 3.6% | 119% |
| Milwaukee MSA, Home Prices | ||
| MoM | YoY | Since 2000 |
| 0.6% | 3.7% | 153.1% |
And in case you missed it:
Enjoy reading WOLF STREET and want to support it? You can donate. I appreciate it immensely. Click on the mug to find out how:

![]()
SF Bay Area:
From 400K in 2013 to peak 1.2M and 1.05M doesnt mean much. We need deep correction in order to bring some sanity. FAANG & major tech stocks have sky rocketed, those valuations have been supporting those crazy prices.
But good thing is last 2 years, overbidding craziness have come down and house sitting much longer on markets. Hope Buyers continue to show restrain and not get into FOMO.
If you look city by city, it’s a little different. Here is one Bay Area city:
Seeing these numbers is depressing. I have to wonder when we’ll get some major movement outside of a few outlier cities.
Feels like the saying “the market can stay irrational longer than you can stay solvent”. If it takes 10 years to come down it doesn’t help anyone much. But I guess that’s the feds goal, they don’t want to fix their mistake.
Interest rates are coming down and FOMO buyers are lined up.