Prices fell year-over-year in 22 of the 33 metros. In 9 of the 33, prices rose to new highs.
By Wolf Richter for WOLF STREET.
Prices of mid-tier homes in October declined year-over-year in 22 of the 33 large and expensive metropolitan statistical areas (MSAs) that we track here, up from 6 at the end of 2024. In those metros there is lots of supply.
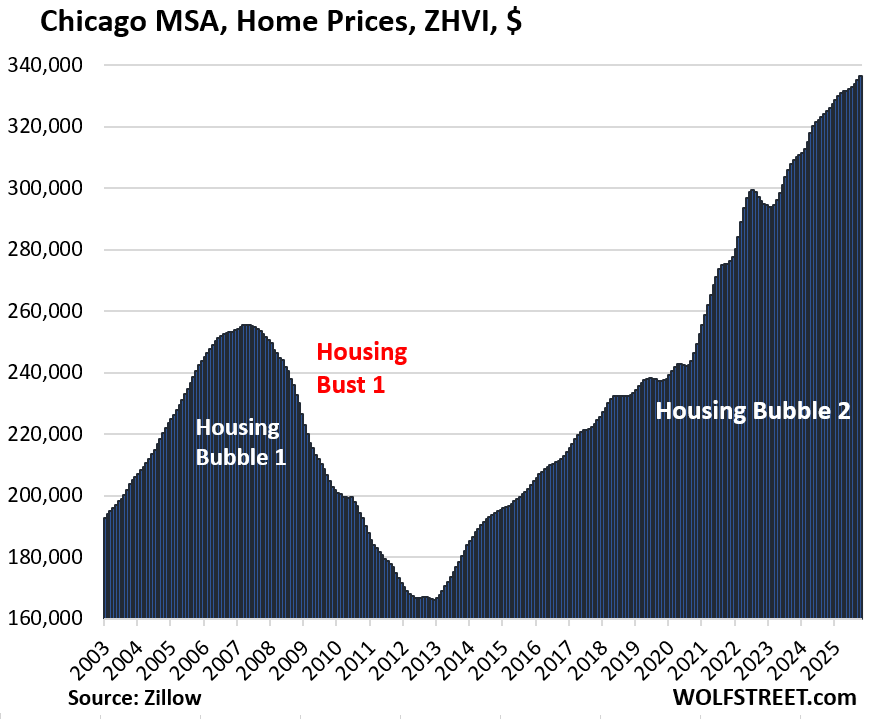
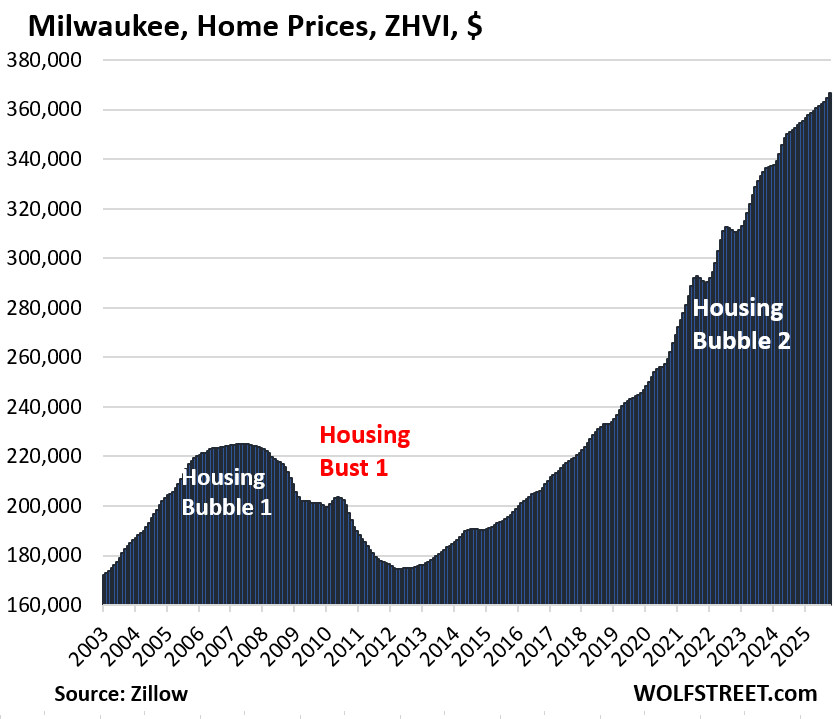
In 9 of our 33 MSAs here, prices rose to new records amid tight supply. The top two MSAs where prices rose the most year-over-year were the Milwaukee MSA (Milwaukee-Waukesha-West Allis, WI) at +3.7% and the Chicago MSA (Chicago-Naperville-Elgin, IL-IN) at +3.6%.
MSAs are Census Bureau designated large urban areas with multiple cities. Here, they’re named by the largest city in the MSA.
To qualify for the 33 most splendid housing bubbles, the MSA must be one of the largest by population and must have had home prices of at least $300,000 at some point. Some metros that are large enough don’t qualify for this list because home prices never reached $300,000, despite the blistering surge of home prices in recent years, such as the metros of New Orleans, Memphis, Oklahoma City, Tulsa, Cincinnati, and Pittsburgh.
Prices declined year-over-year in 22 of our 33 MSAs in October:
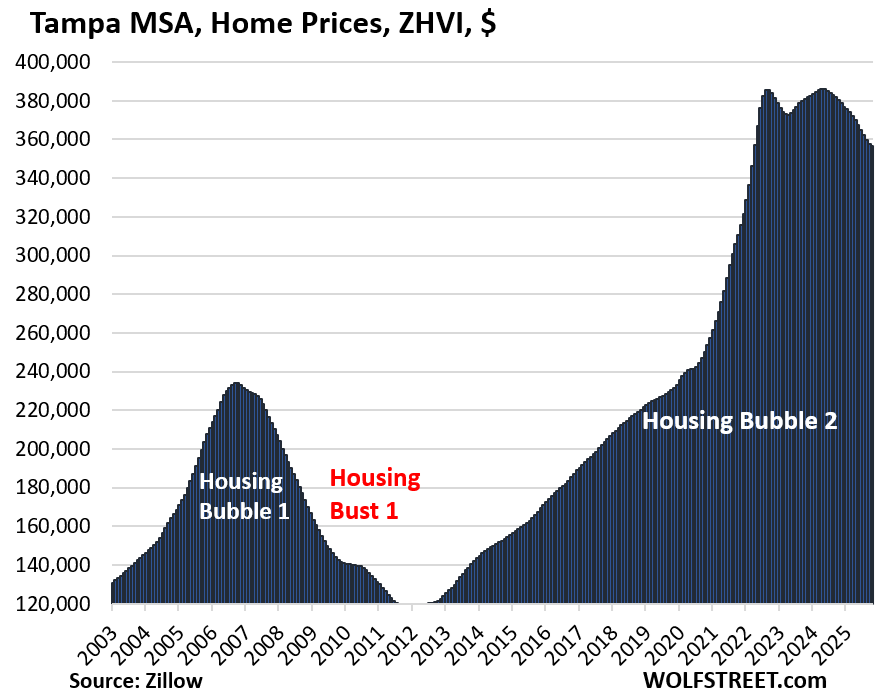
- Tampa, FL: -6.3%
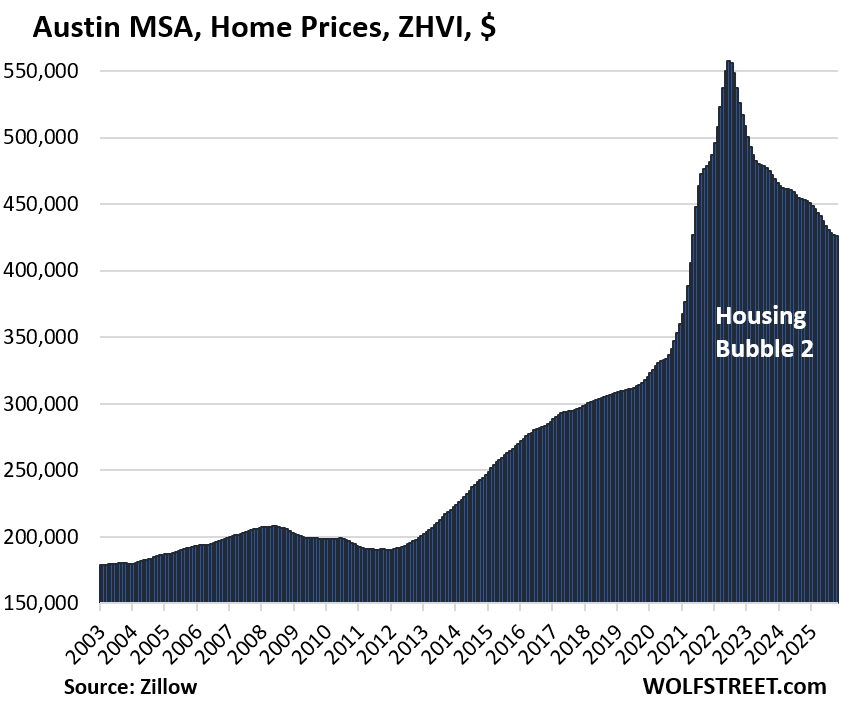
- Austin, TX: -6.0%
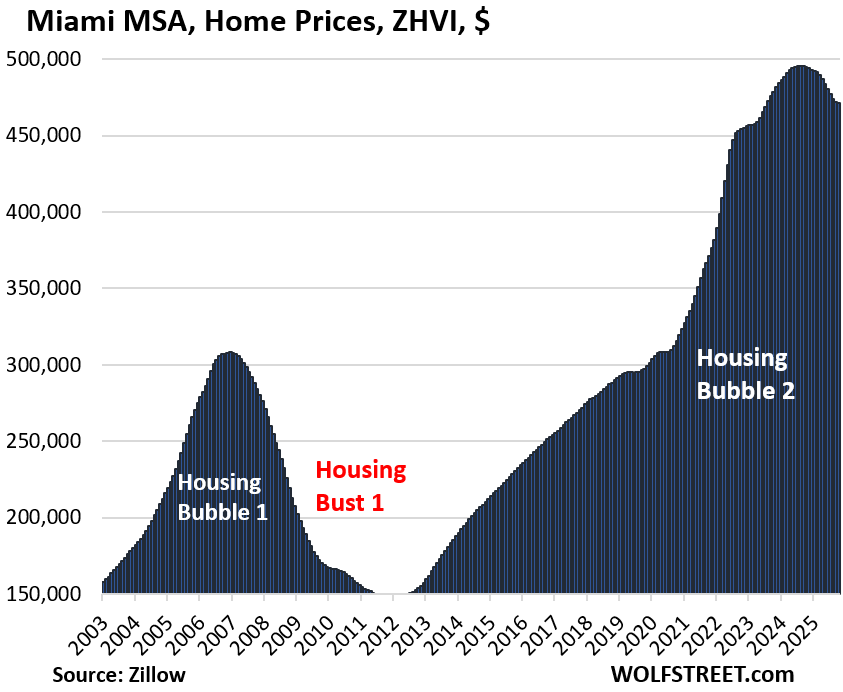
- Miami, FL: -4.8%
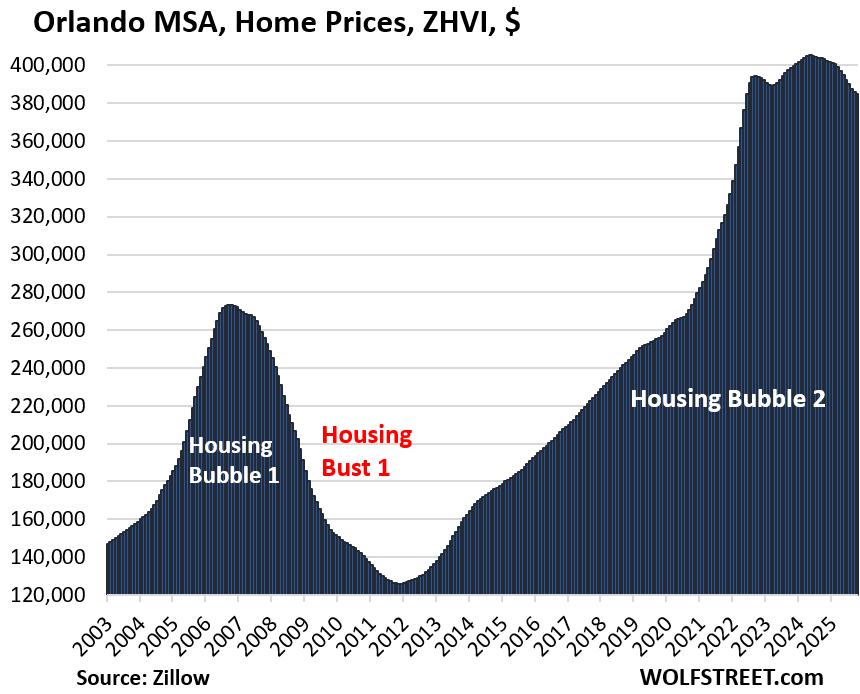
- Orlando, FL: -4.5%
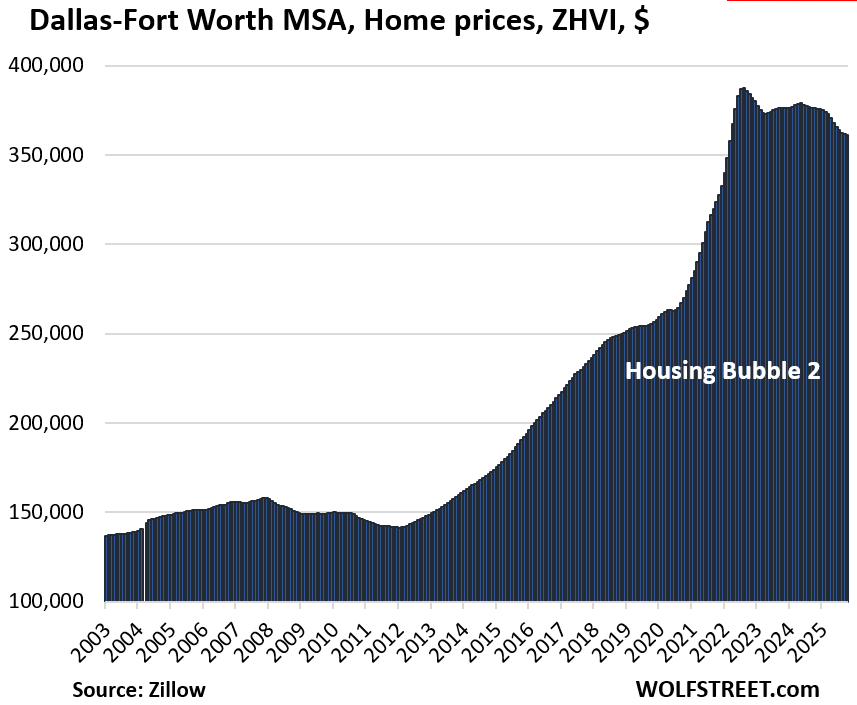
- Dallas, TX: -4.0%
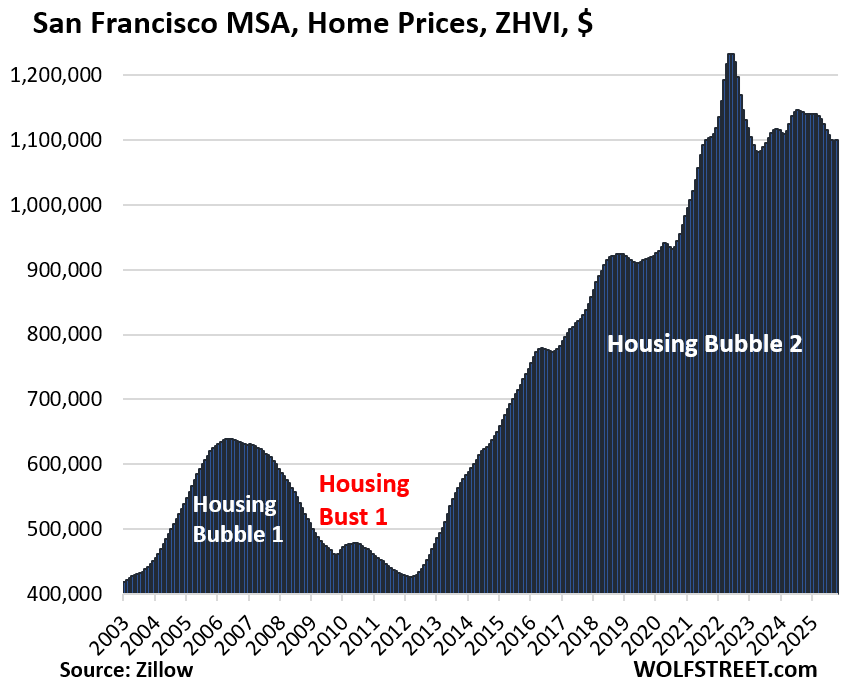
- San Francisco, CA: -3.5%
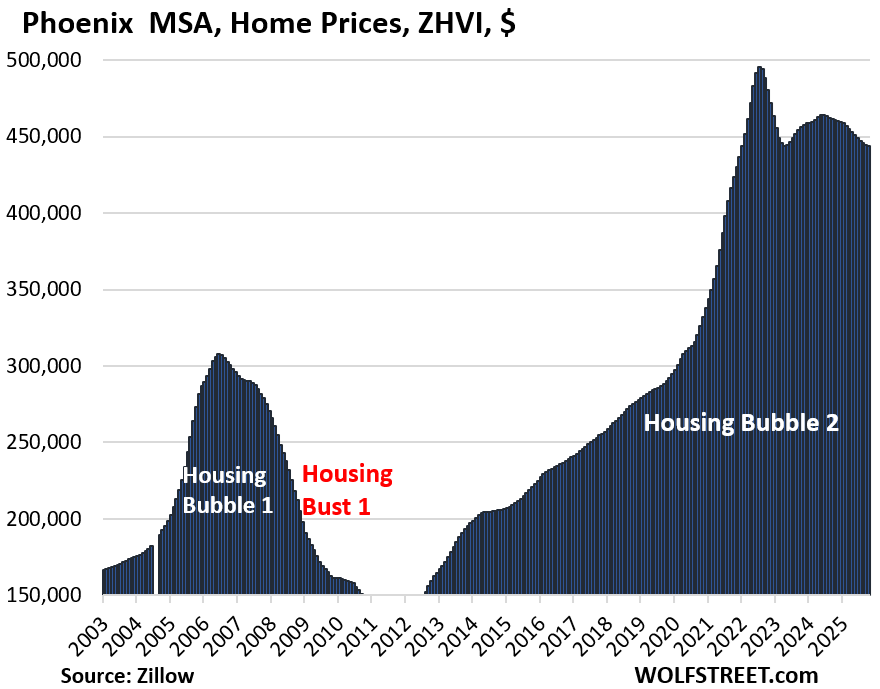
- Phoenix, AZ: -3.6%
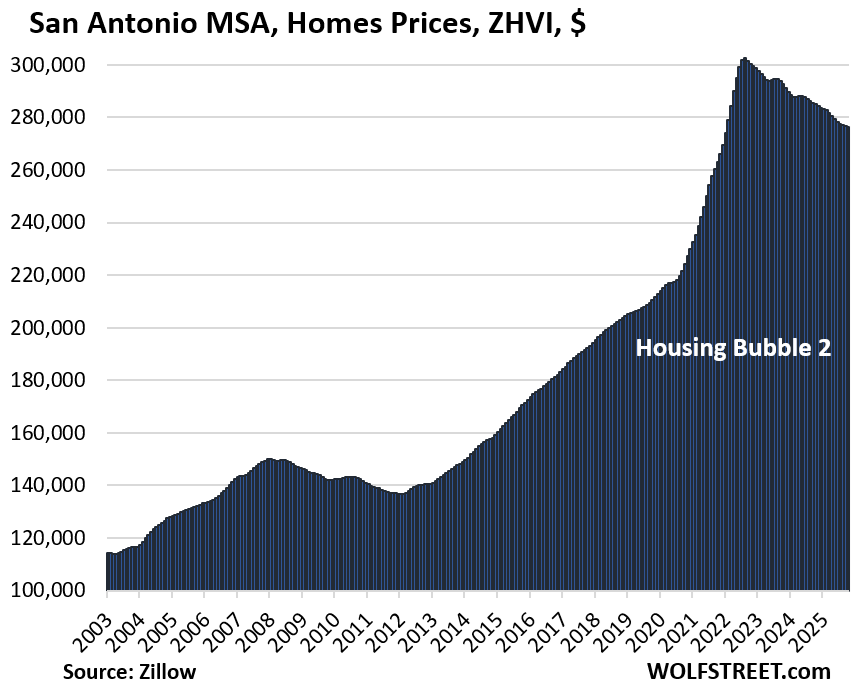
- San Antonio, TX: -3.1%
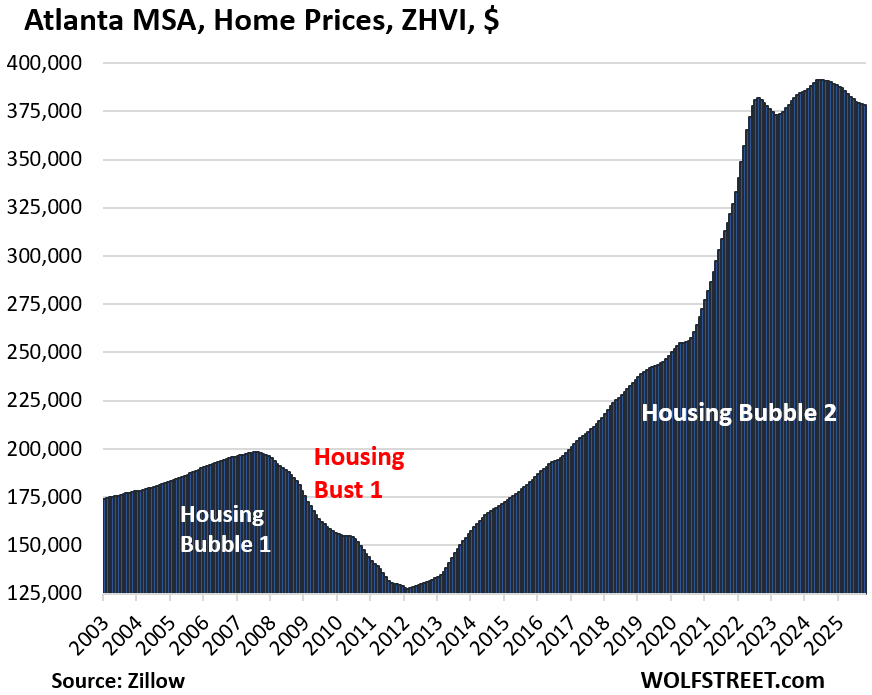
- Atlanta, GA: -3.0%
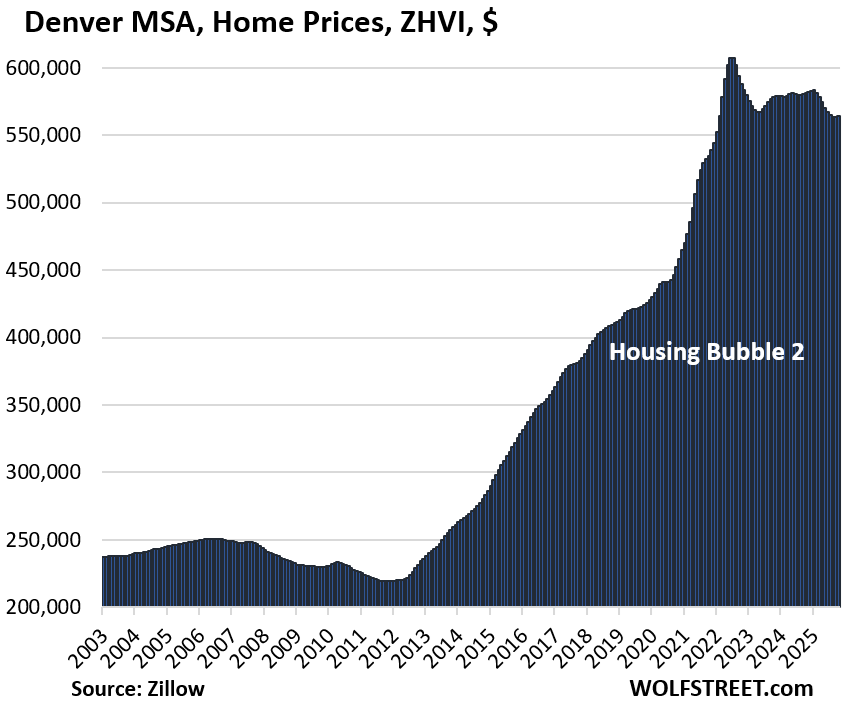
- Denver, CO: -3.0%
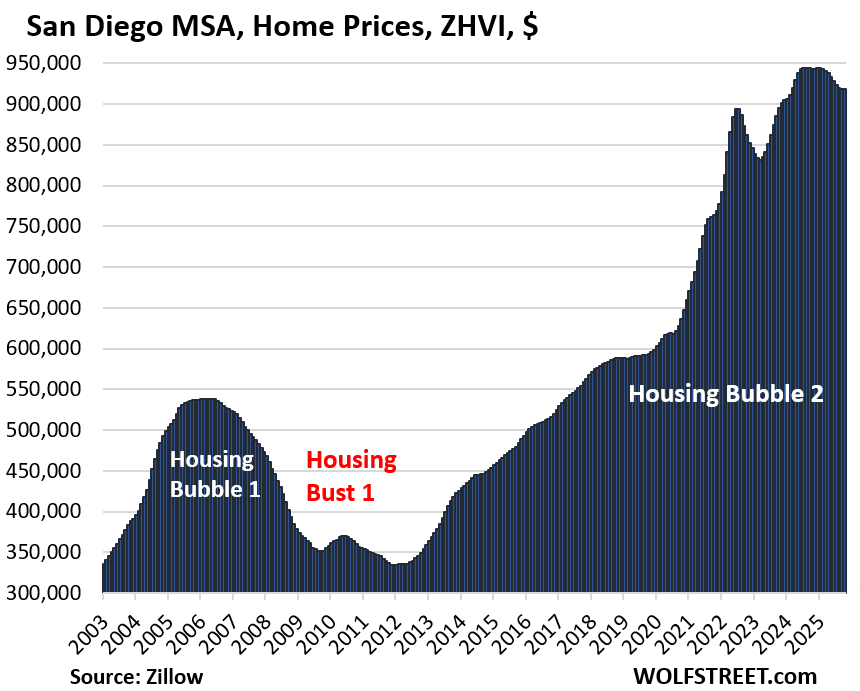
- San Diego, CA: -2.6%
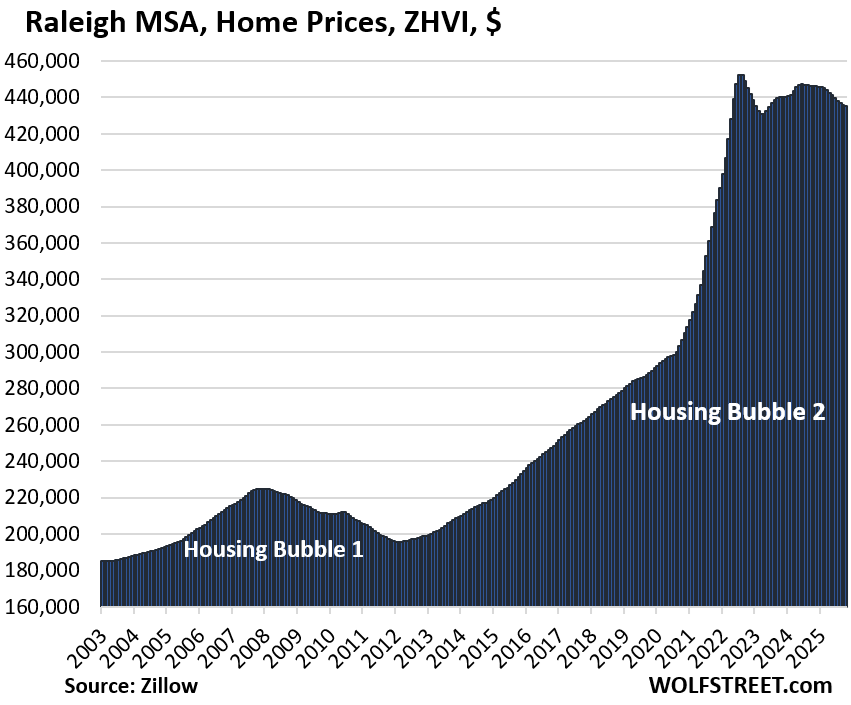
- Raleigh, NC: -2.5%
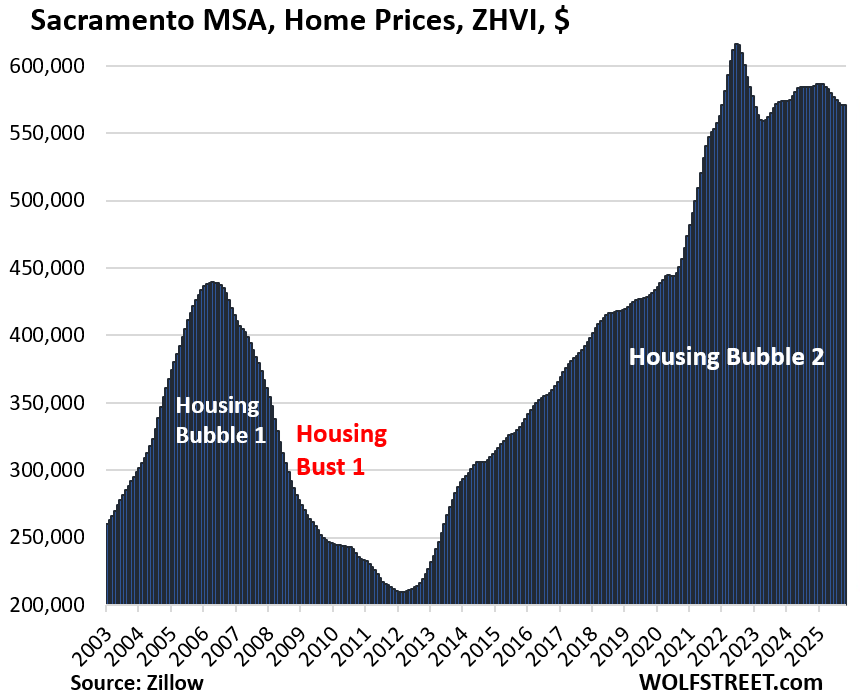
- Sacramento, CA: -2.3%
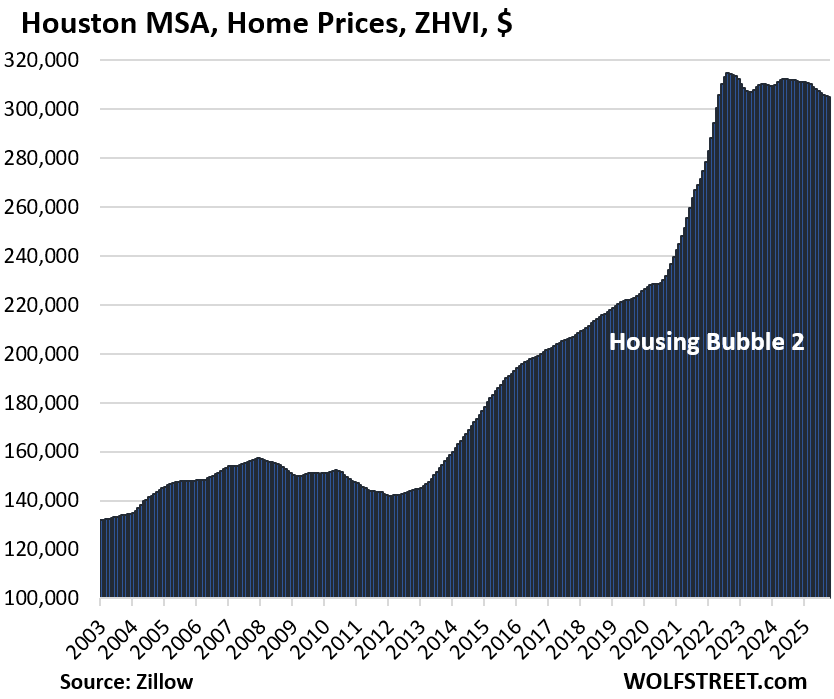
- Houston, TX: -2.1%
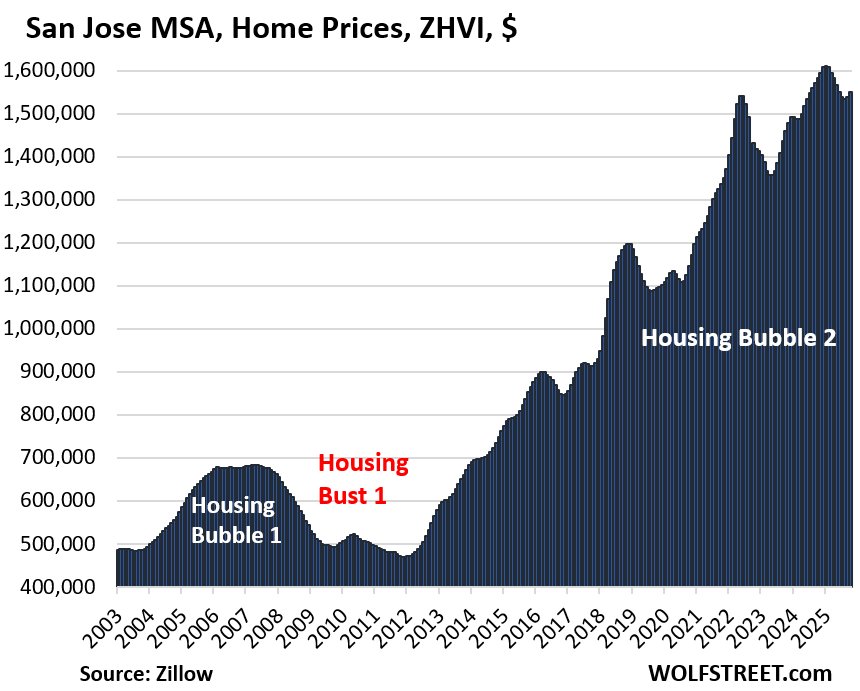
- San Jose, CA: -2.1%
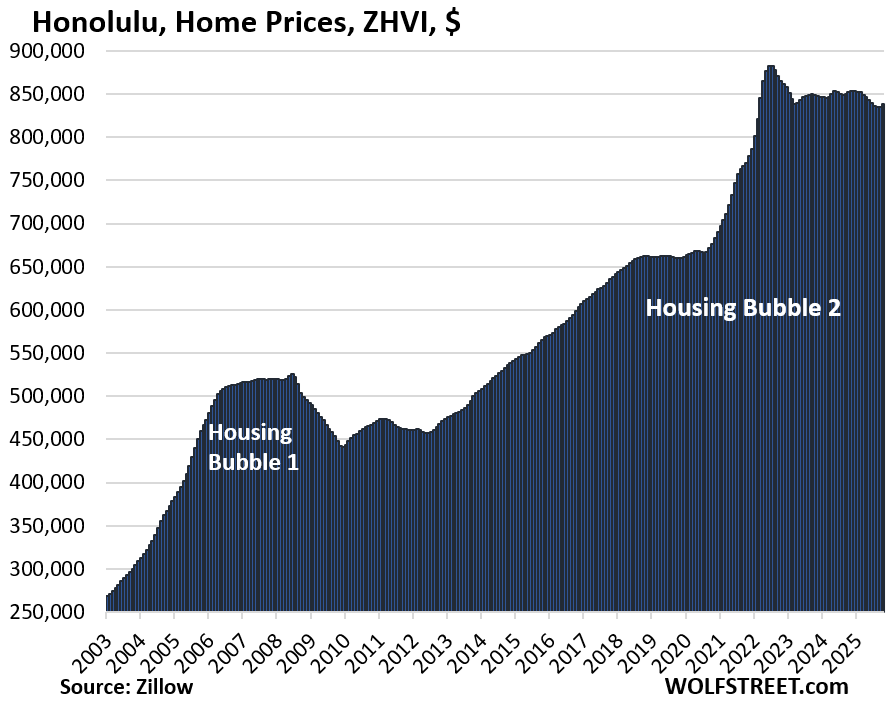
- Honolulu, HI: -1.6%
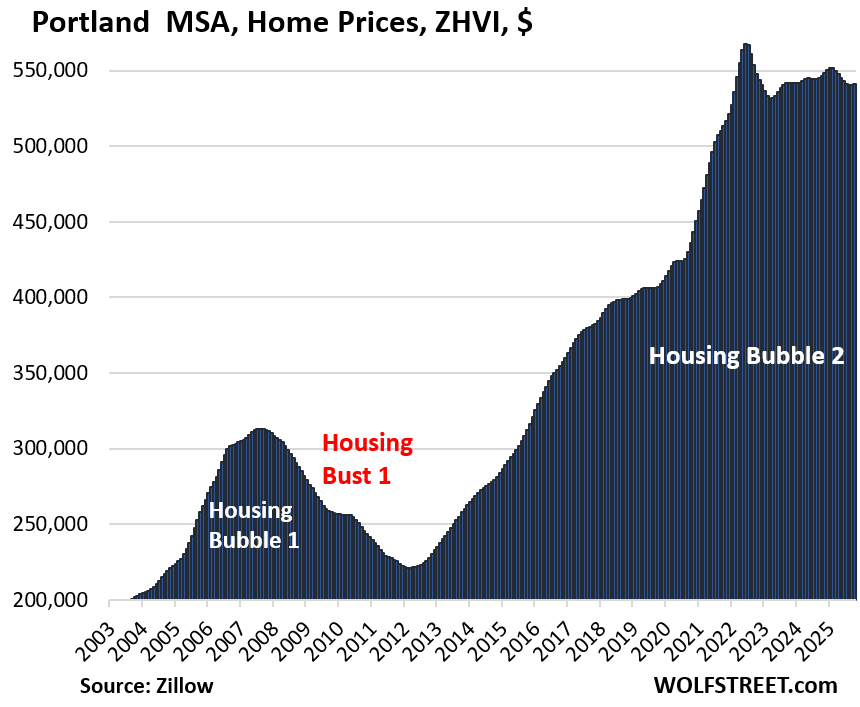
- Portland, OR: -1.0%
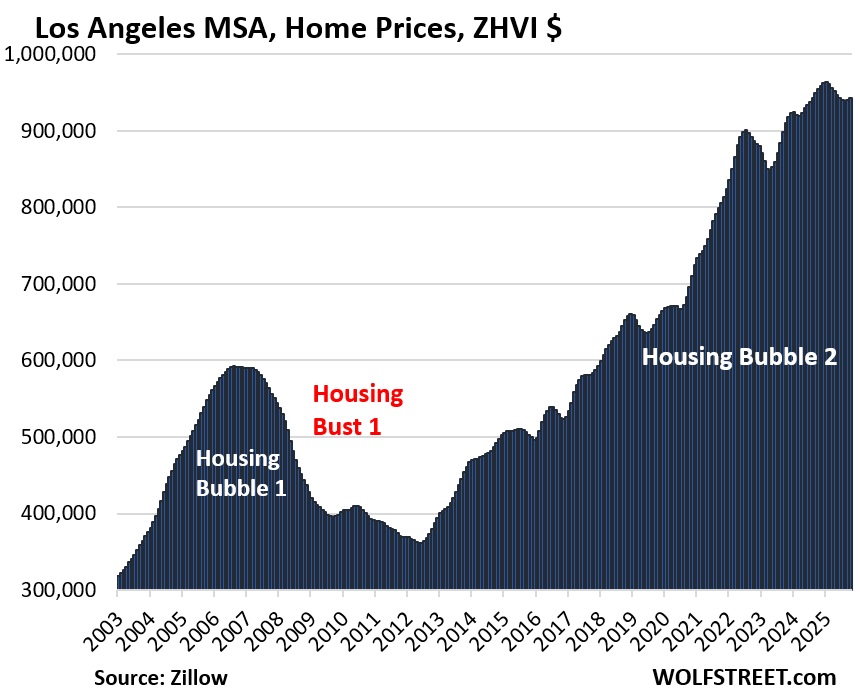
- Los Angeles, CA: -1.2%
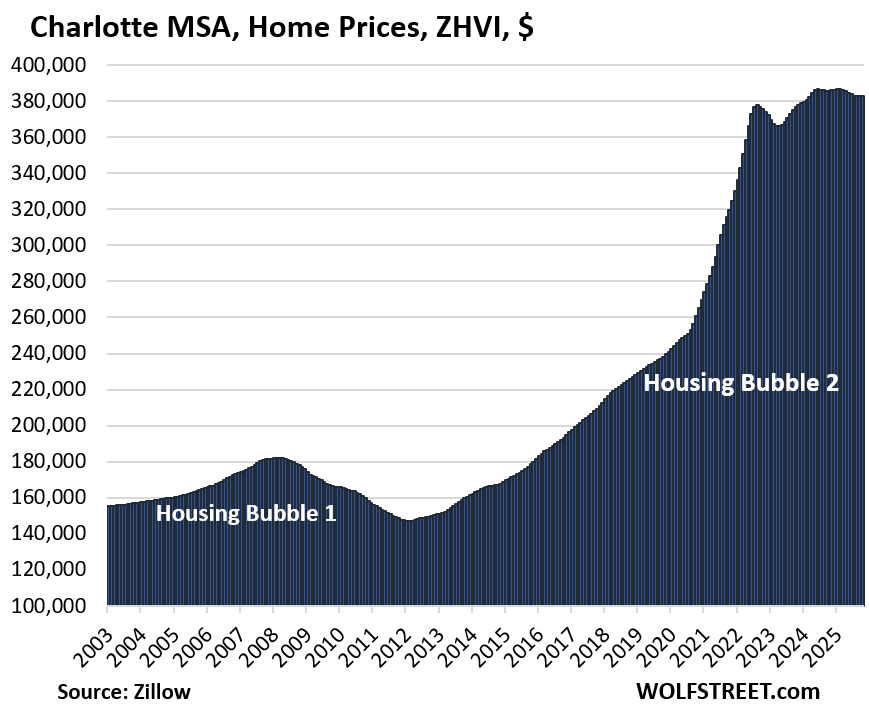
- Charlotte, NC: -0.7%
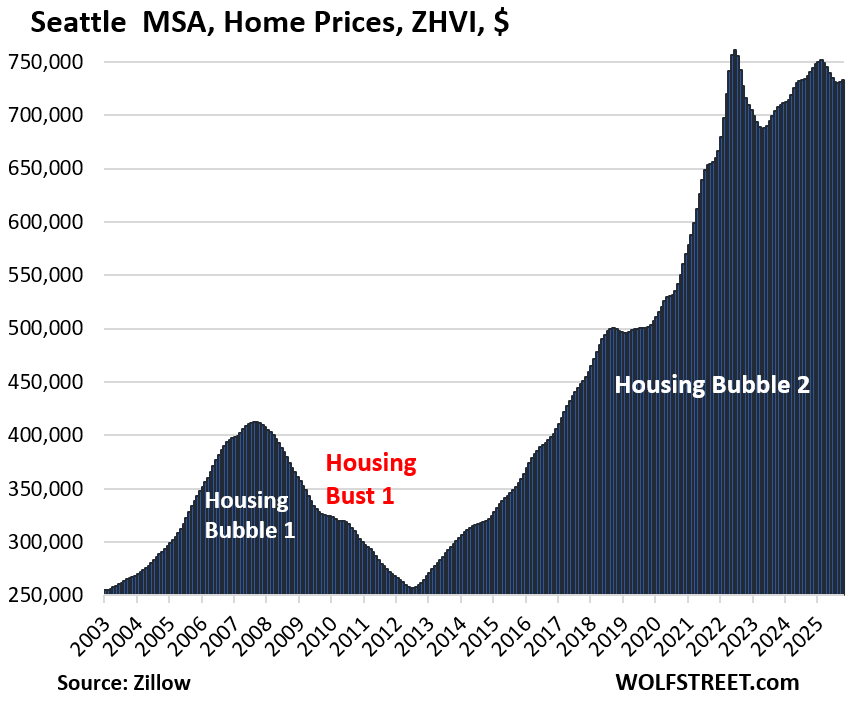
- Seattle, WA: -1.0%
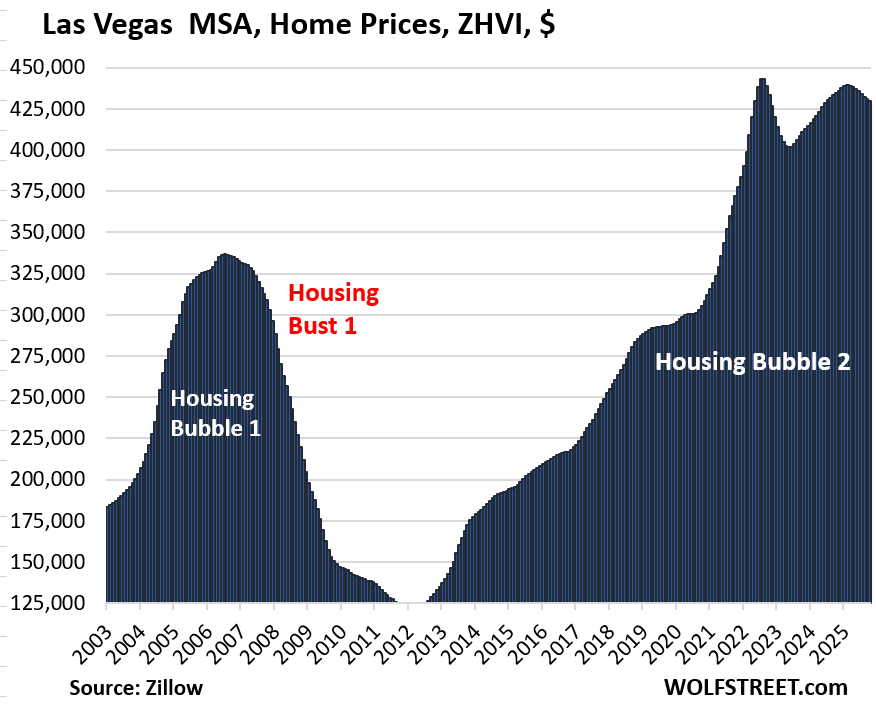
- Las Vegas, NV: -1.1%
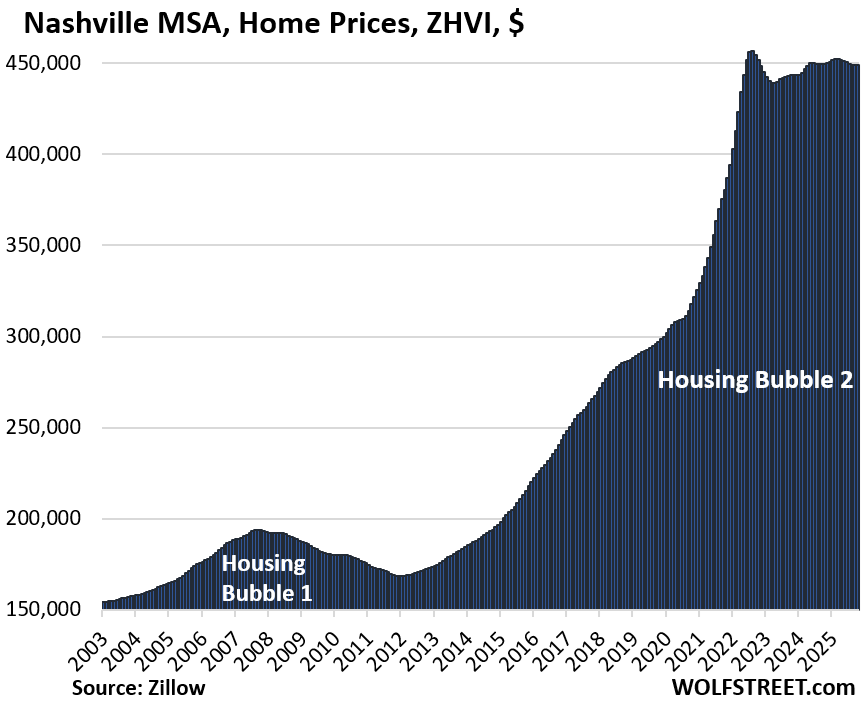
- Nashville, TN: -0.1%
Prices were down from their highs in prior years in 23 of the 33 metros.
Prices were down from their peaks in 2022, 2023, or 2024 in 23 of our 33 metros, amid ballooning supply and low demand. The top entry among the 33 metros was the Austin MSA (Austin-Round Rock-San Marcos, TX), where prices of mid-tier homes have plunged by 23.6% since mid-2022.
Of the 33 MSAs here, 17 experienced their peaks in 2022; Atlanta’s was in 2023, and the peaks of 5 (Miami, San Diego, Charlotte, San Jose, Los Angeles) were in 2024:
Percentage declines from their respective peaks in prior years:
- Austin, TX: -23.6%
- San Francisco: -10.8%
- Phoenix: -10.4%
- San Antonio: -8.7%
- Denver: -7.1%
- Sacramento: -7.3%
- Tampa: -7.5%
- Dallas: -6.8%
- Honolulu: -5.0%
- Portland: -4.7%
- Orlando: -5.0%
- Miami: -4.9% (2024 peak)
- San Jose: -3.9% (2024 peak)
- Seattle: -3.7%
- Raleigh: -3.8%
- Atlanta: -3.3% (2023 peak)
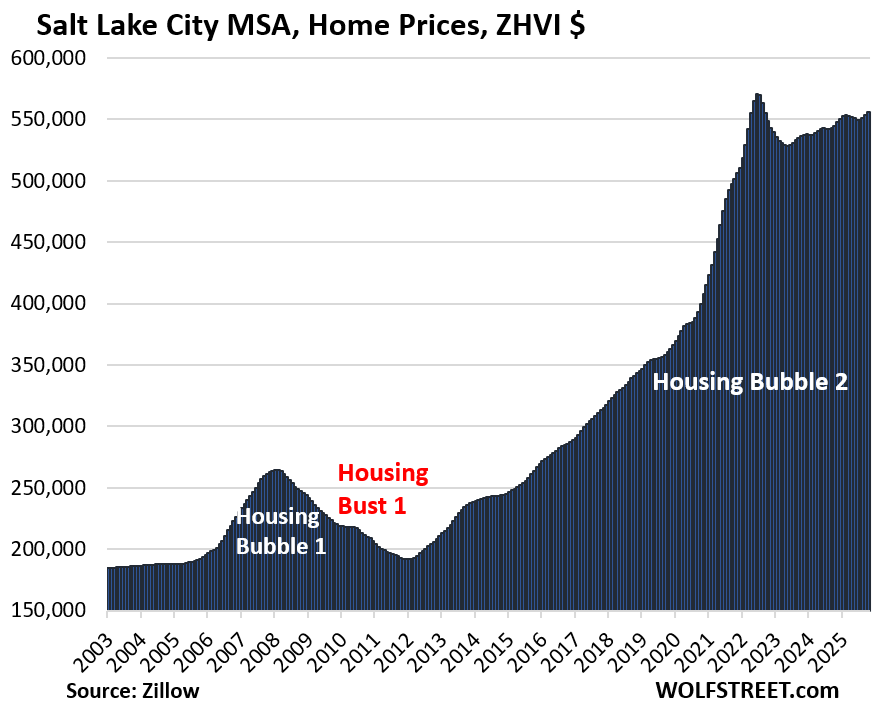
- Salt Lake City: -2.6%
- Houston: -3.1%
- San Diego: -2.8% (2024 peak)
- Las Vegas: -3.0%
- Los Angeles: -2.2% (2024 peak)
- Nashville: -1.7%
- Charlotte: -0.9% (2024 peak)
Methodology: All pricing data here for the 33 metropolitan statistical areas (MSA) is from the seasonally adjusted three-month-average mid-tier Zillow Home Value Index (ZHVI), released today. The ZHVI is based on millions of data points in Zillow’s “Database of All Homes,” including from public records (tax data), MLS, brokerages, local Realtor Associations, real-estate agents, and households across the US. It includes pricing data for off-market deals and for-sale-by-owner deals. Zillow’s Database of All Homes also has sales-pairs data.
The 33 Most Splendid Housing Bubbles.
In the little tables, MoM = month over month; YoY = year-over-year. In the column furthest to the right: the percentage increase “since 2000.”
| Austin MSA, Home Prices | |||
| From Jun 2022 peak | MoM | YoY | Since 2000 |
| -23.6% | -0.2% | -6.0% | 147% |
Lowest since April 2021. Prices in the Austin-Round Rock-San Marcos MSA had exploded by 73% from January 2020 through June 2022. And some of that crazy price explosion has now gotten unwound:
| San Francisco MSA, Home Prices | |||
| From May 2022 peak | MoM | YoY | Since 2000 |
| -10.8% | 0.1% | -3.5% | 282% |
Back to August 2021. From January 2020 through June 2022, prices exploded by 33%.
The San Francisco-Oakland-Fremont metro includes San Francisco, much of the East Bay (such as Oakland), much of the North Bay, and goes south on the Peninsula into Silicon Valley through San Mateo County. It does not include the San Jose metro, which covers the southern portion of the Bay Area.
| Phoenix MSA, Home Prices | |||
| From Jun 2022 peak | MoM | YoY | Since 2000 |
| -10.4% | -0.1% | -3.6% | 211% |
Back to January 2022. Prices exploded by 65% from January 2020 through June 2022.
| San Antonio MSA, Home Prices | |||
| From Jul 2022 peak | MoM | YoY | Since 2000 |
| -8.7% | -0.1% | -3.1% | 143% |
| Tampa MSA, Home Prices | |||
| From Jul 2022 peak | MoM | YoY | Since 2000 |
| -7.5% | -0.3% | -6.3% | 252% |
Prices exploded by 60% between January 2020 and June 2022.
| Sacramento MSA, Home Prices | |||
| From July 2022 peak | MoM | YoY | Since 2000 |
| -7.3% | 0.0% | -2.3% | 239.1% |
| Denver MSA, Home Prices | |||
| From Jun 2022 peak | MoM | YoY | Since 2000 |
| -7.1% | 0.1% | -3.0% | 203% |
| Dallas-Fort Worth MSA, Home Prices | |||
| From Jun 2022 peak | MoM | YoY | Since 2000 |
| -6.8% | -0.1% | -4.0% | 184% |
| Orlando MSA, Home Prices | |||
| From June 2022 | MoM | YoY | Since 2000 |
| -5.0% | -0.3% | -4.5% | 223% |
Prices exploded by 48% between January 2020 and June 2022.
| Honolulu, Home Prices | |||
| From Jun 2022 peak | MoM | YoY | Since 2000 |
| -5.0% | 0.4% | -1.6% | 277% |
| Miami MSA, Home Prices | |||
| From Sep 2024 peak | MoM | YoY | Since 2000 |
| -4.9% | -0.2% | -4.8% | 312% |
| Portland MSA, Home Prices | |||
| From May 2022 peak | MoM | YoY | Since 2000 |
| -4.7% | 0.1% | -1.0% | 213% |
| San Jose MSA, Home Prices | |||
| Fr Dec 2024 high | MoM | YoY | Since 2000 |
| -3.9% | 0.7% | -2.1% | 331% |
| Raleigh MSA, Home Prices | |||
| From July 2022 peak | MoM | YoY | Since 2000 |
| -3.8% | -0.1% | -2.5% | 152% |
| Seattle MSA, Home Prices | |||
| From May 2022 peak | MoM | YoY | Since 2000 |
| -3.7% | 0.3% | -1.0% | 233% |
| Atlanta MSA, Home Prices | |||
| From July 2022 | MoM | YoY | Since 2000 |
| -3.3% | -0.1% | -3.0% | 155% |
Prices exploded 51% between January 2020 and June 2022.
| Houston MSA, Home Prices | |||
| From Jul 2022 peak | MoM | YoY | Since 2000 |
| -3.1% | -0.1% | -2.1% | 147% |
| Las Vegas MSA, Home Prices | |||
| From June 2022 peak | MoM | YoY | Since 2000 |
| -3.0% | -0.2% | -1.1% | 177% |
| San Diego MSA, Home Prices | |||
| Fr Jul 2024 peak | MoM | YoY | Since 2000 |
| -2.8% | 0.0% | -2.6% | 327% |
Prices exploded by 53% between January 2020 and June 2022.
| Salt Lake City MSA, Home Prices | |||
| From July 2022 peak | MoM | YoY | Since 2000 |
| -2.6% | 0.5% | 2.1% | 218% |
| Los Angeles MSA, Home Prices | |||
| Fr Dec 2024 high | MoM | YoY | Since 2000 |
| -2.2% | 0.3% | -1.2% | 326% |
| Charlotte MSA, Home Prices | |||
| Fr May 2024 peak | MoM | YoY | Since 2000 |
| -0.9% | 0.1% | -0.7% | 166% |
Prices exploded by 54% between January 2020 and June 2022.
| Nashville MSA, Home Prices | |||
| From July 2022 peak | MoM | YoY | Since 2000 |
| -1.7% | 0.0% | -0.1% | 215% |
Prices exploded by 50% between January 2020 and June 2022.
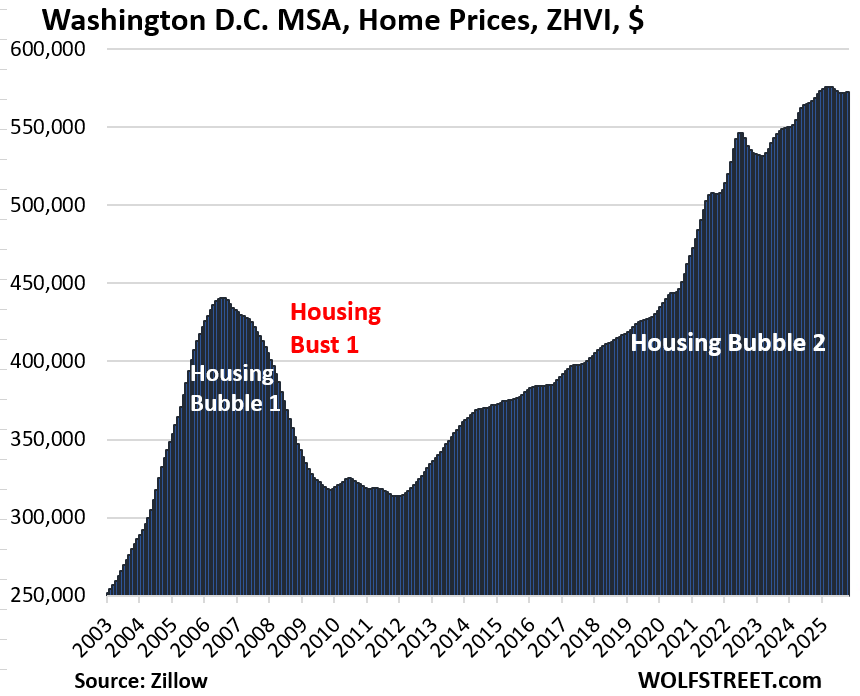
| Washington D.C. MSA, Home Prices | ||
| MoM | YoY | Since 2000 |
| 0.1% | 0.6% | 217% |
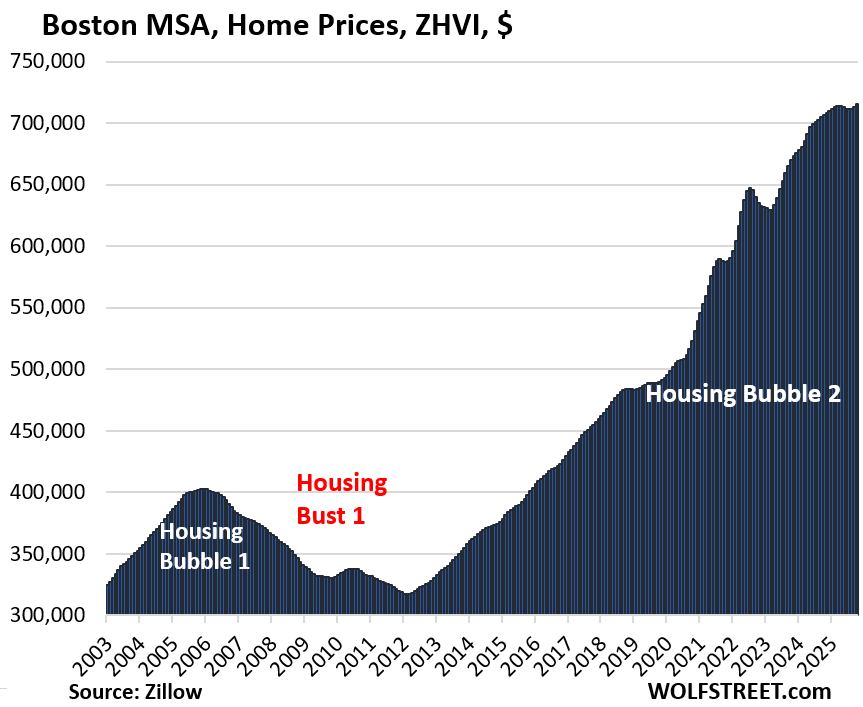
| Boston MSA, Home Prices | ||
| MoM | YoY | Since 2000 |
| 0.4% | 1.2% | 227% |
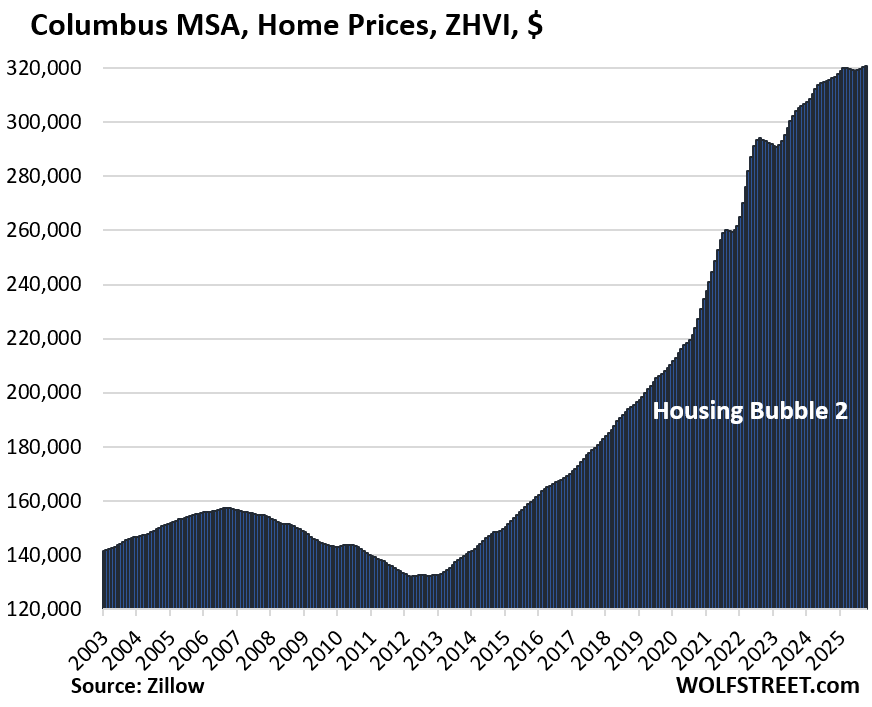
| Columbus MSA, Home Prices | ||
| MoM | YoY | Since 2000 |
| 0.2% | 1.4% | 156% |
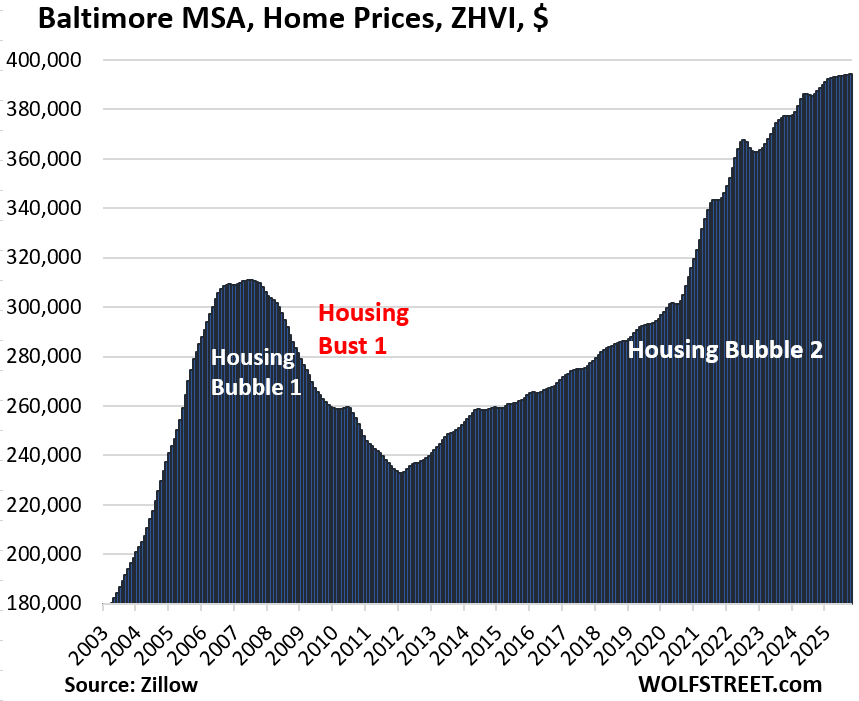
| Baltimore MSA, Home Prices | |||
| MoM | YoY | Since 2000 | |
| 0.0% | 1.8% | 178% | |
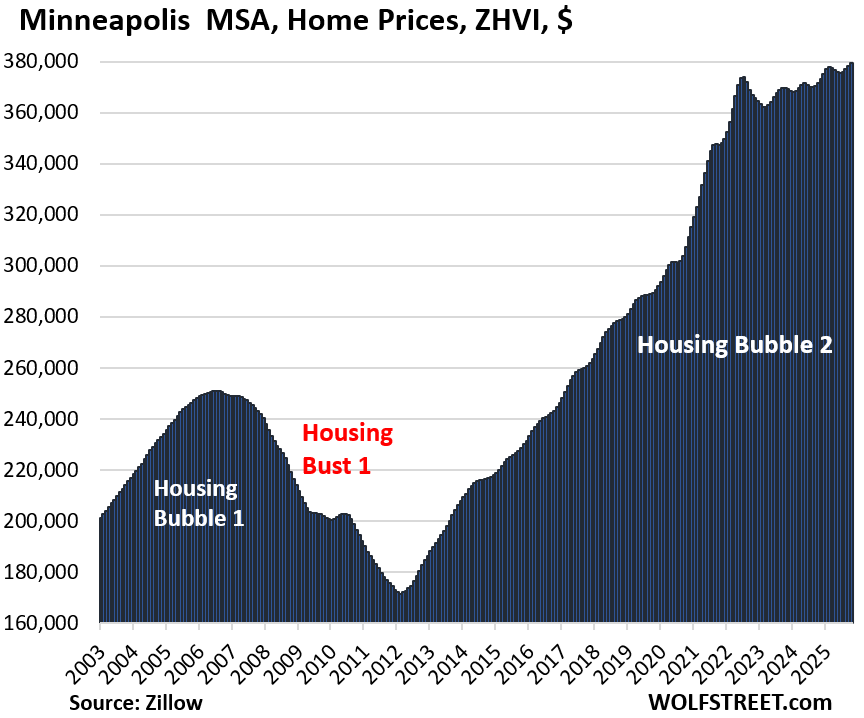
| Minneapolis MSA, Home Prices | ||
| MoM | YoY | Since 2000 |
| 0.3% | 2.1% | 161% |
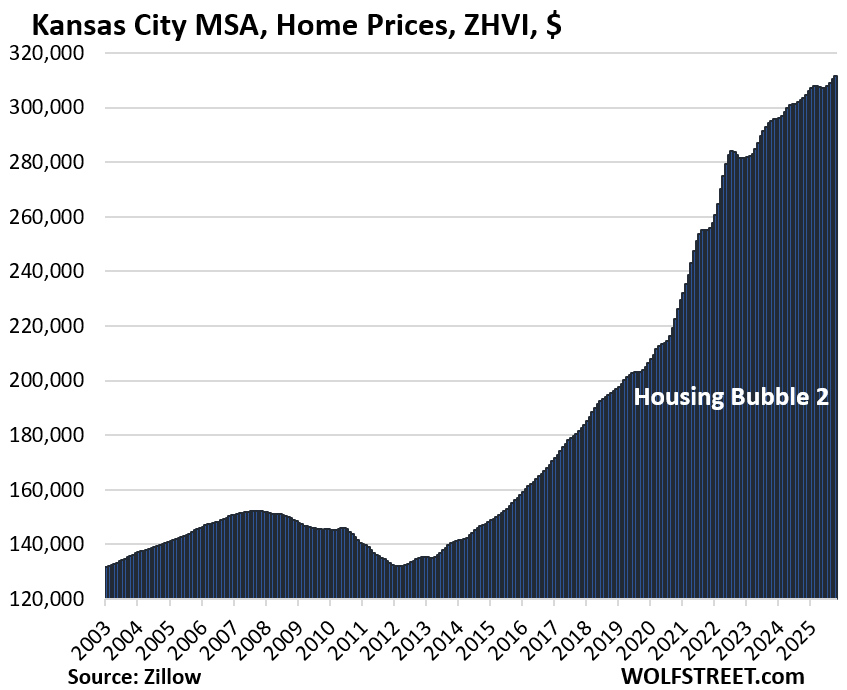
| Kansas City MSA, Home Prices | ||
| MoM | YoY | Since 2000 |
| 0.4% | 2.6% | 181% |
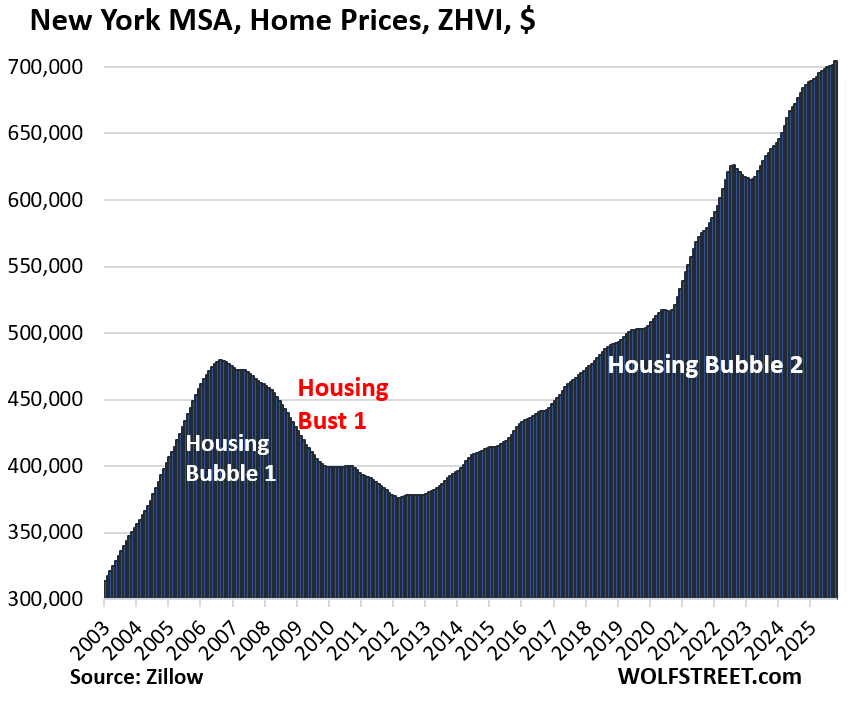
| New York MSA, Home Prices | ||
| MoM | YoY | Since 2000 |
| 0.3% | 2.9% | 221% |
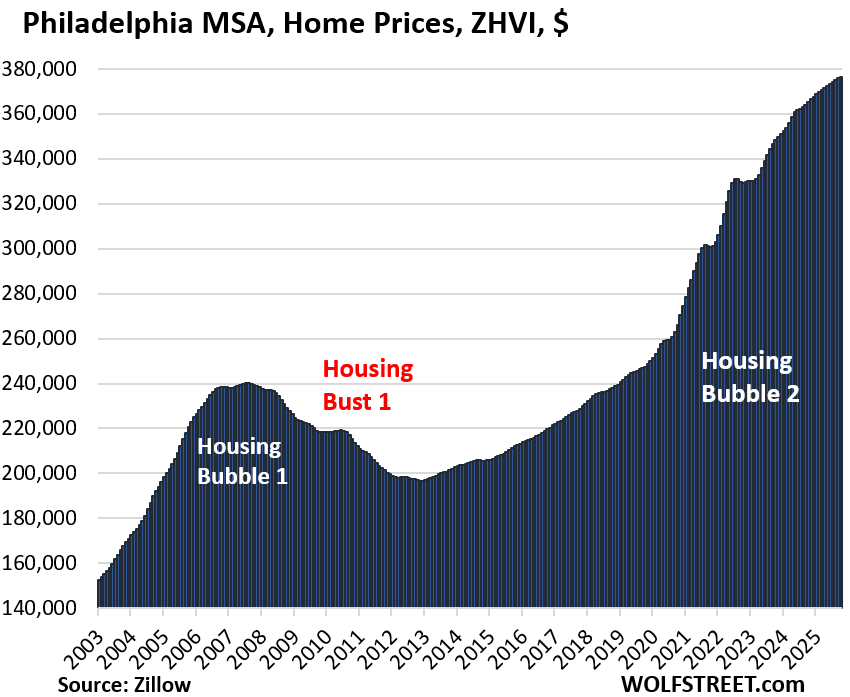
| Philadelphia MSA, Home Prices | ||
| MoM | YoY | Since 2000 |
| 0.1% | 3.0% | 209% |
| Chicago MSA, Home Prices | ||
| MoM | YoY | Since 2000 |
| 0.4% | 3.6% | 119% |
| Milwaukee MSA, Home Prices | ||
| MoM | YoY | Since 2000 |
| 0.6% | 3.7% | 153.1% |
And in case you missed it:
Enjoy reading WOLF STREET and want to support it? You can donate. I appreciate it immensely. Click on the mug to find out how:

![]()
SF Bay Area:
From 400K in 2013 to peak 1.2M and 1.05M doesnt mean much. We need deep correction in order to bring some sanity. FAANG & major tech stocks have sky rocketed, those valuations have been supporting those crazy prices.
But good thing is last 2 years, overbidding craziness have come down and house sitting much longer on markets. Hope Buyers continue to show restrain and not get into FOMO.
If you look city by city, it’s a little different. Here is one Bay Area city:
What are the red lines in the Oakland graphs supposed to show?
Current price. It allows you to compare it to past prices. For example, the current condo price is just a hair above where it had been during the peak of Housing Bubble 1 in 2006. At the current pace of declines, current condo prices will be below where they’d been at the 2006 peak by early 2006, and the updated chart will then show the red line going through the Housing Bubble 1 peak.
You don’t really need the red line; it just makes it easier to compare to 20-years-ago prices. You could also draw a line with a red Magic Marker straight across your computer/phone screen and come up with the same conclusion. So the red line just saved you some extra work and cleanup.
Oakland real-estate is kinda crazy. My daughter lived there 2016-2018, and worked across the bay.
At the time, there were super nice, new, expensive condos right next door to burned out gutted houses, cars on blocks, blatant drug deals, homeless encampments, etc.
There are places where that haves and have nots are not just living near each other, but amongst each other in a mosaic. The huge disparities are not a stones throw away, but a neighbors toilet flush sound away.
“burned out gutted houses, cars on blocks, blatant drug deals, homeless encampments”
That was sort of the median Oakland situation pre-Internet Bubble 1.0 and the 20 Years of ZIRP.
It was only the madness of the Internet Bubble and the ZIRP fool fuel – by making SV and SF *insanely* unaffordable – that turned nearby Oakland into a semi-hemi candidate for quasi-realistic gentrification.
To cas127….
I cannot speak intelligently about the gentrification side of it.
But I know people kinda make it work by subletting to many roommates to be able to afford.
Property crimes in that area are don’t ask don’t tell, by locals and Law Enforcement.
My daughter finally decided to leave the Bay Area and the state….and is far better off now….
(After) she had her car stolen twice, and then they stole the batt out of her car 5 times over a month at almost $200 a piece. Even after I wrapped it with gorilla lock cables around the battery and the hood latch assembly.
The last time they stole the battery they stole the grill and headlights.
Helped her into a newer more theft resistant vehicle…. But they started smashing out the windows even though she would leave big signs on the seats to please not break the windows because there was nothing in it. Windows are kind of expensive, and repairs are sometimes weeks out because so many are smashed there.
I told her we were working 3 times as hard to have 1/4 as much as people who were not working at all… just for her to enjoy being there. Did not seem worth it.
This area was mixed right in with Tech well to do people. It is just accepted by people as part of the deal.
Not a racist post… and we were not afforded more opportunities than others, (been busting my rump at over 40-72 hrs. per week since 14 yrs old for over 3 decades) as well as her working 40 hrs/ wk
Just realistic real life experiences of what I believe to be an undesirable way to live life….
Too bad…
the Bay is kinda a kinda cool place….just far too expensive in multiple ways to live a reasonable life.
Wolf, thank you so much for your input! I am very curious where the housing market is gonna end up in 8-9 months after stock market sheds 20-30%.
What we’ve seen in the past is that a 20% drop won’t do much to the housing market. A sustained 30%+ drop will likely do more damage. If the AI bubble implodes with its maniacal hiring, compensation packages, and valuations (startups), it will do some damage in the cities that are bigly into it. The decline has to be deep and long, with some crushed sucker rallies before it will make a real difference.
There is no bubble in places like Chicago and Milwaukee.
The prices did jump but this after price stagnation for almost 20 years.
People cannot afford housing not because of housing price but because of property tax, insurance, repair costs, and interest rate. Salary didn’t keep up with insurance but property prices will. This is the reality. Even in crazy places like California, the prices won’t dramatically come down. People would rather hold on then to sell them at discount.
I’ve lived in the Chicago area (suburbs) all my life.
The weather is, usually, terrible. The Traffic stinks. The COL is moderate however.
We are still here for only 1 reason. Our families are here. Our Grandchildren are here.
We’ll put up with lots of … difficulties … to be close to our grandkiddies.
I was in Chicago and could never understand the appeal of the city.
I am at a lost that why home prices in Chi is not going down. One can’t even pay me to live there.
Prices in CA are already coming down. Did you look at the price action in SFO ?
Chicago has freshwater, and is inland-safe from hurricanes, earthquakes and mudslides. But theres a crooked government, highest sales and property tax and the worst, windiest coldest winters that are gray and depressing. 10.25% sales tax, 11.75% dining out restaurant tax.. its not cheap at all and the cost of housing is only cheap in the worst neighborhoods, and tons of condos with very high HOAs.
Seeing these numbers is depressing. I have to wonder when we’ll get some major movement outside of a few outlier cities.
Feels like the saying “the market can stay irrational longer than you can stay solvent”. If it takes 10 years to come down it doesn’t help anyone much. But I guess that’s the feds goal, they don’t want to fix their mistake.
Interest rates are coming down and FOMO buyers are lined up.
What’s your basis for saying interest rates are coming down? They are not.
If you look at the history of home prices after a recession, you’ll find that there is always a downdraft in real estate prices.
So, its’ interesting, and probably profitable, to track this changing price environment. It should go from overbought, to oversold.
The chart you linked was adjusted for CPI, which is a nonsensical thing to do — adjusting one inflation measure (home price inflation) by another inflation measure (consumer price inflation, which is dominated by housing services)
Good point. What do you think FED considers bigger risk. Lack of house affordability for about 75% of working people, or loan losses to lenders and thus mortgage products creating financial contagion to banking system? That is an easy question . Especially when FED participated in causing the problem, ie , increase in all asset prices especially housing.
I doubt 75% of the working population wants to own a home.
In general, the long term average is about 65% home ownership, 35% rental.
That strikes me as a reasonable reflection of “desire” (as opposed to “affordablity”) – the latter hugely whipsawed by 20 years of idioit ZIRP.
So I do think maybe 65% of “the working population” (what is your definition of *that*?) would “like” to own a home someday – but Fed policies have converted the US housing market into a giant casino built upon melting ice.
“Fed policies have converted the US housing market into a giant casino built upon melting ice.”
Certainly no disagreement from me on this.
But – my ear-to-the-ground sense, as a certified millennial, is that most of my generation along with the Gen Z crowd aren’t as interested in owning a home. Maybe there’s some element of sour grapes here, but it genuinely seems like they value freedom and mobility and don’t want to be tied down. Renting gives them that freedom.
Perhaps that 65:35 ratio will shift over time.
STLT, I’ve been thinking for a while now that perhaps all the asset inflation engendered by the FED was to drive the younger bunch in the direction you point out whether they want to or not… ie getting them used to being pay as you go plebes instead of asset owners. Nothing good at the end of that road as far as I can tell.
“…or loan losses to lenders and thus mortgage products creating financial contagion to banking system?”
Why do you think this? As our host has patiently and repeatedly pointed out, the risk is to the taxpayer via Federal backstopping of MBS, not to the banking system.
“Interest rates are coming down and FOMO buyers are lined up.”
Interest rates are not coming down. No buyers lined up else there would have been little inventory.
Whenever FED cut rates, longer term rates goes up.
My guess is that the Fed will not seriously consider cutting rates until March. The data is unreliable for a change of rates in December. By March, the data should be better and the Fed will be able to judge how things stand after the festive season. If there are mass layoffs once the festive season ends, they can cut rates. But that situation will depress house prices rather than raise them. If there are no layoffs and festive spending has shifted from stuff to services, then inflation will reman high and the Fed can stick. Again, that won’t stop property prices from falling. March is a dot plot month when they can more easily justify their decision.
Other than blind funds, there are no buyers of sub 4% long term USD denominated debt.
Bond holders are going to take a longgggggggg time for forgive the fed for 2020-2022.
By which you mean the slaughter of 10 and 30 yr T bond holders in 21-22?
Agreed…but how could those buyers not understand the terrible, terrible danger they were in due to bond duration risks and the complete and utter Virtual Reaility World that 20 years of ZIRP had created.
Anybody could see that the US had a sickening worsening of the Debt-to-GDP ratio even as Fed money printing was artificially strangling interest rates.
“but how could those buyers not understand the terrible, terrible danger they were in due to bond duration risks and the complete and utter Virtual Reaility World that 20 years of ZIRP had created”
I completely agree – as someone who also didn’t own those bonds.
But it seems like the ZIRP-induced brain-mushification made them think that half a % on ten years of Uncle Sam’s debt was a good return…
I have noticed some very modest price decreases in N.H. and a lot more for sale signs outside of Boston where I work,a fair amount of new ones and weird right before holiday season but guess folks see that the time to sell if they want to is now.
That said,for the most part excepting true rural ares New England is still over priced in my non professional opinion.
New England is a special exception in that there is very little new construction, which supports housing prices.
But eventually the winters are going to kill the 80 and 90 year olds stranded there by adverse retirement fund outcomes.
And who will buy their houses (and support current SFH prices) in the NE and MW then?
The long delay in the long predicted impact of demographics in cold region housing markets cannot be *forever* delayed.
It is basically amazing that it has been held off this long.
(Which does make me wonder…how exactly? I vaguely recall isolated reports of places like Detroit, Philadelphia, etc. tearing down more than trivial amounts of abandoned housing – thereby restricting supply and supporting price…a la cash for clunkers. But I don’t think this could have been happening on a massive basis without it coming to general attention.)
The long delay in the demographic housing crash is one of the truly under reported stories in housing finance.
“I vaguely recall isolated reports of places like Detroit, Philadelphia, etc. tearing down more than trivial amounts of abandoned housing – thereby restricting supply and supporting price”
Detroit may be a special case. Abandoned housing destruction was more of a sport, not a policy of supply restriction to support prices. There was a long tradition of burning abandoned buildings on Devil’s Night (the night before Halloween).
I’ve read that the problem is mostly solved now, though it’s unclear whether that is a result of city responses or the arsonists just running out of targets.
Why does this affect New England specifically?
Minneapolis is farther north than most towns in New England. And contrary to popular belief we actually have heat and electricity up this way.
NE would also fall, matter of time. We are biased to think that we are special, the forces which are acting on all over, won’t act on it and/or this time is different.
The new large house behind us in the saintly part of TPA bay area just went pending for $354/SF, about what the older houses in this hood had been selling for, so a good deal IMO.
It started out at about $515/SF when it was finished at the end of August…
Builders are looking for tearer downer in this immediate ”hood” as it is NOT in flood zone, near good schools, etc., with two others just demolished and construction started.
Perhaps we should tie home prices to government debt and inflation. Then you could say that home prices will come down when the US debt starts to get paid off. Home price increases are not profits, but rather a function of inflation. Pay off the debt, inflation subsides, and home prices decline.
Or just switch to the system used by Canada to make the accounting simpler:
“The mortgage term is the time your mortgage contract is in effect. Terms may range from a few months to 5 years or more.
At the end of each term, you’ll need to renew your mortgage. You’ll likely need multiple terms to repay your mortgage.”
North of Houston, Texas (Conroe.Willis, etc) Fall update:
1. Huge swaths of original forested plots continue to be cut down and the land graded for more new homes. I’m talking thousands of acres. (cut, sell lumber (mostly pine), grind up stumps and sell as mulch, strip native topsoil and sell that, and replace with 50% red clay and 50% sand)
2. Yesterday, I saw nine new home builder signs in one spot along a busy road in the area of the new construction…yes, nine.
3. Pricing is mid $100’s to $300’s for these starter homes. I just can’t visualize what one would get for a mid $100 K home in terms of quality.
4. Discounts abound at 10% off, 3.99% builder financing, $5,000 towards closing costs, etc. It’s crazy.
5. The homes are selling.
“I just can’t visualize what one would get for a mid $100 K home in terms of quality.”
The value of a typical house is zero after some decades, and it will be torn down eventually. Every dollar you spend on the building will go to zero a few decades down the road. Only the land has value then. When building a starter home, what matters is a low price that people can afford so they can live comfortably for 12 years or so in that place before they move (on average). I don’t know where this constant stuff about “quality” comes from while people bitch about the $500,000 homes not being affordable.
“The value of a typical house is zero after some decades”
I wish my city assessor agreed with you.
“I don’t know where this constant stuff about “quality” comes from while people bitch about the $500,000 homes not being affordable”
For people to hand over $400-500K on a house that might have gone for $150k in 2001, they have to have psychologically conditioned themselves into believing that the component parts/prices of that house somehow justify the tripling in price.
Otherwise it would just be the home builders having engaged in a mass financial r*ping powered by ZIRP.
People willing to pull the trigger at $450k cannot allow themselves to believe *that*.
So the folk belief arises that a $150k house *today* “has to be” some sort of roach motel crap shack made out of cardboard and Elmer’s glue.
Otherwise…what does that imply about the $450k *they* paid for *their* house?
Very few people think of land/housing in terms of demand. That’s really what drives the value.
At the core, it’s the same crap shack it was when it was built (builder grade garbage on a postage stamp lot). What has changed is the demand. The only thing keeping McDonalds from charging $15 for a Big Mac is demand (there is no demand for a $15 Big Mac).
I don’t doubt you (I’ve read similar stories elsewhere).
But then there is an interesting question…what is (sorta) keeping Houston apt rents propped up?
The Houston rents are coming down from pandemic spikes and Houston was never as bad as many other metros in terms of apt inflation.
But with a very real increase in affordable home supply ($150k – thank you Jesus and LGI), why would Houston not have fully unwound Pandemic hyper-housing-inflation (20%) and then some?
A huge population spike might explain it…but I haven’t heard anything remotely like that about Houston.
I would very very happily purchase a brand new $200k 2- or 3-bedroom home if it was available in Tampa. The problem is, builders can charge more here for various reasons (building codes, land costs, supply vs demand). As un-walkable as a lot of the Tampa metro is, it beats having to live 30-min out from downtown Houston as a <30 year old bachelor. Not to mention how zoned north Houston looks based on satellite imagery compared to where I’m living in Tampa.
I value the ability to walk to breweries and restaurants with neighbors and friends. Same with proximity to the Gulf, international airport, and ability to grow tropical fruits. A lot of other folks appreciate the niceties of Tampa. Hence higher prices. Thankfully prices are decreasing MoM and YoY as shown by Wolf!
To me, these charts are a clear indication that Federal Reserve actions have been solely responsible for the asset bubbles in housing since at least 2012.
From 2002 on, Fed policies have been the fuel (and let’s say 65%) of the entire reason that the US housing supply has been turned into an irrational, destabilizing casino.
The Fed would say they had their inescapable reasons, but every time the inevitable SFH bubble/bust process takes another big chunk out of US wealth, the phrase “Destroyed the village to save it” becomes impossible to avoid.
The Fed is out of rabbits and hats.
The housing trend direction seems to be set for now. Lower prices until we reach capitulation. Todays stock market may look uneventful but its at a critical inflection point, earlier this morning I would have called timber, but than buyers came and pushed back the tide. Maybe confirmation at close that risk on has switched to official risk off. Bulls are trying to keep it going for now. It’s almost like they are expecting some news to drop or more liquidity to become available or they are just die hard. Will watch wolf future articles about liquidity changes.
As a kind of visual person when I look at these charts the image that comes to my mind is that scene in a Terminator movie where Arnold is being lowered into the molten metal and, in a final gesture, gives a thumbs up.
What’s the general consensus of % decline when it comes to calling it a crash? Is it 30% or more? If that’s the case, unless turn around is right around the corner, that 20%+ in Austin will get us there pretty soon.
The trend with Austin is quite satisfying to see from someone sitting on the sideline by choice….now crossing my fingers with giant grain of hopium this is preview to SoCal market down the line.
I will share my delusional opinion, :) I think of it as duration and inflation, with enough duration inflation will capitulate the housing market. When the credit bubble finally breaks into more de risking, de valuation of liquidity assets, delisting , defaults. Housing was just one leg of a multi leg liquidity mop up instrument. I am in the secular camp 10 to 25 years to work it out like in 1929 or when the Nikkie bursted in late 80s. We have witnessed the biggest or one of biggest credit bubble in history to date. This will be a generational correction even with yield control attempts etc. the crashing yen will not prevent the global bubble from breaking. My guess is; all gains post Covid in housing is at risk of evaporation.
Who said there would be a crash? Ask yourself how easy it is to add new inventory in California. I live in the cheapest part of the state and new construction starts at 460k and that’s for a house with no dining room, a tiny kitchen and a backyard of nothing but dirt. In 2020 those same houses were 260k
i thought the same in 2006-2008.
Tons of MFR coming into market in CA. The CA market is one of the most abnormal one when it comes to affordability.
2006 – 2008? Don’t make me tab that board with this written largely in bold
“This time is different…”
CA is blessed by the greatest weather and coastline and agricultural valley in the entire empire of debt. it also was a literal gold rush from 1849 onward. i’ve lived in many regions of the empire. CA weather made it my time in the golden state, so great.
I believe a true crash is when the total cost of owning a house/mortgage is less than the cost of renting the same house.
According to Wolf’s excellent chart, this happened between 2011-2013. I know a few Millenials and Genx’ers who bought then. The rest were fearful after experiencing the 30-50% fall in house prices from 2008-2010. There was inverse FOMO during that time due to extreme fear.
When the cost of the home falls below rent, both investors and potential homeowners would be foolish not to buy. I wish I bought a second home then.
According to Wolf’s last chart, home prices would have to fall 35-40%, rent would have to increase 50+%, or a combination of the 2.
History may repeat itself but it may take a decade.
To clarify, rents follow income/wage inflation. Landlords raise rent to what tenants can afford monthly.
House prices track what people can afford over a 15-30-50? year period plus an added emotional amount(sometimes ignorance on true cost of ownership) and blatant greed that the value of a house will increase more than other investments.
If the emotional, ignorance, and speculative greed are removed, that is when house prices have crashed and it is time to buy. 2012 was a good year.
I recently appealed my assessment and settled with my city. I got it lowered from $434k to $425k – a $9k reduction, or approximately 2%.
I’d really like to see at least another 50k knocked off my assessment, although I think 75k is more reasonable. It’s a 960 sqft ranch from the 70s for crying out loud – no way it’s worth almost half a mil.
The next generation of homeowners really got the short end of the stick…
I would love to see these charts with volume sold or better yet total dollars spent since the price on the way up probably had high volume and the same price on the way down is probably low volume.
Prices lingering near the peak but on little to no volume would indicate how bad it might really be.
Sales volume has already crashed.
I have been noticing something interesting lately on a major real estate website – many homes for sale appear either 1) empty, or 2) virtually staged, which suggests they are empty, especially when a few rooms are virtually staged and others are completely empty.
I think that the number of empty homes and possibly foreclosed homes is much greater than we are being told.
We have estimates from the Census Bureau about how many empty homes there are, and there are a lot of them — 12.0 million housing units year-round vacant — some for sale, some not. And you’re seeing some of them.
We don’t need estimates for foreclosed homes; they are part of the legal and credit records, and we know how many households with foreclosures there are:
https://wolfstreet.com/2025/11/07/here-come-the-helocs-mortgages-housing-debt-to-income-ratio-serious-delinquencies-and-foreclosures-in-q3-2025/
Developers are land banking all sorts of properties because of loosy goosy multi family laws. Granny flats are going up like crazy especially in San Diego with their laws allowing tons of them on one property. The sb79 just signed allows 6 stories and such in residential neighborhoods. It’s a PITA to find a house you can afford in socal. I have a funny feeling you won’t be seeing much of a drop here for much longer .
With all these:
“Granny flats are going up like crazy especially in San Diego with their laws allowing tons of them on one property. The sb79 just signed allows 6 stories and such in residential neighborhoods.”
My gut feeling is more and more inventory coming to market and affordability is at its lowest. This is a recipe for prices going down. It happened before and it may happen again.
I don’t think this time is different.
Stock market and crypto are highly leveraged atm, if the crypto bloodbath escalates and we get a decent stock market pullback a lot of people will be feeling a less rich. I think that will trickle into housing since half the market is just psychological, few people think for themselves. FOMO on the way up, race to the door on the way down.
Also inventory should be up next year regardless because so many listings were pulled this year to wait for lower interest rates.
IMO the stock market could fall 50 pct and still be overpriced,
There is no way to rationalize the discrepancy between the ask and the bid within the context of the capitalist doctrine that insists that such an occurrence is impossible.
Here in Canada houses at the extreme level were $2.3 million now sell for $1.2 million and it is getting worse despite the Bank of Canada desperate attempt cutting the Bank of Canada rate from 5% to 2.25% in about 1.5 years.Alot of houses were in the $1.3 million now are lucky to be $750,000 to $825,000 after almost 4 years peak in 2022.
This time is going to be bad.I mean another 25% drop coming and condos in big cities in the GTA have seen prices dropped almost 40% to 50% and no buyers for 9 or 10 months sometimes.
Owning a home is not an investment but just an asset you can sell later.It is supposed to just give you inflation+ maybe 2% to 3% a year. So maybe 5% a year if at best.
It has so many expenses,costs,taxes,fees,hassles,legal,tax pitfalls,pain etc. to maintain,repair and keep up with that it is not there to make you a huge bunch of money.It is to not be renting save you that give you that.
I calculated it so many times, a 3.0% to 4.5% GIC,provincial bond over the years yielded much better returns especially in a RRSP,TFSA tax protected than any rental or real estate deal.We have averaged 4.20% yearly interest before compounding since 1990.I retired at 61 due to the savings in these guaranteed deposits and living within a decent lifestyle.
My wife never worked as I worked 40 years in construction,repair,maintenance and have 2 grown kids now.We live decent off $3,700 a month includes all our living expenses,income,property taxes etc. and we still $3,000 left over.We have no government,public sector pensions.I get my early CPP pension right now and that is it.
We were wise and disciplined enough to have just saved and accumulated our deposits year in and year out.We were both debt free by 38 and no more mortgage payments for decades now is the big key to be in decent financial condition.
We don’t believe in that a 7% to 10% yearly return over decades is a given and the risk looks to big for us.The central banks of the world and bankers have ruined the once savings and work ethic of citizens,workers by having to many decades of low interest rates.
Lower interest rates should be a short term thing maybe 1 to 2 years maybe every 6 to 7 years recession,downturn but not what they did since the mid 90’s.