Banks are mostly off the hook this time; risks were shifted to taxpayers and investors.
By Wolf Richter for WOLF STREET.
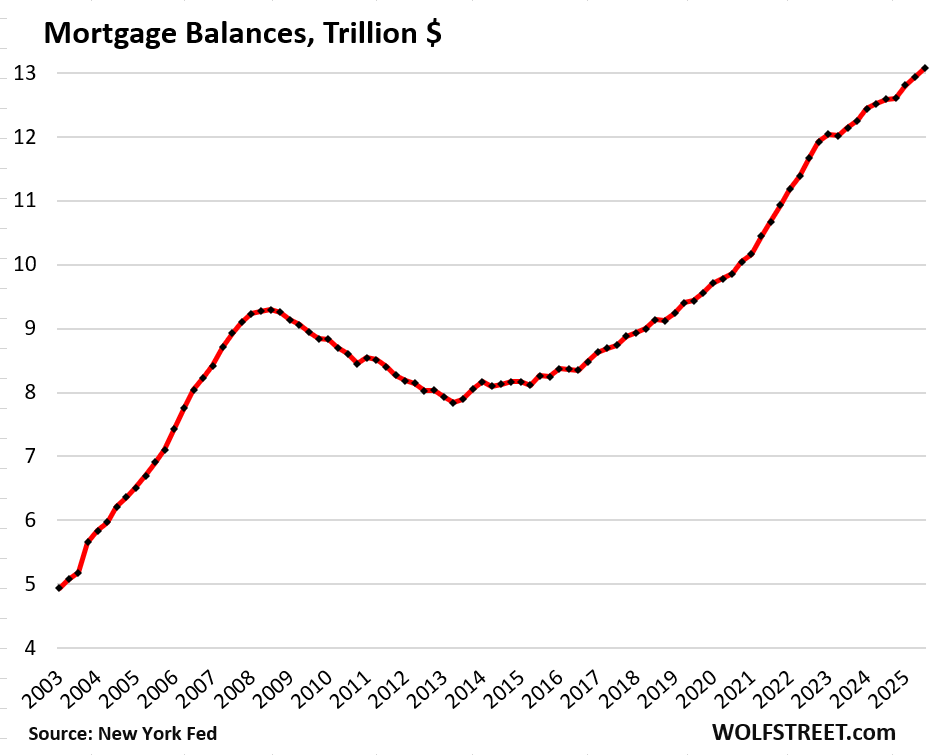
Mortgage balances rose by $137 billion (+1.1%) in Q3 from Q2, and by $482 billion (+3.8%) year-over-year, to $13.1 trillion, according to the Household Debt and Credit Report from the New York Fed, based on Equifax credit report data.
Growth in mortgage balances is a net of several factors, a significant one being the growth of the housing stock when buyers finance the purchase of newly constructed homes. Mortgage balances also increase, in terms of existing homes, by the difference between buyers’ new mortgages and sellers’ paid-off mortgages, if any (many sellers don’t have mortgages); balances also increase by the cash-out portion of newly refinanced mortgages and by new second-lien mortgages.
Conversely, mortgage balances are reduced by the principal portion of mortgage payments and other mortgage paydowns or payoffs; and by mortgage wrecks that cause mortgage balances to be written off – few of them currently, but a lot during the Mortgage Crisis:
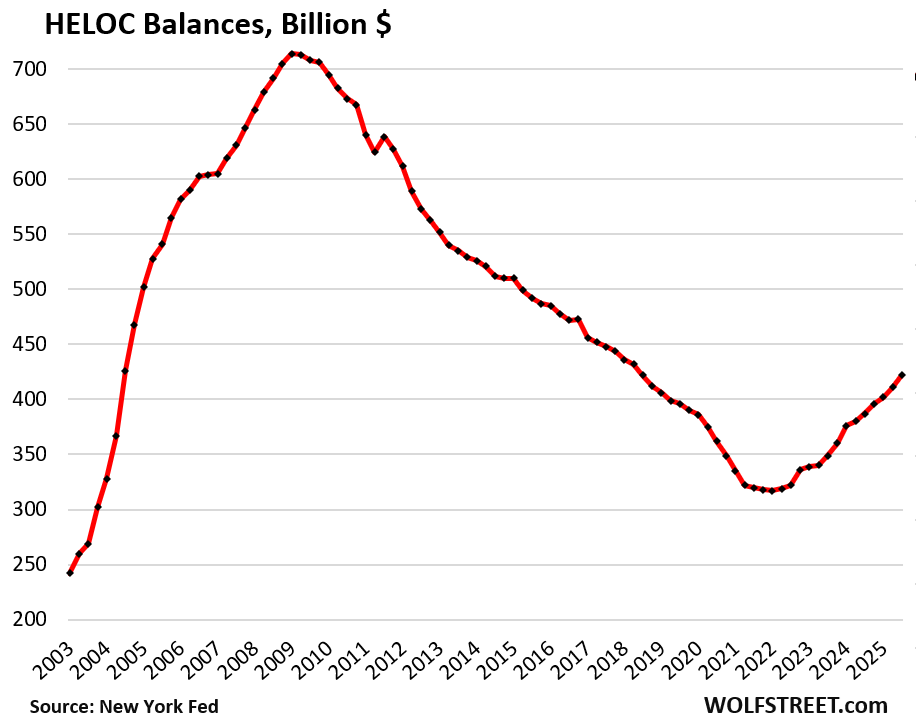
Here come the HELOCs: +33% since Q1 2021.
Balances of Home Equity Lines of Credit jumped by 2.7% quarter-to-quarter, and by 9.0% year-over-year, to $422 billion. Since the low point in Q1 of 2021, HELOC balances have surged by 33%.
HELOCs did some damage during the Housing Bust, and lessons were learned about their risks. But more importantly, mortgage rates plunged ever lower through 2021, and cash-out refinancings dominated the equity-extraction industry. As a result, HELOC balances declined for 13 years.
Despite the 33% surge off the 2021 bottom, HELOC balances are still relatively low. HELOCs are lines of credit, and many of them are unused, just sitting there as a standby source of funding. But the balances here are actual balances drawn on HELOCs:
The risks of HELOCs involve that second lien they put on the home. If homeowners default on the HELOC while keeping the first-lien mortgage current, they can still end up in foreclosure.
Also HELOCs are full recourse even in the 12 states, including California, where nonrecourse mortgages are standard, and where lenders, after a foreclosure sale, cannot pursue former homeowners with deficiency judgements on the first-lien mortgage. But they can pursue former homeowners for the balance of the HELOC.
And HELOCs come with higher interest rates as lenders face the additional risks that come with second-lien mortgages, as the holder of the first-lien mortgage gets paid first in a foreclosure sale, and often there is nothing left over for the second-lien holder.
On the plus side for the borrower: HELOC interest rates are a lot lower than interest rates on credit cards or personal loans, and can even be lower than unsubsidized auto loans.
And homeowners can use it as a stand-by line of credit with no balance and no interest cost (though fees may apply), to have instant access to the cash, if suddenly needed, at a lower cost than borrowing on their credit cards. This includes people with substantial investments who don’t want to sell those investments to fund other projects.
The burden of housing debt: Housing-debt-to-Income Ratio.
The debt-to-income ratio is a common way of evaluating the burden of a debt. With households, we can use the debt-to-disposable-income ratio.
“Disposable income,” released by the Bureau of Economic Analysis, includes income from all sources except capital gains, minus payroll taxes: So income from after-tax wages, plus income from interest, dividends, rentals, farm income, small business income, transfer payments from the government, etc. It roughly represents cash flow after payroll taxes that is available to spend on the costs of living and debt service.
Due to the government shutdown, the BEA has not yet released disposable income for September. To get Q3 disposable income, we can use the data for July and August and estimate September based on average growth year-to-date.
The housing debt for this ratio includes mortgage debt and HELOC debt.
The housing-debt-to-disposable income ratio in Q3 inched up to 58.6%, just a hair higher than in Q2, which had been the lowest on record, except the four quarters during the pandemic when stimulus funds distorted household incomes into absurdity.
It’s glaringly obvious what led to the Mortgage Crisis that was a big part of the Financial Crisis: Households overindebted themselves with housing debt. By Q1 2007, the housing-debt-to-income ratio exceeded 90%!

Who’s on the hook this time?
Among the most important changes resulting from the Financial Crisis was the transfer of mortgage risk from banks to taxpayers. There won’t be another mortgage crisis for banks. They’re largely off the hook.
Banks and credit unions are on the hook for $2.7 trillion in mortgages, HELOCs, and second-lien mortgages, according to Federal Reserve data on bank balance sheets. That amounts to only 19.7% of the $13.5 trillion in mortgage and HELOC debt.
The government is on the hook for $9.1 trillion of single-family mortgages that were securitized into MBS and sold to investors, according to Ginnie Mae data. If borrowers default, the government eats the loss. For investors, these MBS have a similar near-zero credit risk as Treasury securities. The investors include bond funds, pension funds, the Federal Reserve ($2.1 trillion and shrinking), banks, mortgage REITs, etc.
And subprime-rated mortgage debt is insured by the government through the FHA.
The share of government-guaranteed single-family mortgages outstanding:
- Fannie Mae: 38.6%
- Freddie Mac: 33.1%
- Ginnie Mae: 28.3%
Investors are on the hook for $1.7 trillion of residential mortgages, such as jumbo mortgages that didn’t qualify for government backing. These mortgages have been packaged into “private label” MBS and sold to institutional investors around the globe, such as pension funds and bond funds. It’s these investors that carry the credit risk for those mortgages. Banks are off the hook.
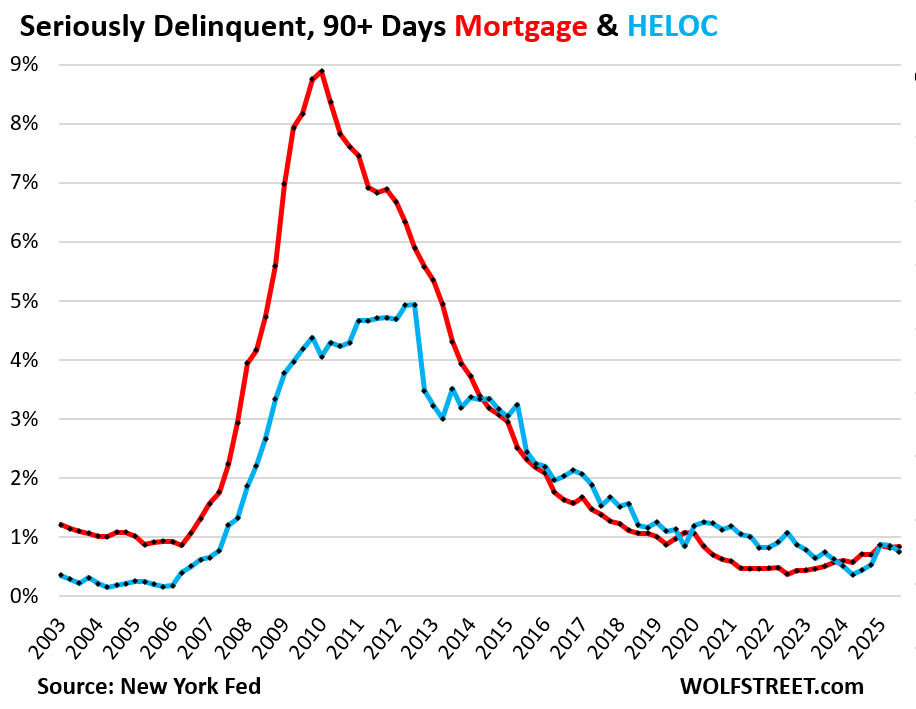
Delinquencies and foreclosures dipped and are low.
Serious delinquency rates – 90 days or more delinquent – were unchanged for mortgages at 0.8% (red in the chart below) and edged down for HELOCs to 0.8% (blue). These are very low delinquency rates.
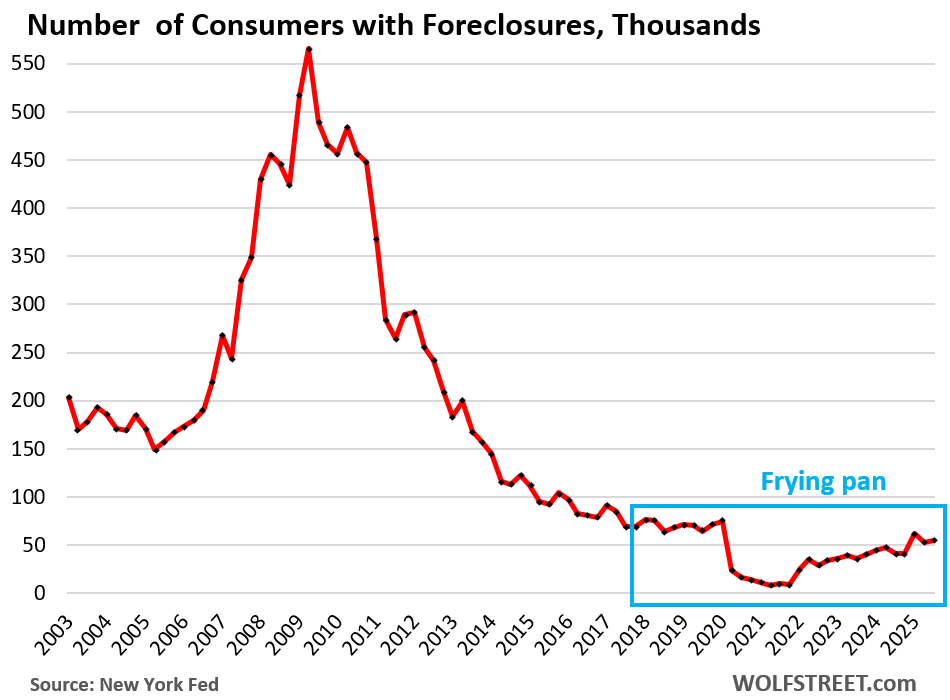
Foreclosures are very low. The number of consumers with foreclosures in Q3 rose to 54,760, well below the low end of the 65,000-to-90,000 range of the Good Times in 2018-2019, and far below the number of foreclosures in prior years.
The infamous frying-pan pattern, as we call it here, was formed as a result of the era of mortgage-forbearance and foreclosure bans, when foreclosures were essentially impossible and foreclosures fell to near zero; and then, as rules loosened, foreclosures began to edge higher from those near-zero levels but remain well below the prior times. The resulting line of this drop and then the rise looks like a frying pan. This frying-pan pattern has cropped up in a lot of delinquency charts as well.
And in case you missed it yesterday: Household Debts, Debt-to-Income Ratio, Delinquencies, Collections, Foreclosures, and Bankruptcies of our (not so) Drunken Sailors in Q3 2025
Enjoy reading WOLF STREET and want to support it? You can donate. I appreciate it immensely. Click on the mug to find out how:

![]()
Good report. We know how this story will end. There are already almost half a million 1-4s underwater. When the correction really gets rolling, there will be millions.
People who have a 3% mortgage or even an under 4% mortgage don’t really care about being underwater on price. They’re going to protect that mortgage like a gift from God.
It’s the people who bought at a high price with a high rate over the last two years… and there aren’t all that many of them. But even they will keep making their mortgage payments unless they lose their jobs for a long time and run out of money. And we aren’t there yet.
Believing low interest rates are a gift from god shows just how delusional people are these days. Bragging about paying interest on something you can’t really afford, such idiotic clowns.
Seems like folks can afford these mortgages given the low foreclosure rates.
Given the very low foreclose rate, seems like people can afford their homes.
I didn’t see short’s post above mine a few minutes ago. Please delete mine above.
Anthony A.
No. Nailed twice holds better.
Must be nice to be rich, Doug
Well put. Thank you for being real!
“almost half a million 1-4s underwater” Source, please?
Wonder what the debt to income looks like for just households who bought since mortgage rates went back to normalish.. have to imagine that’s the forward looking picture at this point. Well offset currently by purchases pre 2023.
Some households have zero debt and some households have lots of debt and some household have moderate amounts of debt. And there are always some who default on their mortgages. That’s always the case and not new. It’s only the household with lots of debt that are at risk. That has always been the case.
But when you want to know whether something can damage the economy overall, you need to look at the aggregate debts and aggregate incomes. And you can see that the economy overall was getting pushed into trouble in 2005-2007 by this explosion of mortgage debt that far outran income growth.
So when housing price went up 40% in 5 year period while income only went up 25% (15%? I am not 100% on this # based on the stats I read), is this an indicator of pre-trouble phase? We all know it is housing bubble 2.0. The question is when it will burst.
It is said that 62% divorce rate in 🍊 county CA. # of married couple vs # of homes they own is 1:2 ratio. I wonder whether two homes for each married couple & divorcee are the reason home purchase (demand) has sustained so far aka price has not only sustained but also gone up 🧐
This housing bubble was so fast and furious (50%+ in many markets in 2 years) that actually most homeowners bought before it and benefited from the high prices and still own those homes; and only a relatively small number of buyers bought afterwards at high prices.
Home prices are going to come down because they’re too high and don’t make sense. And as they come down, incomes rise, and after some years, maybe lots of years, they start making sense again.
So it’s only the relatively small number of buyers who bought during and after the price explosion that are at risk, and most of them will be fine. And the banks are not on the hook. So that’s not a scenario that will take down the economy or the banks.
“Home prices are going to come down because they’re too high and don’t make sense.”
Not if Trump pulls the ace out his sleeve. The Ace being 50 year mortgages lol.
Everyone buys on monthly payment. My landlord’s kid is working up to 5 hours away out of town making 25/hr. Some weeks he has no work. At best he can get 30-35 hours in winter. He just financed an 80k dollar denali sierra truck. He’ll often drive 700+ miles in a week. 5 years from now he’ll have a new brodozer once again, this time with a 15 year mortgage… Er… I mean car payment.
Trucker Guy
“Not if Trump pulls the ace out his sleeve. The Ace being 50 year mortgages lol.”
No. I know mortgage math is hard. And people cannot do it. But that 50-year mortgage won’t change anything except rip off borrowers even more.
For two reasons:
1. you can already get an interest-only mortgage, which is very similar to a 50-year mortgage, and your entire mortgage payment is interest, but you pay a higher interest rate. And with a 50-year mortgage you will also pay a higher interest rate than for a shorter term, and for the first 10 years, nearly your entire payments go to interest, so it’s very similar to the already existing interest-only mortgages.
2. In terms of the payment, the difference is small. Mortgage math applies. The difference on a $500,000 mortgage is $168 per month, going from a 30-year mortgage at 6.2% to a 50-year mortgage at 6.7%.
I assumed a 50-basis point higher mortgage rate for a 50-year mortgage, based on the current rates (Freddie Mac average) for a 15-year mortgage = 5.50% average, and a 30-year rate = 6.22%. What, you didn’t know that the average 15-year mortgage is 5.5% while the average 30-year is 6.2%?
50-year, per month: $2,894 at 6.7%
30-year per month: 3,062 at 6.2%
Difference: $168 per month.
But you make 20 years of interest payments extra for this. Do the match! You will pay a freaking fortune to the banks. And if you sell your home after 10 years, you still owe nearly the entire 50-year mortgage balance. Talk about being stuck in a house!
If you want to starve your banker, get a shorter term mortgage, such as a 15-year. It is because of this math that in the late 1980s when I got a mortgage, with interest rates higher than today, I chose a $15-year mortgage. Slightly higher monthly nut, but substantially lower rate and half the mortgage payments over the life of the mortgage! The problem with a 30-year mortgage is that the first many payments are nearly all interest, and very little principal. A 50-year mortgage is even worse; for the first two decades, it’s similar to an interest-only mortgage.
Basically, housing wont be affordable for a long time unless the Socialist American govt plays tricks like they did in 2008 or Pulte’s recent idea of having 50 year mortgages. Socialism for the asset owners & capitalism for the rest. Funny how some Americans call others socialists or communists derisively.
Rentoid
“or Pulte’s recent idea of having 50 year mortgages.”
I know mortgage math is hard. And people cannot do it. But that 50-year mortgage won’t change anything except rip off borrowers even more.
For two reasons:
1. you can already get an interest-only mortgage, which is very similar to a 50-year mortgage, and your entire mortgage payment is interest, but you pay a higher interest rate. And with a 50-year mortgage you will also pay a higher interest rate than for a shorter term, and for the first 10 years, nearly your entire payments go to interest, so it’s very similar to the already existing interest-only mortgages.
2. In terms of the payment, the difference is small. Mortgage math applies. The difference on a $500,000 mortgage is $168 per month, going from a 30-year mortgage at 6.2% to a 50-year mortgage at 6.7%.
I assumed a 50-basis point higher mortgage rate for a 50-year mortgage, based on the current rates (Freddie Mac average) for a 15-year mortgage = 5.50% average, and a 30-year rate = 6.22%. What, you didn’t know that the average 15-year mortgage is 5.5% while the average 30-year is 6.2%?
50-year, per month: $2,894 at 6.7%
30-year per month: 3,062 at 6.2%
Difference: $168 per month.
But you make 20 years of interest payments extra for this. Do the math! You will pay a freaking fortune to the banks. And if you sell your home after 10 years, you still owe nearly the entire 50-year mortgage balance. Talk about being stuck in a house!
If you want to starve your banker, get a shorter term mortgage, such as a 15-year. It is because of this math that in the late 1980s when I got a mortgage, with interest rates higher than today, I chose a $15-year mortgage. Slightly higher monthly nut, but substantially lower rate and half the mortgage payments over the life of the mortgage! The problem with a 30-year mortgage is that the first many payments are nearly all interest, and very little principal. A 50-year mortgage is even worse; for the first two decades, it’s similar to an interest-only mortgage.
Many years ago I worked for a company that provided software for mortgage companies.
Even for people in the mortgage industry, some of these concepts are a little bit elusive.
No real substitute for looking at an amortization table that breaks out principal and interest portions of the payment and comparing some options if somebody isn’t an expert and really wants to wrap their arms around this stuff.
According to the YouTube, everyone is just going to pay off their 30 yr in 3-5 years by getting a HELOC and using some razzmatazz known as velocity banking. What could possibly go wrong with that?
Maybe people whom own houses but have SNAP will have to stop paying their mortgages to buy food.
Also not sure if Walmart has had their earnings call or not recently, but no SNAP and Walmart earnings are going to be abysmal.
While there are homeowners with mortgages on SNAP for sure, primarily they are renters. That doesn’t dismiss there may be earning impacts but of course need to figure out where the courts settle on that matter and how society supports the most needy while an inept government fails them.
Didn’t realize food came from the government or that it was DC et al’s responsibility to feed people.
Learn something new every day (I guess?)
Joshua S Barnett
But it’s OK for the government to give Intel $20 billion?
Joshua S Barnett,
Well, ideally the government is of the people, by the people, but I understand the disconnect since that really has never been the case.
Wolf – how, in a sane world, could ‘entity A’ engage in a financial transaction, and transfer the RISK to ‘entity B’ (Tom, Dick, Harry and Sally).
In this case, entity B is all of us working people.
We had NO PART in the financial transaction and did NOT sign up for this. I call foul ‼️‼️‼️
This IS going to translate into real world losses.
Have you looked into your 401k, or pension, rights? When you sign the papers to allow financial analyst to control your return – you signed up for those very decisions.
Ah! The illusive “investors”…
“Americans had $12.2 trillion invested in 401(k)s and $16.8 trillion in IRAs in the first quarter of 2025, according to the Investment Company Institute. “
What’s your point?
Congress and the presidents, who are elected by the voters, appoint and confirm the federal reserve members. There are also many state laws such as several that just passed in Texas, that support high housing prices, So we have had a say many times in the past, we had a say last Tuesday, and we’ll have a say at the next election to vote for the only choice, Libertarian, for balanced budget, but so far, 99% of voters continue to elect the Rs and Ds, who support and carry out these policies.
What “state law … that just passed in Texas, … support high housing prices” ?
Tidbit: Allan Merrill, CEO of Beazer Homes, said in a recent interview: “Speaking on a panel at ResiDay, a residential real estate conference hosted by ResiClub, Merrill talked to the outlet’s editor, Lance Lambert… [Merrill] thinks the market has to “grind back … I think it’s a multi-year period of sort of trying to get back to a more normalized affordability environment.””
I’m a little skeptical of the debt to disposable income charts. The Fed used to have something called the FOR (Financial Obligation Ratio), defined as “Household debt service payments and financial obligations as a percentage of disposable personal income; seasonally adjusted.”
They discontinued it in 2024, but always also warned about it while publishing it: “The Board decided to stop publishing the FOR due to a lack of high-quality data on property tax and homeowners’ insurance payments. They still publish the household debt as a percentage of disposable income which is listed here.
I see the ever increasing debt in the NY Fed report on household debt and credit; I know there are increasing households which might be a factor. But a rougher indicator (but also another angle) would be simply the ratio of total household debt to number of households. A number with less transformations to obtain and perhaps less error.
1. Your last paragraph: I explained to you where the increase in the debt comes from in paragraph #2 and #3. Do the math yourself. 1 million new single-family homes and condos per year. Plus the other stuff I said.
2. Debt-to-income ratios are a classic measure of debt sustainability, and it is one of the things used when qualifying for a mortgage.
3. The thing you cite “FOR (Financial Obligation Ratio)” IMPLODED because it was so bad, and the Fed stopped producing it. And then it came up with a new thingy recently, and maybe it’s better or maybe it’s even worse. It’s nearly impossible to measure debt service expenses accurately.
In addition: mortgage rates are mostly fixed in the US and so debt service expenses overall doesn’t change that much because only a small portion of homeowners get a new mortgage in a year. You can see how slowly the portion of 6%+ mortgage rates has risen in three years, and 5%-6% hasn’t changed at all.
https://wolfstreet.com/2025/09/29/the-lock-in-effect-and-mortgage-rates-update-on-unwinding-a-phenomenon-that-wrecked-the-housing-market/
I am curious as to the impact of baby boomers not selling unless they have too in the next ten years vis-a-vis these factors now evolving. It seems that things will not really get going until those in properties like mine will finally cash out. In Riverside, Ca the million dollar homes are not selling like my my neighbor at 999K. The competition is going even lower to compete which gives a whiff of coming desperation. The flippers showed up at the first open house and nothing more….
My mortgage is at about $2,300 everything included whereas my neighbor is selling a home that will cost 6K monthly with all included not factoring the huge landscaping bill to come with giant trees all over.
I am one who does not worry about price as in most scenarios I have other factors at play. It seems the real estate market is like when you go sailing in waters where the riptide changes the typical patterns of an area you sail often. You set tack but the rip tides rule…
I purchased my first home on the CA central cost in 2009. Did not want to try and afford before, because it was way too expensive for me.
I am not wealthy, so bought the home buyers for dummies book. I was my own realtor, and mortgage broker (I now know why people pay mortgage brokers) haha. Saved a grip of money though. I was also my own update/ remodel contractor.
If I remember correctly, that edition of the Dummies book stated to not bank on any home equity until at least the 15 year mark.
Of course this was before all of the distortions. Anyways, I put some work and was there almost 17 years, and it worked for me.
Hard ass work, persistence, not following the crowd, and most important “patience” is key in my humble opinion.
VERY good post IMVHO Huck!
WE, in this case my beloved spouse and I , did almost the same, but started in 1999 to build our own home, from scratch on a hill that had been cleared for pasture by the previous owner…
Years later, when her parents needed her help to both stay alive and stay out of the old folks home, (and both died 93+,, ) and I was certainly getting SO burnt about mowing so many acres and weed eating more than a mile of fence, we sold to a wonderful family…
GREAT post Huck, and I hope you will continue to inform all on Wolf’s Wonder, (which
btw is one of the very few I support with my SS only income $$)…
See it’s like field of dreams “if you build it they will come”
So you must build old folks homes for the boomers.
Lots and lots of them, with plenty of pickleball and apps to complain on. Also some simulators for “karening out” and ones with lines of people they can complain to.
Also give them lots of rules they can complain about constantly. These rules will not be real but they don’t know that.
I do not pickleball….haha.
Not a boomer either. Gen X they call me I guess.
And for the most part try to not complain and just figure it out.
Does anyone collect data on the aggregate amount of equity homeowners have? Or a distribution curve of equity? So, can we predict whether foreclosures would result in losses for taxpayers, investors, etc.?
I note that in 2007, the losses on the bonds were not due to foreclosures, but to foreclosures without sufficient value in the properties to cover the remaining debt.
If current homeowners have enough equity that the loans will be fully repaid after a foreclosure sale, then there is no society-wide crisis. The homeowners who lose their equity to losses will be upset, but none of the banks, taxpayers, or investors will be worried about a ~3% loan being repaid in full so they can reinvest at higher interest rates.
However, I don’t know where to find such equity information.
The problem with that analysis is that if there were to be a major uptick in the number of foreclosures, it would probably be because of poor economic conditions. So you’d have an increase in supply, and a decrease in demand. That would cause prices to drop, and suddenly, the equity position of most homeowners would no longer look quite as good.
Homeowners currently have plenty of equity provided that any foreclosures are basically one-offs, and the general economy and consumer remains healthy.
That’s the problem with prices, and equity calculations, being set at the margins.
I’m still wondering just how many homes are having to be dumped in 25′ or 26′ over the forbearances coming due. There are a LOT of homeowners that took the forbearances during COVID and have to come up with $10k’s to pay year’s worth of interest to keep their mortgage in good standing. I’ve heard from some in realty that the savvy are house-swapping before the bill comes due because they can’t afford it and their only real option is going back to ‘zero’ in a new home. This could cause a ‘hiccup’ in foreclosures from Q4 25′-Q4 26′.
1. Covid forbearance is not an issue anymore. Nearly everyone exited covid forbearance by 2023 as most people refinanced into lower rates in 2021/2022, some with cash-out, given the spike in prices, and exited forbearance by paying off the old mortgage.
2. generally, accrued interest is added to the loan balance in most forbearance agreements, thereby increasing the remaining balance and lengthening the term of the loan. No lumpsum payments are needed.
3. Forbearance is a standard tool to deal with natural disasters, such as hurricanes, wildfires, etc. And there are always some mortgages in forbearance.
But what did happen during Covid was that these forbearance deals and foreclosure moratoriums caused foreclosures to drop to near zero. What’s hitting foreclosures now is not those old forbearance deals.
Consumers with foreclosure are low. Serious delinquencies is low. Mortgage and Heloc debt/Disposable income is 60%. Only 40% for the rest. Since the rest: car payments, insurance, maintenance, taxes, school, food… cost much more. Consumers are squeezed. Investors might sell their positions in co with market cap between $1T and $5T. Thus they will have enough money to pay debt and have fun. Higher realized gains taxes, payroll, TGA, $3T of unused credit [$41.1T debt ceiling minus $38T gov debt], tariffs, lower interest rates.. SPX might have its first lower highs/ lower lows since 2020, without recession. The gov can function without Chucks approval or permission. Trump can allocate funds as he wishes. He can cut pet projects. He doesn’t need them, but he will open the gov, have mercy on Obamacare, the hungry children ==> bc he isn’t a king !
“Mortgage and Heloc debt/Disposable income is 60%. Only 40% for the rest.”
No, that’s NOT what the housing-debt-to-disposable-income ratio says. That’s not what ANY debt-to-income ratio says. These ratios divide the debt amount (not payment amount) by annual income. It does not show what portion of monthly income goes to debt payments; but it shows the debt amount in relationship to their income.
When I see charts showing dollar amounts starting with your first (Increase in mortgage balances 2003 to 2025) my first question is: are these in constant (inflation-adjusted) dollars or in nominal (unadjusted) dollars?
Wolf, it would be great if you could clarify now and footnote charts in future to remove all doubt. Thank you.
1. That is why I gave you chart #3, debt-to-disposable income, where an inflation adjustment would cancel out because it would be both in the numerator and denominator, but you accidentally microwaved your brain this morning, and AI ate your glasses, and a piece of crypto got stuck in your throat, and so you didn’t see anything at all except for chart #1.
2. There are key reasons why dollar charts should not be adjusted for inflation because it will give you the wrong dollar amount for the current year. For example, “Real” GDP is inflation adjusted via 2017 dollars. So the annual rate of “real” GDP in Q2 was $23.7 trillion. But not adjusted for inflation, actual GDP (“current dollar” GDP) was $30.5 trillion. So if you look at the inflation-adjusted GDP figure in dollars, you have no idea how big the US economy is. You’re off by $7 trillion! This is why debt dollar figures are never adjusted to inflation because inflation adjustments turn debt figures into lies! Including the $38 trillion in US Treasury debt. Got that? (if not, un-microwave your brain and try again)
Wolf – I’m gonna take a nap. Would you wake me up when the median price in San Fran is $300K?
😴 😁 🙏. I’m interested in a waterfront property, or at least a darn good view. Thanks!
I see a lot of these Wolf articles demonstrating how the banks aren’t “on the hook” which is a relief from a systemic point of view, but is there any danger to the banks via counterparty risk in their relationship with the entities that ARE “on the hook?”
Counterparty risk is not an issue in the case of mortgages that were securitized. They were sold to US government entities or to investors.
The only risk is that a bank may be forced by the GSE to buy back the mortgage or make a make-whole payment, upon review by the GSE, if the mortgage shows “significant defects, significant underwriting deficiencies, a breach of a selling representation or warranty, or a breach of the terms of any applicable contract provision,” as per Fannie Mae. “These reviews may result in loan repurchase demands, make whole payment demands, or other alternative remedies.”
This stuff happens occasionally, but those are individual mortgages that amount to only a small percentage of total mortgages originated by that bank.
https://selling-guide.fanniemae.com/sel/a2-3.2-01/loan-repurchases-and-make-whole-payments-requested-fannie-mae
From personal experience: Back when dirt was young and I was running a big car dealership, we were occasionally forced to buy back an auto loan from one of the lenders because it had some “significant defect,” such as fake documents, and the guy essentially stole the car. It was rare because we had safeguards in place, but it did happen in the heat of the battle. We reported this to the police and moved on. If you’re reasonably careful, it’s not a risk that will take the company down, it’s just part of the cost of doing business.
This is helpful, thanks. It always find it challenging to map out which actors in the system are connected to one another and the potential vectors of contagion.
In this case, contagion, if any, will hit taxpayers. But they don’t seem to care.
I keep hearing that home owners with low rate mortgages aren’t changing homes, newer, bigger, smaller or location because a new mortgage would have a higher interest rate no matter the price. This article shows that the foreclosure rate is very low meaning they have ample money for housing or they are redirecting it from some other expense. Could it be that instead of spending additional income for a different home it is feeding the stock market?
This comment is not on housing etc, specifically, but on the economy on which all including housing depends. In a piece on site ‘Futurism’, Kuppy Kupperman, of Praetorian Capital concludes that the largest wager ever made, the one on AI data centres, cannot possibly achieve a positive return. He met with a lot of folks in the industry, who themselves are privately negative, before revising his already negative view to one much more so. Worth a look.
Yes. I’m on Kuppy’s email list, so I got that report when it came out some time ago. As everyone knows, it’s a bubble — and Kuppy put some numbers to a portion of it — and it will implode, and lots of investors will lose lots of money, and no, it’s not different this time, but AI will thrive and become commoditized and go into everything, including your toaster, just like the internet thrived and became part of everything after the Dotcom Bust.
I have long said that when the AI bubble implodes, that’s when we will finally get a recession, a brief run-of-the-mill recession like the recession that occurred during the middle of the Dotcom Bust.
I agree that the ‘generative’ AI bubble pop will trigger a recession. The top 10% responsible for 50% of expenditures will pull back including on housing which will cause sharper price falls.
I disagree that ‘commoditised’ generative AI with all the investment in LLMs will add much or anything after the ‘pop’. There is absolutely no requirement for generative AI in a toaster! However non-generative AI will continue to provide real benefits and investments will be rewarded, but that is not where the billions are being wasted by the likes of OpenAI.
There is no requirement for semiconductors in the toaster. And for many decades, toasters worked just fine without semis. But a few decades ago, suddenly they all started coming with semis, and look what a toaster can do now. With AI in the toaster, you could give your toaster a voice command, such as: “Make the toast like you did last Sunday, that was wonderful.” And a sultry female toaster voice replies: “No problem, honey, my pleasure. Do you want a kiss with that, or plain?” People would be instantly hooked and sales would skyrocket…
American consumers are all about “wants” not “needs.”
There was never any requirement for the internet either, which is why lots of people pooh-poohed it early on.
Nor was there a requirement for electricity in the household or anywhere else. The world worked just fine without it. And when someone came along with a primitive but functional system, many people pooh-poohed it.
I love technology, but I’d pay extra for a toaster that DOESN’T talk to me.
The charts look rosy. No where near the crisis of 2008.
There will be fraud, over hyping, overselling, and over optimism in AI, like
almost every other tech advancement bubble. 80%-90% could be all
bullshit, BUT it does not matter. The 10-20% of pure tech advancement and
productivity will outweigh anything that was invested.
Yes, most people will lost their shirts and some will make out like bandits.
But the technology advancement and productivity will encompass and
envelope the entire world. Yay for humanity? We shall see. Good luck.
What is crazy is home ownership for families in Poverty (below $30k) have a home ownership rate of 47%. It is now at the same rate as it was during the HB1 peak. It thought it would be much lower considering affordability concerns.
The chart is a bit old (2023) but it went from 41% in 1995 to 47% in 2005. Then it dropped YOY to 42% in 2015. But that was the bottom and was rising YOY to 47% in 2023.
This was a report from the Minneapolis FED site.
Wolf – the same data from ychart is off by 10x.
https://ycharts.com/indicators/us_household_mortgage_debt_service_payments_as_a_percent_of_disposable_personal_income
The number there ~5.84%. I’m sure that’s not possible that < 6% of disposable income is going to mortgage. What am I missing here?
1. This is NOT the same chart. READ what it says. It says: “US Household Mortgage Debt Service Payments as a Percent of Disposable Personal Income”
— “Debt services payments” = annual mortgage payments.
— What I gave you is total mortgage BALANCES as percent of disposable income.
2. The YCharts link you posted is for the Federal Reserve data that was so bad that the Federal Reserve scuttled it in 2024. Which is why that data ends in Q1 2025 (look at the chart you posted). The Federal Reserve has now come up with a new method (it comes with a higher percentage), but I don’t know if it’s any better.
Googling around digging for stuff you don’t understand and don’t even read and then posting it here is one of the seven deadly sins of commenting. There is too much BS on the internet, and too many people who can’t read, for me to debunk it all.
A little late here.. Thanks for the clarification.
It’s hard to believe that 58.6% disposable income in one year can knock-off the entire mortgage+HELOC balance.
I assume that’s the wrong way to interpret the data as the disposable income component includes all households that are mortgage free as well. Secondly, that data is going to be skewed from the likes of ultra wealthy.
It would still be more interesting to know the debt-to-income ratio for only those who have a mortgage.
P.S. – I DDG, came off Google long time ago. Thank you for reading your readers comments.
When you look at the economy overall, at risks in the economy overall — that’s what we’re doing here — you cannot look at one household’s mortgage.
You need to understand that 40% of homeowners own their home WITHOUT mortgage. And another big chunk of homeowners have made lots of payments over many years, and their remaining outstanding balance is small. That’s always the case. Only recent buyers have high mortgage balances, but “recent buyers” is just a small percentage of homeowners.
“The government is on the hook for $9.1 trillion…”
We live in a massive Nanny Socialist Crony Corporatist Police State.
Car trouble
‘British lender Lloyds Bank will also report next week, having just announced a new £1.95 billion hit to its balance sheet following a regulatory ruling over the mis-selling of car finance loans. The Financial Conduct Authority estimates the scandal will cost U.K. lenders up to £11 billion.’
Jees. For some reason I associated sub- prime car loans with the ‘go go’ US.
Thought the UK banks would be more conservative.
“mis-selling” of loans isn’t subprime-related. It’s a wrong that Lloyd’s committed.
Shoulda seen it
Why are so many people so obsessed with taking on even more debt?
Many people have the expectation that the U.S. debt will grow to crisis proportions, sometime in the next 10 years. For example, John Mauldin predicts sometime between 2028-2032.
Chances are, that inflation will be involved in resolving the debt.
People who have high fixed-rate debt on long-term assets (such as house mortgage) will improve their financial position more than anyone. The next beneficiaries will be people who outright own the long-term assets, such as precious metals or houses.
The biggest losers will be holders of U.S. Treasuries. No tears here from me on that, the holders of U.S. Treasuries are mostly wealthy people who have benefitted greatly by the Fed’s money-pumping scheme over the last 70 years, and also federal employee pensioners who have become the highest paid workers in America.
Maybe it wasn’t about subprime but misleading ads? But where does the huge loss come from if not sour loans ?
Nick,
The UK car finance mis-selling scandal is massive and widespread.
For many years (possibly since 2007) millions of car buyers were unwittingly signed up to poor value loans.
These loans were good for the banks, who profited from higher interest rates; and good for car dealers, who profited from higher commissions.
Consumers simply thought they were getting the best deals available.
As you say, a staggering sum of money is involved. Putting right all the wrongs may potentially destabilise the UK’s entire consumer finance sector, so that could be tricky.
The UK Supreme Court has been involved, which is the legal ruling you referred to, and what currently seems the most likely outcome is: a scheme will be set up for the banks to pay compensation to consumers.
No-one seems to be going after the car dealers.
Maybe the banks have plans to get even with them later? :-)