But debt and interest expense don’t exist in a vacuum.
By Wolf Richter for WOLF STREET.
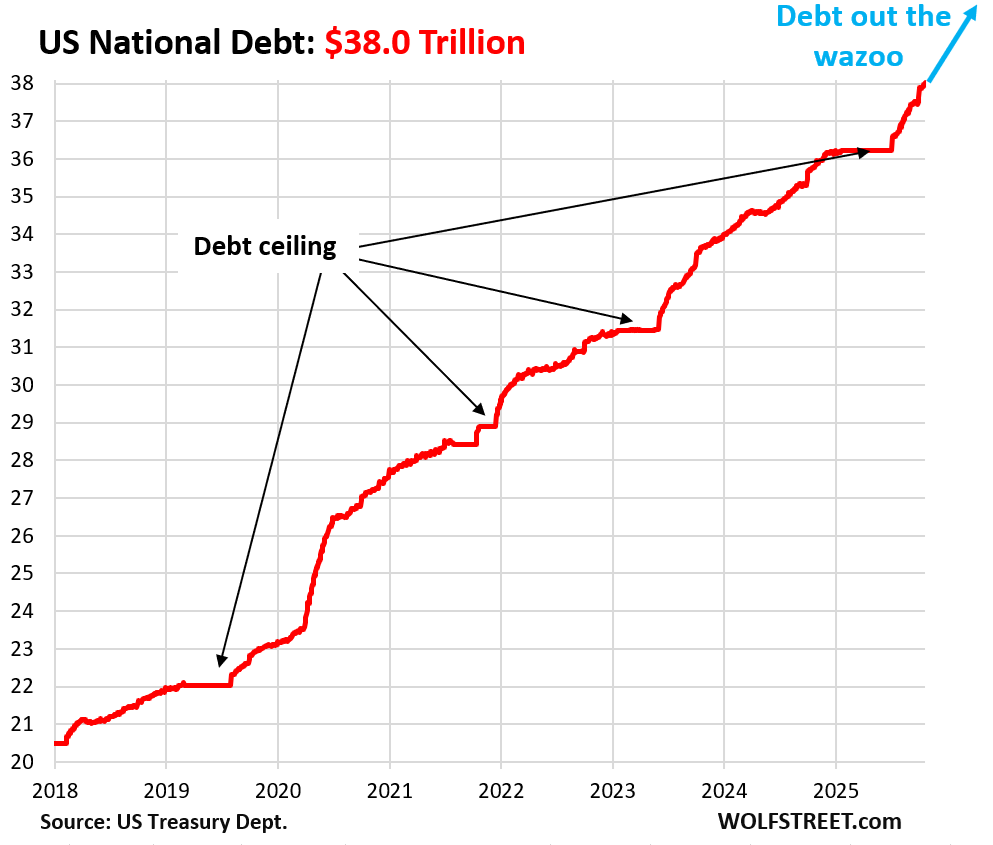
The US Treasury debt – all Treasury securities outstanding – jumped by another $40 billion today and thereby went over the $38-trillion mark, to $38.012 trillion to be precise, only two-and-a-half months after it had hit the $37-trillion mark on August 8, according to data from the Treasury Department today.
Since the debt ceiling in early July, so in three-and-a-half months, the debt has soared by $1.8 trillion. Trillions are flying by the window so fast they’re hard to see.
The flat spots occur during the debt ceiling, or as a WOLF STREET commenter put it so unforgettably, during the “debt floor.”
Of that $38.01 trillion in Treasury securities, $30.44 trillion are “held by the public” – they’re the publicly traded Treasury securities held in accounts in the US and around the world, in brokerage accounts, by banks, by insurance companies, at financial centers, by central banks, by the Fed, etc.
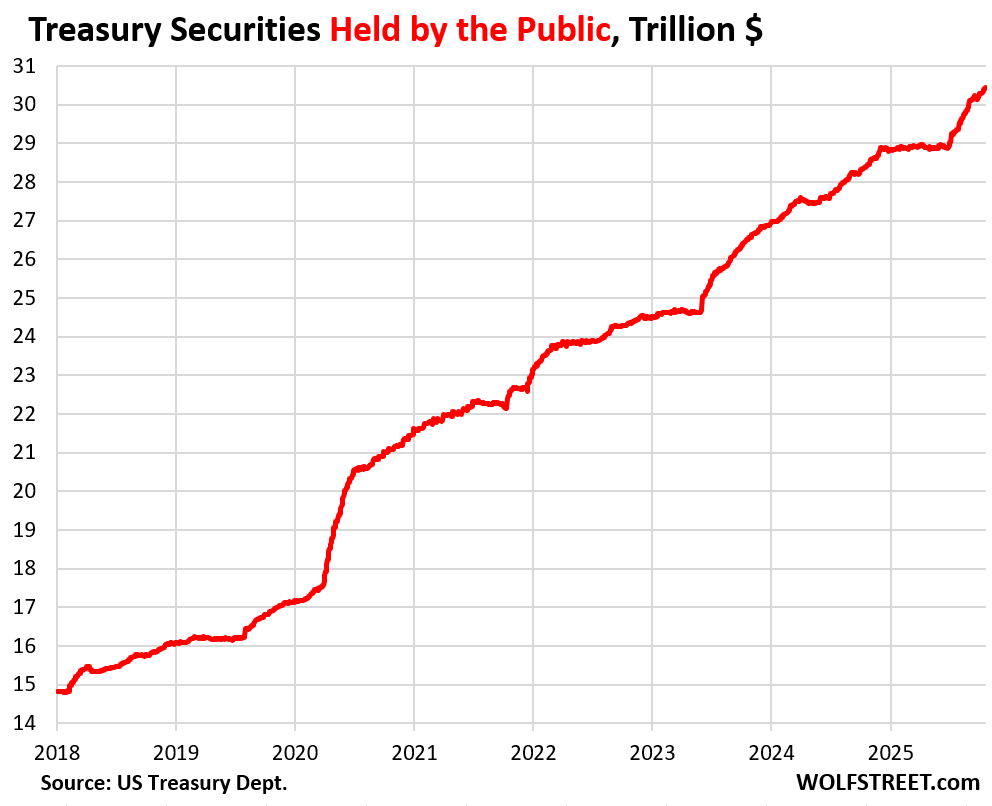
The remaining $7.58 trillion of the debt are held in federal government pension funds, the Social Security Trust Fund, and other “internal” government accounts, and they’re not traded.
Yields rise until there is sufficient demand. So there will always be demand for Treasury securities, but maybe not at sustainable yields.
But yields on longer-term securities are currently relatively low – with the 10-year Treasury yield only about 1 percentage point above the CPI inflation rate for August – indicating that there is ravenous demand for Treasuries. If there is less demand, yields will rise until there is enough demand. This happens in real time at the Treasury auctions and in the market. Higher yields create demand, but they also increases the interest expense and that becomes a problem at some point.
But debt and interest expense don’t exist in a vacuum.
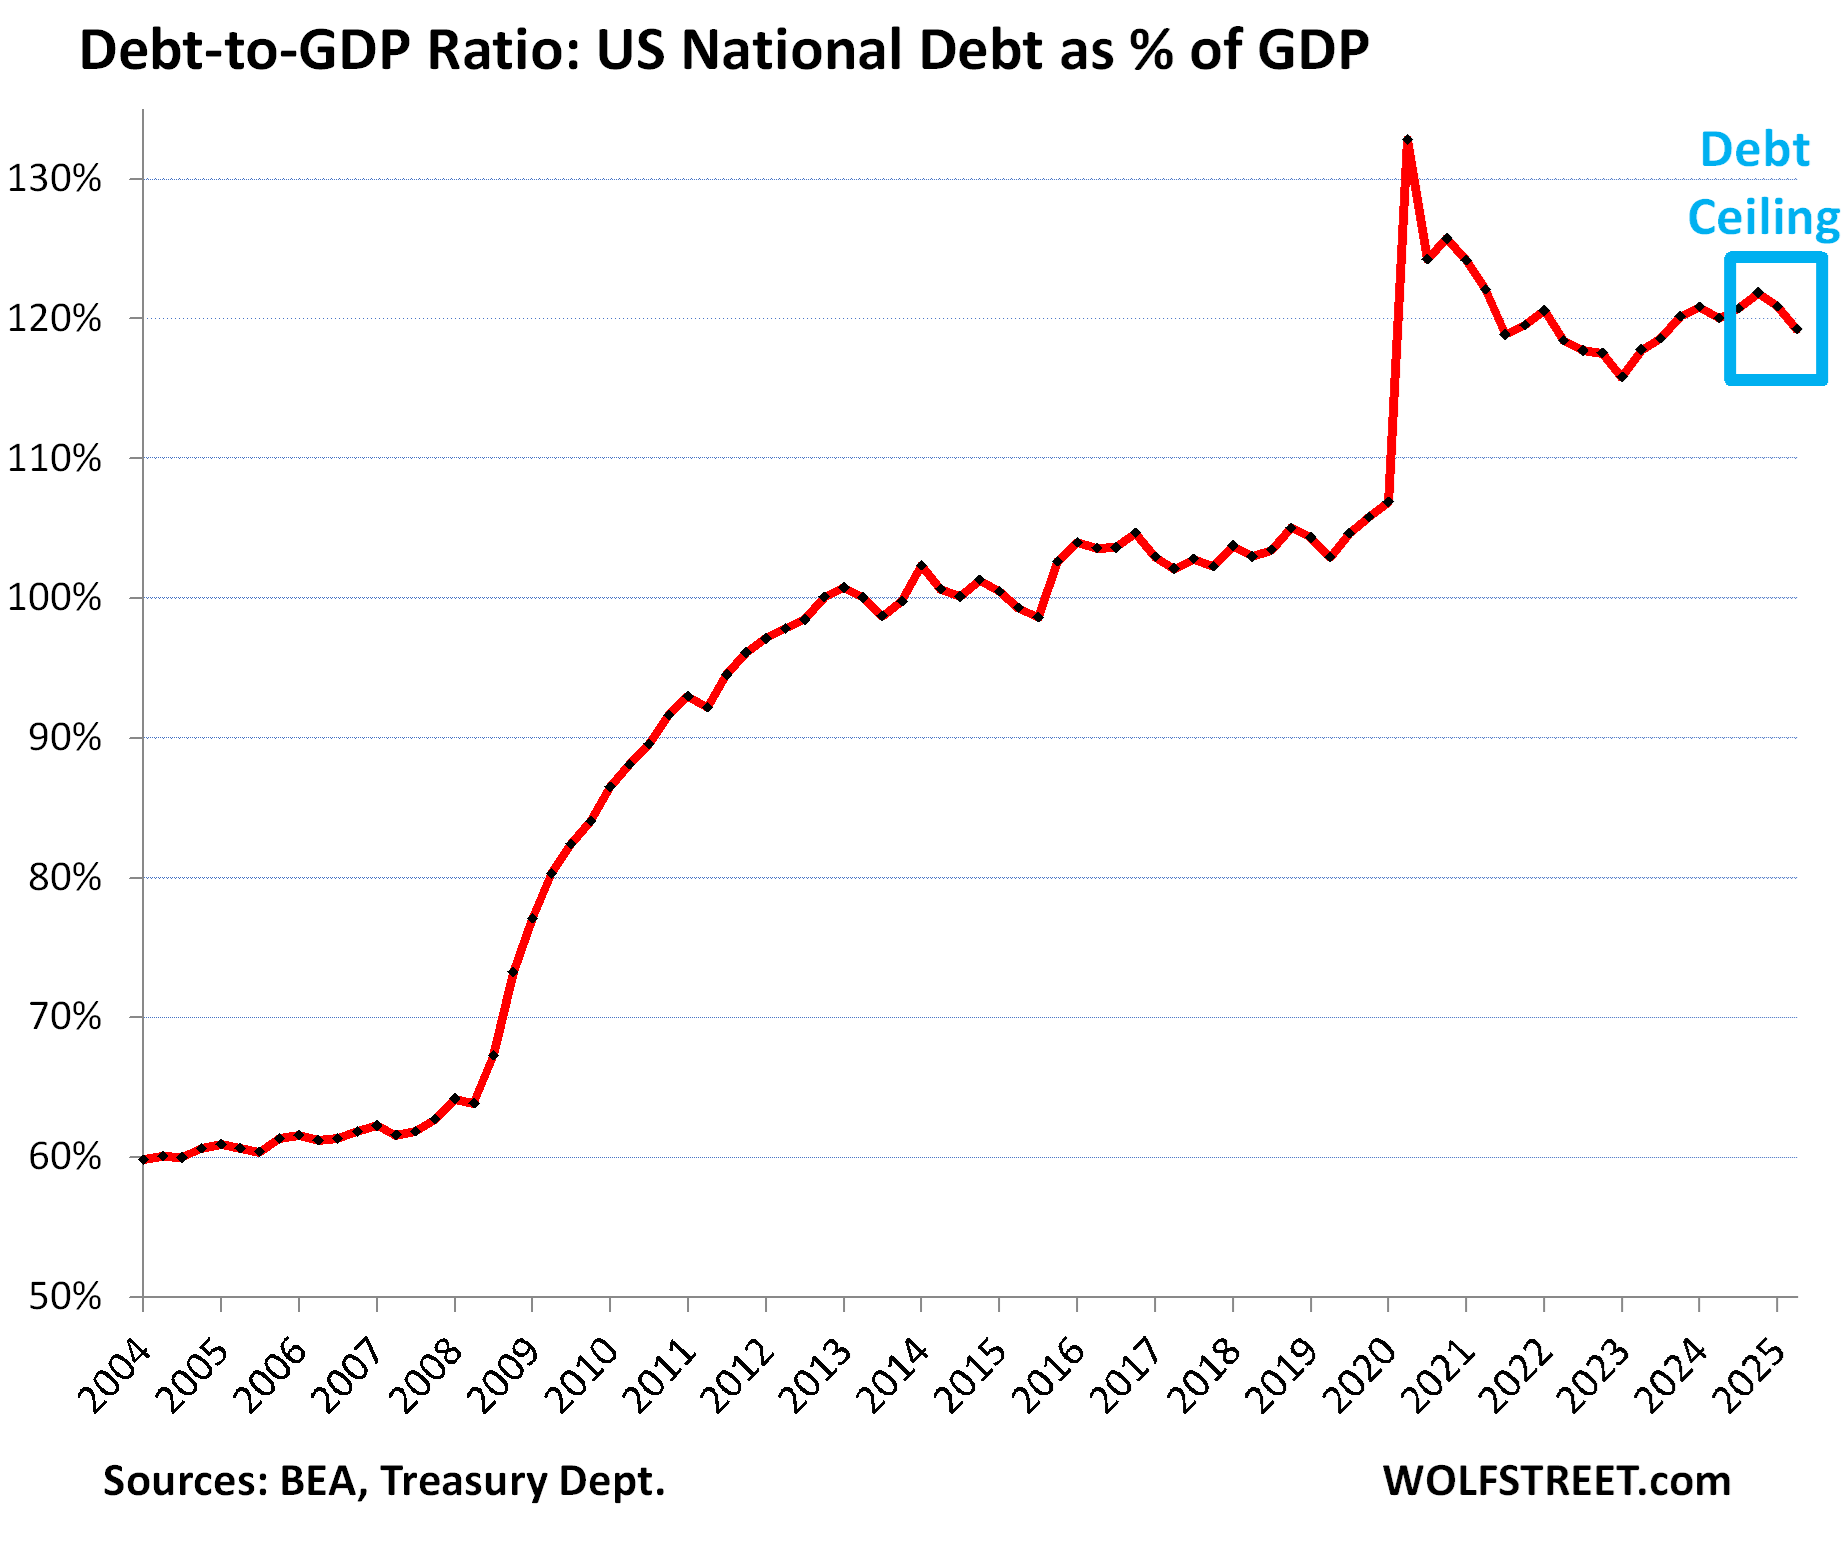
The surrounding factors are the growth of the overall economy, as measured by nominal GDP, and tax receipts, which are linked. They’re essentially what pays for the interest expense (discussion and further details here).
The Debt-to-GDP ratio eased in Q2 for the second consecutive quarter to 119.3% because the debt ceiling temporarily blocked the debt from growing over the first six months this year and kept it at $36.2 trillion through Q2.
The debt-to-GDP ratio for Q3 will likely look worse, though GDP growth seems to be pretty good so far, but the debt jumped by $1.65 trillion in Q3.
Federal tax receipts jumped, powered by capital gains taxes and further boosted by the new tariffs in Q2. This measure of tax receipts, released by the Bureau of Economic Analysis, tracks the tax receipts that are available to pay for general budget expenditures, such as interest payments. Excluded are receipts that are not available to pay for general budget expenditures and are not part of the general budget, primarily Social Security and disability contributions that go into Trust Funds, out of which the benefits are then paid directly to the beneficiaries.
Interest payments by the federal government also rose but less than tax receipts.
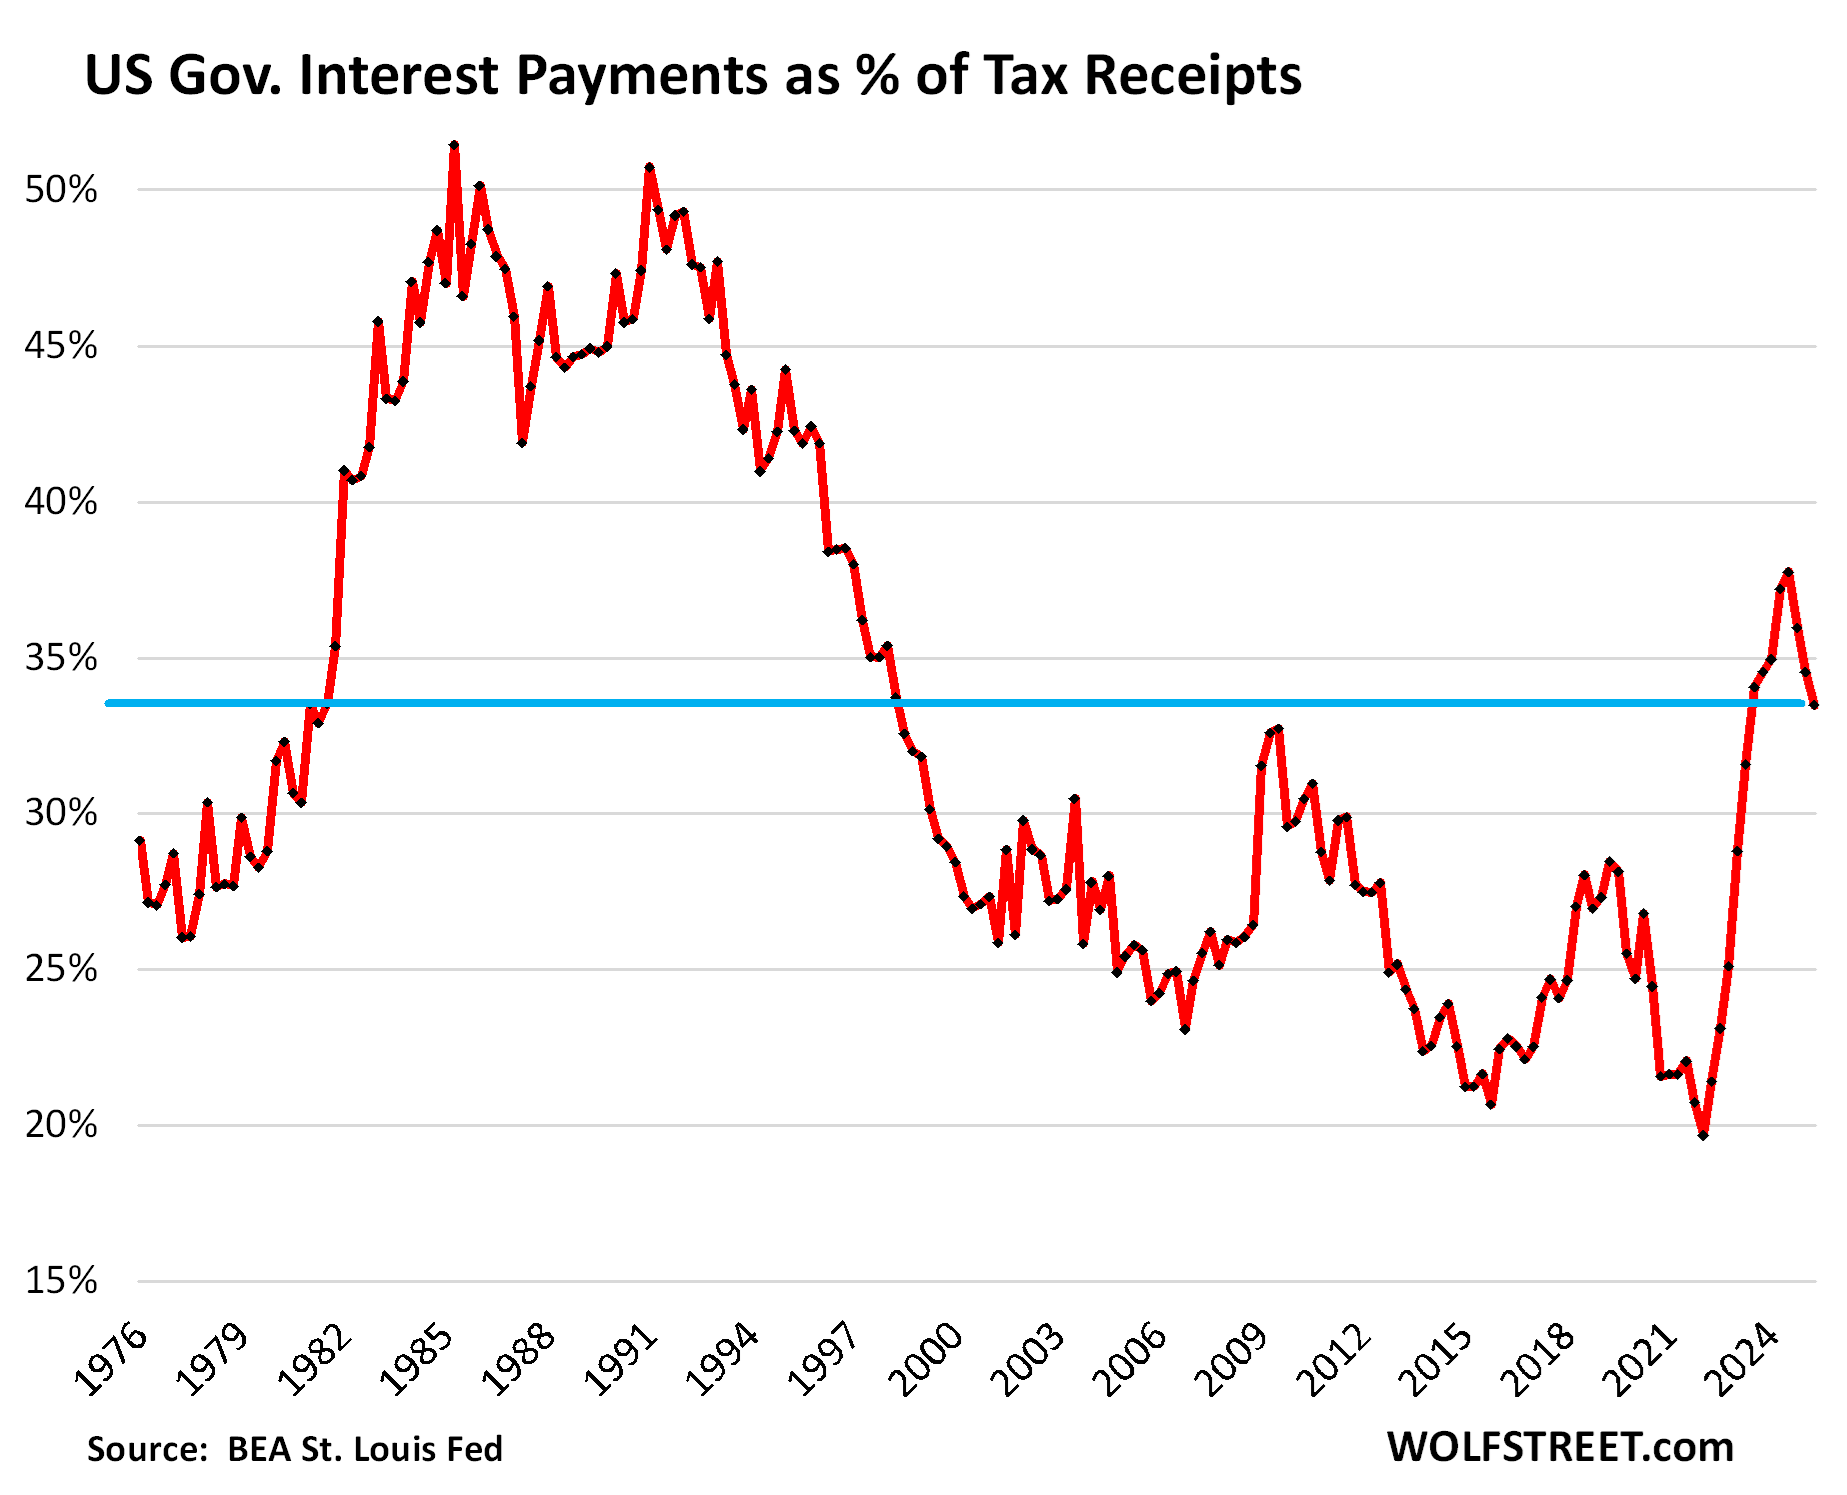
What portion of federal tax receipts gets eaten up by interest payments? It’s bad, but not as bad as it was during the last crisis in the early 1980s.
Interest payments ate up 33.5% of the tax receipts that were available to pay for them in Q2. The ratio declined for the third consecutive quarter, driven by higher tax receipts, including from capital gains taxes and tariffs.
Enjoy reading WOLF STREET and want to support it? You can donate. I appreciate it immensely. Click on the mug to find out how:

![]()
“with the 10-year Treasury yield only about 1 percentage point above the CPI inflation rate for August – indicating that there is ravenous demand for Treasuries. If there is less demand, yields will rise until there is enough demand.”
This conclusion would be normal in a fair market but Treasury market is not fair, Government interferes the market through primary dealers all the time , they sell short term debt and use this money to buy the long term treasuries when there is less demand and decreasing the yields, skew the rates, basically they are decreasing the maturity of US debt, this is similar to kicking the can down the road, problem (of less long term demand) will come back bigger in 2-3 years.
Agree. But no one should be surprised. Both the US government and the FED have been doing this for years. That is a FED mandate.
Man dated it
john,
“they sell short term debt and use this money to buy the long term treasuries when there is less demand and decreasing the yields”
that’s just headline goofball nonsense.
The buybacks are minuscule and have no impact on long-term yields. All you have to do is look it up. For example, at the weekly buyback auctions:
This week (at the weekly buyback auction yesterday), the government bought back $1.9 billion, all maturing in 2-3 years. Most of them, it bought back at a discount of 94 to 95 cents on the dollar, one issue it bought back at a premium (4% coupon!) of 101 cents on the dollar.
Last week, it bought back just $192 million with an M.
The Treasury Debt here is measured in Trillions with a T, $38 trillion, with a growth of $1 trillion in 2.5 months. Issuance every WEEK is running in the $400-$700 billion range. So how do buybacks of $192 million to $2 billion a week matter?
The US Treasury debt – all Treasury securities outstanding – jumped by another $40 billion today and thereby went over the $38-trillion mark
The treasury market is the prime example of a rigged market pretending to be a free market’
“The treasury market is the prime example of a rigged market pretending to be a free market’”
The increase of $40 billion wasn’t due to the market, but represents the sum of new issuance minus redemptions.
So you know all about my vanguard funds State Street funds pimco collective trust II John Henry Niel <oak MarkM Wiess American funds Europe R6
Another great win!
Ha, HA!
Make the Debt Great Again!
Fascinating that the interest as a percentage of tax receipts is still relatively low compared to the ’80’s and ’90’s. The net is so full of doomers proclaiming the end times any minute now. I guess the numbers sound too big for us olds.
Much different economy and geopolitical situation today.
If the US ever loses control of its bond market, there will be a sovereign debt crisis. That is what we’re up against.
I submit that there is already a bond market crisis brewing in which the risk of default is incorrectly priced.
Junk bonds priced by the so called market as similar to USG bonds.
Obviously, an issue of concern.
In those times, overall Federal debt as it relates to GDP was half what it is now, and the press and general population was very concerned about the deficit. Now the press doesn’t even talk about it and there is no public outcry. The inevitable outcome will be inflation, there is no way out.
That’s because back then, people at least talked about someday paying it off. Now everyone is resigned to the fact that it’s impossible. So it’s just a question of how poke the game can continue.
I still don’t understand why government expenditures are counted as contributing to the GDP, because all gov-exp’s are a burden on the economy in the form of taxes or in the form of debts to be paid/worked for later.
Only a portion of government expenditures are counted in GDP, namely investments (for example infrastructure construction) and consumption (such as buying goods and services that the government “consumes.”) Government salaries don’t go into GDP, Social Security benefit payments don’t go into GDP, etc. They’re counted when they’re spent by the recipients. GDP is very complex.
Wait until you find out that the government now owns equity in mining, steel, and electronic hardware manufacturers.
How long can one expect the US to spend more than it earns before it defaults on its debt or pays it back with worthless dollars through simply firing up the money printing press? Nobody appears to be asking this question
The answer is that politicians, here the Congress, will vote to do it forever. You also hit the nail on the head that there are two alternative results of this. Actual default or alternatively inflate away the debt to manageable level. Yes, that will be done with modern electronic printing press.
The end date may be the day the private sector bond market buyers ( including foreigners and foreign central banks) refuse to purchase the debt, even though nominal rates are very high, because real rates are too low or negative.
If the ONLY buyer for US Treasuries becomes the FED, then the end will be near.
You are asking the correct question. I know you are not looking for a “ date” certain. Assume you are looking for the factors or a clear set of signs.
Not sure anyone knows for sure.
This has already happened. Ever notice how the price of gas has tripled in 25 years? Or a new car has more than doubled? Can of soda from the machine went from 35 cents to a dollar?
The Fed conjures up new dollars all the time to feed the debt machine. Those dollars aren’t “worthless” but they sure are worth less.
Just extrapolate up and you’ve got it. In 2050 the national debt could be $90 trillion and that can of coke might cost $3.
Sure, there has been a lot of inflation, but…
1. “the price of gas has tripled in 25 years”
the price of gasoline is now LOWER than it was in 2008. The big increase came in 2000-2008, as the price oil soared. Since 2008, gasoline has been wobbling up and down in the same range, with essentially no inflation. Since mid-2022, the price of gasoline has PLUNGED by 35%, as the dollar became worth MORE.
2. The price of a laptop went from $2,000 in 1995 for something that was essentially useless to $600 today that is essentially a super-computer by 1995 standards, as the dollar became worth a lot MORE.
3. “Or a new car has more than doubled?”
Yes, but you get a car that is multiple times better in every aspect than the POS death-trap you got in the 1990s.
Goofball jerry-picking produces goofball results.
Something, maybe just perception, has changed.
If one was growing up in the late 50s and 60s, many middle-class families had a WWII Vet breadwinner with a high school diploma, a stay-at-home mom, a bunch of kids, and the whole crew could live on a single income in a somewhat middle-class manner.
Today, maybe just perception, but that seems impossible.
Is it that people have higher expectations of what life should be, thus they need more stuff?
Could it be that we have had a shift in jobs such that fewer support a middle-class lifestyle?
Is inflation to blame?
I love me 70’s/80’s death traps thank you!
They are a breeze to work on/no emissions nonsense,and…..,they have character!
My newest is the 1998 Olds I recently bought with 50,000,tis running great and am happy to have bought it,a great daily driver!
sure, there’s always some old-timer who thinks his horse-drawn carriage was the best vehicle ever built and so easy to work on 🤣
A Guy: Then post- early-’60s came along and ‘women’s lib’ really just meant that it wasn’t really about getting women out of the kitchen and taking care of the kids so they could explore their ‘full potential’ even though many were completely happy, (and women who felt they wanted to achieve something more or different always did so) – it was about women actually working for the government to pay all the extra taxes and inflation and to pay some stranger to take care of their kids.
This is also the era when unless anybody had ‘higher’ education, most often in stupid useless degrees, they would be economically cast aside in society, and the education industry began its monumental bubble, becoming not fit for purpose while becoming economically impossible for ordinary folk who wanted to pursue degrees for which they were capable and genuinely interested in achieving. In later years of course, they could out student loans that in many cases subsequently destroyed their lives.
The truth is that 95% of people need to be able to read, write, and count to be able to perform their duties in most organizations, which train them to do their jobs effectively – something that the education system doesn’t do anyway.
All candy bars in my YMCA vending machine were 10 cents in 1975, except for Cadbury Caramello which was 15 cents. The same Snickers bar today is more than two dollars. No product improvement, just priced twenty times higher in dollars.
Great Outdoors
1. Your first mistake is to even buy this shit. It’s terrible for you. If no one eats them, they wouldn’t exist.
2. I never trust any figure that someone gives me off memory of what something cost 50 years ago LOL.
3. It is beyond dumb to use an effing candy bar (or any other single product) as a stand-in for overall inflation. That was my point. And you didn’t get it.
“POS death-trap”
Oh, I love it!!!
Dr J
I filled my tank today for $2.73/gal and that’s not the cheapest gas in town. I also bought 2 excellent new cars in the last year that each cost around $30,000. The VW GTI got 48 mpg on a recent road trip and has loads of features even though it’s a base model.
Great – with respect, try a telescope-flipping thought experiment wherein you consider 1975 average wages and percent of a ’75 dollar that .10 candy bar cost, and 1975 costs of material, production and distribution for that candy bar. Run the same numbers for 2025, consider U.S. inflation since that that time, and you may find some children today looking just as longingly at the same (perhaps ‘shrinkflated’ confection), the purchase price tracking to a deemed-necessary profit-margin in a pretty-competitive market (esp. since chocolate isn’t grown in the U.S., the tariff situation adding another complication to the existing ones of climate and geopolitical access and transport of base stock).
Wolf’s most-excellent paywall-free establishment remains, incredibly, a one-man operation, wherein the usually-patient barkeeper must also do the dishes, the books, and, if it’s a long, tiring, frustrating day, act as the bouncer. If prognosticating, always be prepared to experience a sharp word up to and including being ejected from the scrum, as many of us here have been over the years. (Also remember that, so far, one is still free to start their own, competing, most-excellent establishment of their strength of conviction re: their own viewpoints). Best to you.
may we all find a better day.
Basically, until someone supplants us as the top military power in the world, which isn’t likely for the foreseeable future.
A long time because the world sees the U S as a place where they are not so concerned about the return they get on their money but the confidence of the return of their money.
@Rico Years ago I heard someone say we should not get worried until rich Americans start sending their kids to Chinese Universities and investing in Chinese Real Estate.
But isn’t the fact that asset price have surged over the past 10 years an indicator that they ARE concerned about that? They’d rather buy and hold obscenely overpriced stocks and real estate (and even phantom things like Bitcoin) than hold currency, including dollars.
I look at this debt in terms of basic accounting. Assets = liabilities. So govt debt is $38T, but that means there is $38T in assets…bonds/bills. And because people/investors rebalance portfolios they keep their assets diversified so some in bonds, some stocks, some RE, gold etc. So if lots of govt bonds are made like this, then demand for the rest will eventually go up to rebalance it either next quarter, year, or whenever a particular investor wants to balance out their portfolio. And in general total bond market is roughly same value as total stock market cap…although I haven’t checked in a while. So when govt takes on new debt, it’s making new assets and therefore pushing up other asset prices. All imo of course…
…or, the baked-in, eventual, complacency of an empire…
may we all find a better day.
So where/how does one hide from this? Buy real estate? Buy gold and silver? Something else? Or just don’t worry and keep the money in the stock market because it will go higher and higher?
Just spend it. If you have the luxury of worrying about where to keep your money you’ve already won. Take the win.
That’s the big question isn’t it? Choose your own adventure.
The biggest hot potato looks like it will be government bonds, but it has looked that way for decades and plenty of people have done fine with them in that time
I would suggest focusing on S&P500 and NASDAQ etfs. The indexes (S&P500 & Nasdaq) are rigged to go up over the long run. When a company in the index tanks, it is tossed and a newer company is added (e.g. GE is tossed and Amazon added).
So, over the long term the indexes go up, and the index-based etfs go up. Individual stocks are sold based on “it will beat the index”…. which is where the scam arises…
Just a reminder
ONE BILLION seconds is about 32 years
ONE TRILLION seconds is about 320 CENTURIES!
The game of small integers that is played in Washington DC…….when bills tack on .1 or .2 Trillion to a bill appears trivial at first blush.
Curious now that servicing the debt is some kind of surprise in Washington DC.
yes, but “320 CENTURIES” in terms of the age of the universe is just a blip.
…I can only think back to ol’ Ev Dirksen and imagine the look on his face if informed that ‘a million here. a million there’ jest would blow through ‘a billion’ to ‘a trillion’ as being ‘real money’ less than a hundred years hence. Being born into, and growing up in, times of constant general quant uncertainty and perception indicate yet another serious disruption of meaningful and effective long-term communication and cooperation between our current contemporary generations…
may we all find a better day.
I have always found this factoid interesting when speaking about the issue of debt.
This tells me that the problem is not able to be solved.
“The total net worth of all billionaires in the United States has been estimated at around $6 trillion as of 2025.
If this wealth were fully confiscated, it would fund approximately 9 months of federal government spending, based on a 2025 budget of about $6.75 trillion”.
This is why the “Tax the Rich” thing is sophistry, the problem is now and has always been spending, under both parties as has been clearly shown. Someone is going to need to take a sledgehammer to Federal spending. Musk used tweezers.
You also have to get people back to productivity and end the bailouts of every industry.
Generational welfare should not be a thing nor should corporate welfare.
Visual Capitalist made a graphic about GDP per country.
In it, it also broke down GDP per capita. US was $93k.
I think only Switzerland, Ireland and Singapore are higher.
The problem is capitalism. It’s by definition unsustainable at some point.
The pursuit of continued growth eventually becomes exponential. IF the natural systems were sustained, it could be sustainable: with exponential population growth.
The crux? Capitalism is artificially competitive and there’s no free markets.
As others pointed out: military prowess is a factor. Another being resource availability or abundance.
If supply was allowed to find its demand (free markets), then political lines would be less important.
“For the sake of the children,” on whatever side you’re on (east, west, north or south etc), we protect, steal, sanction or subsidize along our preferential boundaries.
Proposal: eliminate all funding to individual States. No more pork. Zero dollars given. Zilch. No matter what. Federal programs stay open and run for now. Military still stays funded. Doesn’t matter how loudly the States cry for that money. Cut them off.
A LOT of state funding is military. There’s a reason supplier companies and facilities are located in key congressional districts. Those are jobs and revenue to their host states. It’s easy to think about military as force and might, but when you get past the surface it’s a jobs and social welfare program.
We “hire” lot of young people (mostly male) from disadvantaged backgrounds and communities and offer them health benefits, education, home loans, and in some cases pensions — all of which them had little chance for as civilians.
Then we spend lots and lots of money in strategic parts of the country building weapons systems, gear, vehicles, etc… People whine about SS and Medicare/Medicaid and “spending” but they never look at where our military spending goes and what it goes to. It’s just another entitlement that supports a vast industry of companies with their hands out. Spending on old people keeps them from exercising their power at the ballot box on regime change. Spending on the military allows us to be the biggest bully on the world block. Spending on poor people keeps them from exercising their power at the ballot box on regime change.
Always think about what we’re buying with our dollars and why we’re buying it because it is transactional, sometimes wrapped in a flag of national pride or the warm fuzzy of social good will, but there is always a transaction there.
The other issue is that you can’t confiscate the wealth, as most of it is based on bubble valuations.
And when you went to confiscate it, you would find the value much less than expected, as the stock market tanks (and the market for superyachts, fine art, etc.)
Right. If the government was seizing the wealth to pay for operations, the value would be what the wealth produces in terms of cash flow. Which means, for stocks, 10-15 times earnings, not 30-100 times earnings.
“A sustainable fiscal policy is defined in this Financial Report as one where the debt-to-GDP ratio is stable or declining over the long term. The projections based on the assumptions in this Financial Report indicate that current policy is not sustainable”
https://fiscal.treasury.gov/reports-statements/financial-report/mda-unsustainable-fiscal-path.html
To grow out of the deficits it is necessary to eliminate the leakages in the circular flow of income, e.g., funds dissipated in financial investment, funds involving the transfer of title to goods, properties, or claims thereto…leakages which do not add “value to product”, in national income. This draws off a net volume of funds that would otherwise have been spent on current output.
What needs to be done regarding federal spending is across the board cuts of 25% to 50% affecting every single program.
Agreed.
The big 3 need serious reforms. Defense, SS, and Medicare/Medicaid.
No politician has the balls to do it because they care more about staying in power than fixing problems.
Surely there has to be an off-ramp for those programs that can be set in stone and phased out slowly to avoid significant disruptions.
For the millionth time:
Social Security is NOT part of the budget. And it’s NOT part of the debt. And it does NOT contribute to the deficit. Social Security is self-funded and had a SURPLUS for over 25 years that it accumulated in the Trust Fund which invested it in Treasury securities ($2.7 trillion), and it only recently has been running a deficit that is paid for entirely out of the Trust Fund and neither impacts the debt nor the deficit.
When people throw SS into budget or debt discussions, they’re either don’t know better or are manipulative watercarriers for the ultra-rich that loathe SS and want to wreck it.
SS does need to be tweaked a little to bring it back into neutral or surplus territory. A combination of tweaks is all it takes — like it was done in the 1980s (by pushing out the retirement age and tweaking contributions), which then produced the huge surplus. Boomers largely paid for those tweaks and the surplus so that they would have something to retire on, and it worked. Now SS needs another set of tweaks. But that has nothing to do with the debt or the budget.
@Wolf, what do you mean when you say “the ultra-rich that loathe SS and want to wreck it”. Most of the people I know are “pretty” rich (not “utra” rich like Elon Musk) and we all like it that people that did not save and invest for old age get a check every month (I’ve been personally getting a check every month since I turned 62 since I expect that “pretty” rich people like me will get cut off before I die.
ApartmentInvestor
“Most of the people I know are “pretty” rich (not “utra” rich like Elon Musk)”
We should create a scale of richness. Something like:
ultra rich
super rich
very rich
pretty rich
rich
kind of rich
almost kind of rich
barely not rich
not at all rich
far from rich
etc.
Wolf, did I ever say it was, or are you just assuming I meant that?
Anyways, it needs significant reform—it is a dumb fucking program. It should be for people that actually need it and not for people who have had their entire lives to invest their money. It should not be for the same people who are sitting on overinflated assets that can sell their 1-2 million house and whose kids make enough to take care of them.
I loathe SS because I basically have 12% of my paycheck (well 6 from me, 6 from employer) taken from me.
I would tweak it to phase it out entirely for a program that costs much less and only helps those that truly need it.
Wolf, you missed “entry level rich”
I would never publicly say I am rich and for most people:
kind of rich = a little richer than me
rich = a lot richer than me
pretty rich = way richer than me
very rich = Takes home millions a year after taxes
super rich = Forbes 400
ultra rich = Forbes Billionare List
Isn’t Dick-on-a-Stick (*) always telling us gold is worthless? So how ‘bout the Treasury just hands it all over to Social Security at a nice price of about $50 of federal debt retired for every ounce. (After all, if it wasn’t for stealing funds at cheap interest they’d already have sold it off long ago to cover their spending habits.) Then SS could set up a fund for ownership stake purchases by the domestic public around the price of mining/refining plus a fair add on of say $300. The gold would be held only within US borders and transferable to only to other citizens at spot prices. If you paid into SS, you could buy up to a limited amount and not beyond, thereby preventing concentration in the hands of the excessively connected. Then the federal lawyer class whores could go f**k off and find someone else to rob at sh*tty rates. Maybe hold a new bake sale for battleships.
(*) An AKA, assuming he actually surfs those beaches.
Eric86,
Yes, don’t want to have anything that benefits society such as universal healthcare. Why not just do what almost every other developed nation has done and many that are not. Eliminate the for profit aspect along with other changes needed. I guess in a liberal economy you expect everyone to need to be on their own. Struggling with enough doctors? Why not have society provide free education since all society benefits. The answer is not in slicing and dicing but acting as a society, not how do I make my piece of the pie bigger. Once upon a time more of that existed in this country and the collective power of that got us the New Deal as FDR was a centrist, and needed to do it to get elected otherwise no support from trade unions.
I know it’s crazy talk, but I wish someone in Congress would propose spending levels at 2019 + CPI for an opening bid for 2026 appropriation levels.
Since we all are having taxes withheld from our retirement checks and those working, their paychecks. Since there is no budget and much of the Federal workforce isn’t being paid. Does that mean that the non-controlled part of the government (SS, MEDICAD and interest payments are so large, we are still in a deficit situation?
There are 4ways of addressing the debt
1 Inflate it away.
2 Pay it down by raising taxes.
3 Default on it.
4 Increase productivity (innovate) and grow the economy, and therefore the tax base.
The first 3 ways are really non starters, we must hope that we can pull off # 4
I had to say this, Rodger, but number 1 is a very likely option, at least historically speaking.
#1 i.e. lost of purchasing power of USD is the only way out and is already happening for last few decades as obvious.
US Gov can never default but they can print ad infinitum and would suppress inflation metrics via some means. We all know how much faith we should put on gov metrics.
Your 1 and 3 are the same. They cannot default, but they can inflate the debt away, which is a default in substance.
I think they have a chance of deferring fiscal problems for a while. If AI can reduce costs by 3% annually across the economy, they can inflate prices by 6% annually, which nets out to an overall 3% inflation (the current inflation run rate the Fed is comfortable with).
It would be tough on retirees and others who pay the higher prices but obtain zero financial benefits from AI.
Rodger Cornell,
#4 no longer implies increasing the tax base. Quite the opposite of you look at what is happening with automation, AI and so on.
Inflation is the likely result, moderated by the increase in productivity.
Wolf, up in Canada the PM has been speaking about balancing the “operating budget” while running a significant deficit for large capital investments to spur growth. I’m curious if you think there is any merit to this approach and if this may apply in the situation of the US.
Corporate financial accounting works that way, where capital investments are not expensed when made, but are expensed over time through depreciation. This is called “accrual accounting.”
The US government doesn’t use accrual accounting; it uses “cash accounting” where investment and consumption are expensed when paid for.
My understanding is that Canada’s federal government uses two measures, one cash accounting for the primary deficit; and two accrual accounting for net operating cost. So if my understanding is correct, Carney was referring to the accrual method of the net operating cost.
What’s the tipping point with debt and Treasury issuance?
Seems like everybody is happy ignoring consequences — but what are the consequences?
Seems like this game to ignore current reality and kick everything down the road, is clearly seen in the AI industry and consumers who use credit cards to buy now, maybe pay something later, maybe get an extension, or use a different card…
Extend and pretend capitalism.
If the “debt to gpd” ratio is going down, why is this a problem?
To me that seems like things are fine, for now.
You do need to read the text. The Debt-t-GDP ratio went down in Q2 because in Q1 and Q2 the debt ceiling kept the debt locked at $36.2 trillion, same as at the end of 2024. But then the debt ceiling was lifted, and the debt spiked, and we’ll see that in the Q3 debt-to-GDP ratio when GDP is released.
May I suggest that that’s a problem for the future us? ;-)
I thought my sarcasm would be apparent with the “for now” comment.
I just want to mention, that the last graph tends to spike during or after recessions. Therefore the long term trend is less reassuring than it seems.
Elect representatives who will perform the job of congress to adjust spending and taxes. There are ways to do these things there have to be individuals willing to roll up their sleeves . Instead we have fights and shutdowns like a video parlor game . Ridiculous.
Look at the world. This is the nature of liberal democracy. There is no stability. It is the illusion of change because in the end both parties both support the same things, minus the margins they need to differentiate themselves. But regardless of who wins and loses elections, they always come out ahead. Greatest con ever.
Will be interesting to see at what point will “the public” starts to become less willing to loan money to the government and the effect on rates…or if they just say hell with the consequences and do QE again.
The estimated annual interest expense for FY2025 is now $1.2 trillion, based on an average interest rate of 3.36%.
This is now the largest single budget item—exceeding spending on defense, Medicare, and Social Security combined.
It threatens to crowd out essential investments in infrastructure, education, public health, and future innovation.
Even more alarming is the administration’s push to cut subsidies for ACA, SNAP, Medicare, Medicaid, and Social Security—lifelines for millions of vulnerable Americans.
These cuts are being justified under the guise of “deficit reduction” and “rooting out waste, fraud, and abuse,” while the same administration grants massive tax breaks to the wealthiest Americans, further ballooning the deficit.
“exceeding spending on defense, Medicare, and Social Security combined.”
For the millionth time: Social Security is NOT a budget item. It’s self funded and doesn’t go into the deficit or debt figures.
We used to worry about a black swan. Now we have a flock of them.
One of them: US auto industry projects it will lose 10 billion in 2025.
LOL, are you now finally understanding that they’re eating the tariffs after you spent 10 months harassing me with your Canadian anti-tariff propaganda?
But that “lose $10 billion” is also BS. Maybe “make $10 billion less than they would have”
Reagan made me do it.
Time for a vacation?
Time to stop spreading official Canadian anti-tariff propaganda on my site. Canada’s government did itself a huge disservice by exhorting its citizens earlier this year to reach out to US media and spread anti-tariff propaganda and lies. That was a super-shitty thing to do. My site was target of that for a while, and I cracked down. On my third tariff article, I closed the comments from the beginning because it was too much agitprop to handle (the Soviets had a Department for Agitation and Propaganda). Not all was from Canada, some came from Europe too and other parts of the world. I wasted a lot of time blowing hundreds of these anti-tariff agitprop comments out of the water over the series of articles. But then I stopped wasting my time and switched to blocking and deleting. Unfortunately, this official propaganda was spread by my beloved readers in Canada, and so they all went on my anti-tariff agitprop blacklist. It’s time to end it. Clearly, the tariffs are not good for Canada, but that’s Canada’s problem. Deal with it in Canada. Keep my site out of it.
So are we great again or na?
The NZZ reports today that the Cayman’s are the largest foreign holder of US debt with about $1.9TR. They say that it is mostly US hedge funds domiciled in the Cayman’s which hold those papers and that they are heavily debt-financed. The NZZ sees a substantial risk in this structure. Your opinion?
The Federal Reserve released a study a couple of weeks ago, which is where the NZZ took this info. What is new is the amount: Holdings by US hedge funds in the Cayman Islands is $1.4 trillion larger than the TIC data from the Treasury Department shows. The TIC data for the Cayman Islands shows close to $500 billion. And I have long discussed this in my TIC data articles on foreign holdings of US Treasuries.
It has been well known that these Treasuries in the Cayman Islands belong to US hedge funds that use them for the basis trade. So the only thing that is new is the amount ($1.4 trillion larger than previously assumed), not what they’re doing.
The extra $1.4 trillion was previously thought to be held by hedge funds in the US, as per the TIC data which has trouble distinguishing between US hedge fund holdings in the US and US hedge fund holdings in the Cayman Islands.
This doesn’t change the view of the basis trade. But it changes the data on US-held assets that go into a broad range of data, including household wealth data, that are therefore distorted.
So I think after further review by the Treasury Department, they’re going to try to fix the TIC data to where it can pick up more accurately the Treasuries held in the Cayman Islands by US hedge funds.
Wolf!! Treasury Secretary tweeted that from April to September (two quarters) the deficit is lowest since 2019. Can you confirm whether it is accurate. Thanks
Not confirming any tweets ever. If you get your info from X, it’s your own problem. Same with AI.
Wolf!! I checked the data $468 billion is the deficit between April and September 2025.
It would be interesting to see analysis of any long-term trend (e.g. back to WWII) towards increasing dependency of the country on the federal government. This could include the military which to a large extent protects “U.S. interests” abroad which supports dependency big time (going beyond “defense” of the motherland). Essentially we have this capitalist/imperialist system where the government seems to play an ever-increasing role. The ideas of self-sufficiency, “living off of the land,” frugality, and simplicity are not anywhere in the mainstream political dialogue. We are caught in this “clinging and grasping” cycle and the expectation of an ever-increasing standard of living (versus a more likely regression to the global mean). So of course politicians go hard on debt to fund the dependency. For example, we had a pandemic, which really highlighted the dependency, where the government had to pour trillions of dollars into the economy, because of a lack of self-sufficiency. Yet politicians are basically now leaning into the dependency instead of saying “If y’all could be less dependent on the government the next time we have a crisis, we would not have to put the country in such debt.” In other words, the debt would seem to be driven by dependency. Note that this dependency now comes in via the markets where the government puts “free money” out on debt and the owners of capital reap the gains; it’s a hand-out that likely will get paid down with the regressive effective tax of inflation.
” towards increasing dependency of the country on the federal government.”
Here is one factor: The share of civilian jobs at the federal government dropped to 1.83% of total nonfarm payrolls in August, the lowest in the data going back to 1939.
Discussed here in detail:
https://wolfstreet.com/2025/09/05/my-thoughts-about-that-august-jobs-report/
Trying to get my head around something:
If the interest rates on long bonds drops the treasury call buy the bonds back on the open market for, let’s say 50% of face value, and new short term debt to finance it. And if the “bond vigilantes” wanted to they could short enough bonds to push up rates to a level the government has trouble affording over a longer term. Seems to me that the government has the tools to keep the bond market from ever being shorted because the treasury can buy everything they try to short and remove it from the market. Makes covering that short a bit tricky. And if this happens on a big enough scale that the debt level shrinks noticeably, and becomes more manageable, yields fall naturally.
I’ll assume this is why the long heralded return of the bond vigilantes has never happened and will never happen
Wait a minute. What they can buy back at a big discount are long-term bonds that were issued during the low-yield period and have low coupon interest rates, much lower than today’s coupon interest rates, which is why they can be bought back at a discount. But those low-coupon interest rate bonds are precisely what keeps interest expense down. T-bill yields today are much higher, and even after four more rate cuts will be higher than those low-coupon bonds. But by buying back those lower coupon bonds, the government would be jacking up its interest expense, and it’s trying to do the opposite. There is no free lunch in bonds.
If it buys back bonds with coupon interest rates that are higher than today’s coupons, it will have to pay a premium to buy those back.
The buybacks have been minuscule.
It’s all bovine. People complain about the debt when they’re running out of negative things to say about the economy. The very premise that we’re gonna one day “pay this all off” is utter nonsense.
Instead of complaining about the debt we have, we should take a second to consider what all that leverage got us – don’t worry I got it here in my notes just… lemme check… oh here it is:
The World’s Greatest Economy
Yep that’s all we got! Pretty lame tbh, who needs debt let’s pay this all off so we can go back to doing things the old way when money was real!