Gold mark-to-market quarterly adjustment: +€158 billion for Q3 on gold’s price spike, largest ever write-up.
By Wolf Richter for WOLF STREET.
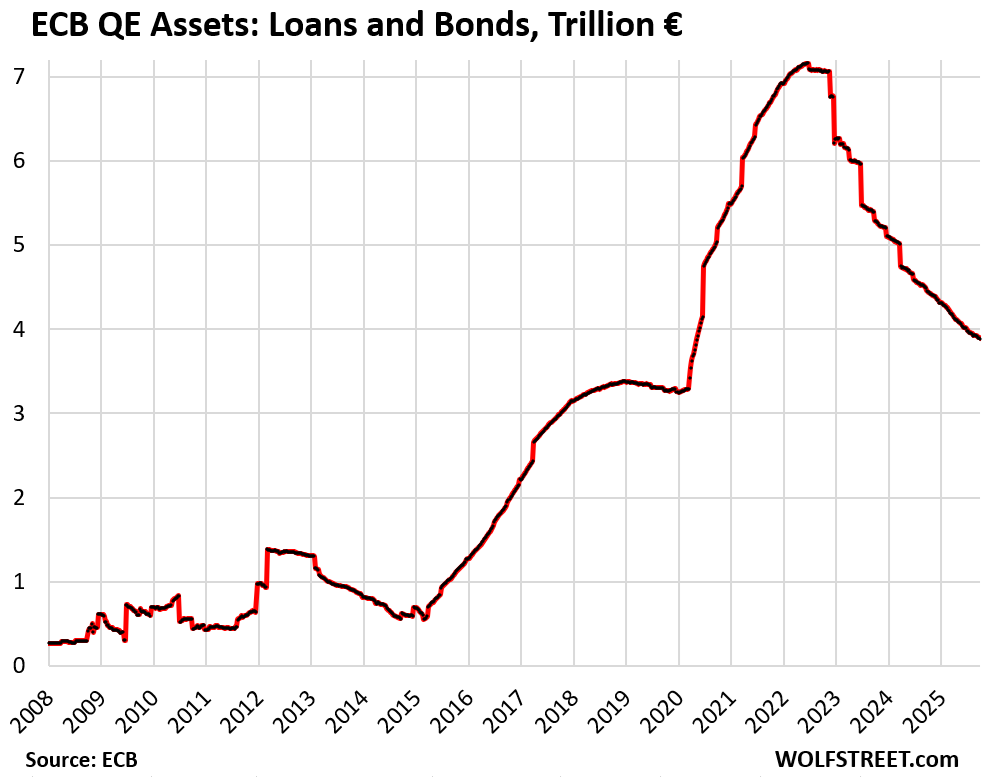
The ECB has now shed €3.28 trillion ($3.81 trillion) of its QE assets, per its balance sheet today – far more, about $1.5 trillion more, than the Fed’s QT of $2.38 trillion – and far more than anyone thought a central bank could ever shed when QT started. And the ECB’s QT continues at the pace that was accelerated for 2025.
The ECB had conducted QE via two methods: Large amounts of loans to the banks for them to plow into whatever; and large amounts of bond purchases, mostly government bonds, but also corporate bonds, mortgage bonds, and asset-backed securities. Between 2015, when its serious QE started, and peak-balance sheet in mid-2022, the ECB’s QE assets (these loans and bonds) had exploded by a factor of nearly 10, from €690 billion in 2015 to €7.16 trillion in mid-2022.
Then, in 2022 as inflation was raging, it flipped to QT, then accelerated QT in phases, accelerating it further for 2025, and now has shed €3.28 trillion, bringing its QE assets down to €3.89 trillion, from €7.16 trillion in June 2022. In other words, it has shed:
- 51% of the entire pile of QE assets added since QE started in 2015.
- 84% of the pile of QE assets added during the pandemic.
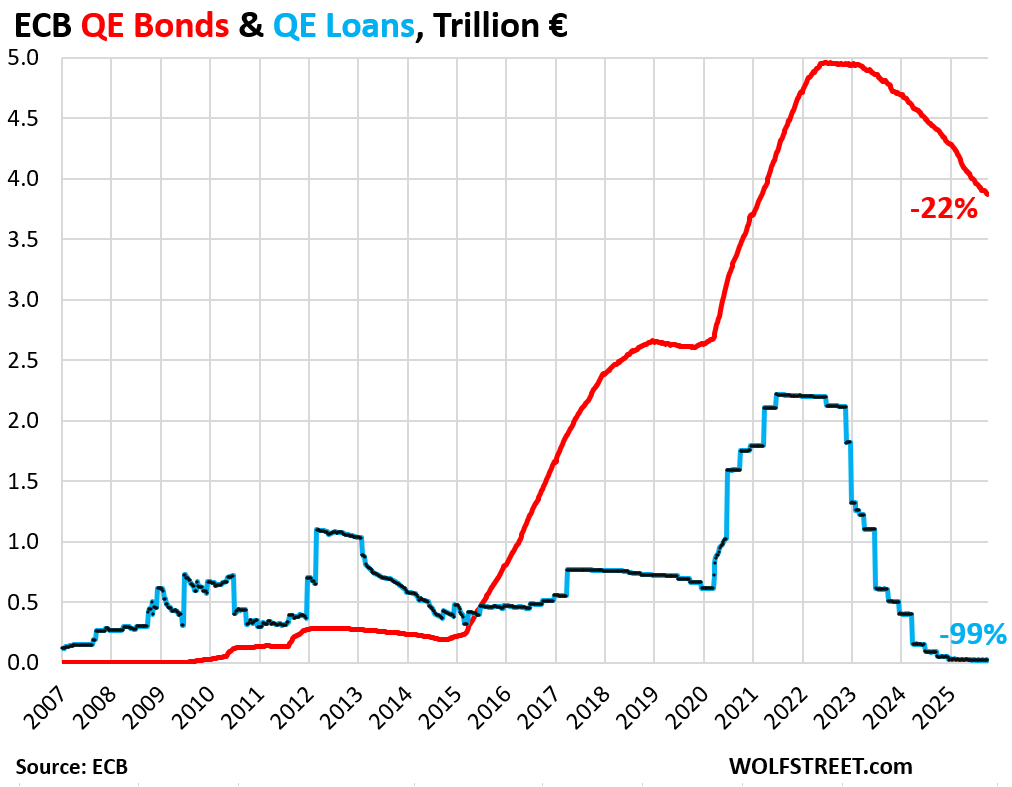
The two QE assets: Loans and bonds.
Loans to banks: nearly gone, -99%, to less than €20 billion, the lowest in the ECB’s data going back to 1999. The ECB started changing the terms of the loans in 2022, thereby making them less attractive, and the banks paid them back (blue in the chart below).
Bonds: -$37 billion in September, to €3.87 trillion.
Bonds come off the balance sheet as they mature. During the early phases of QT, the bond roll-off was limited by preset “caps.” The amount that matured above the caps was replaced with new purchases. But the last cap was removed effective at the start of this year. In some months, more bonds mature, in other months fewer bonds mature, but whatever matures comes off the balance sheet, and nothing is replaced.
In September, $37 billion in bonds matured and came off the balance sheet. On average, €47 billion a month matured and came off the balance sheet in 2025. Bond holdings have declined by 22% from the peak, to €3.87 trillion (red in the chart below).
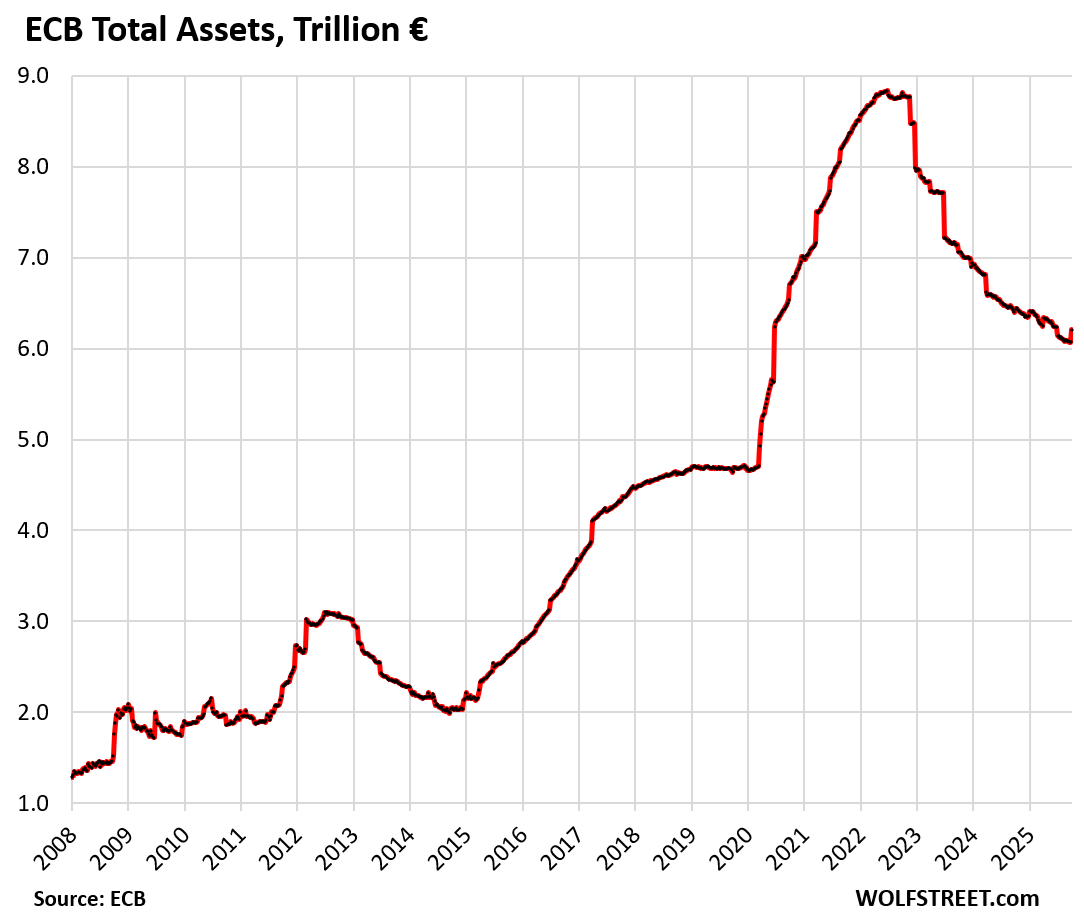
The ECB’s total assets.
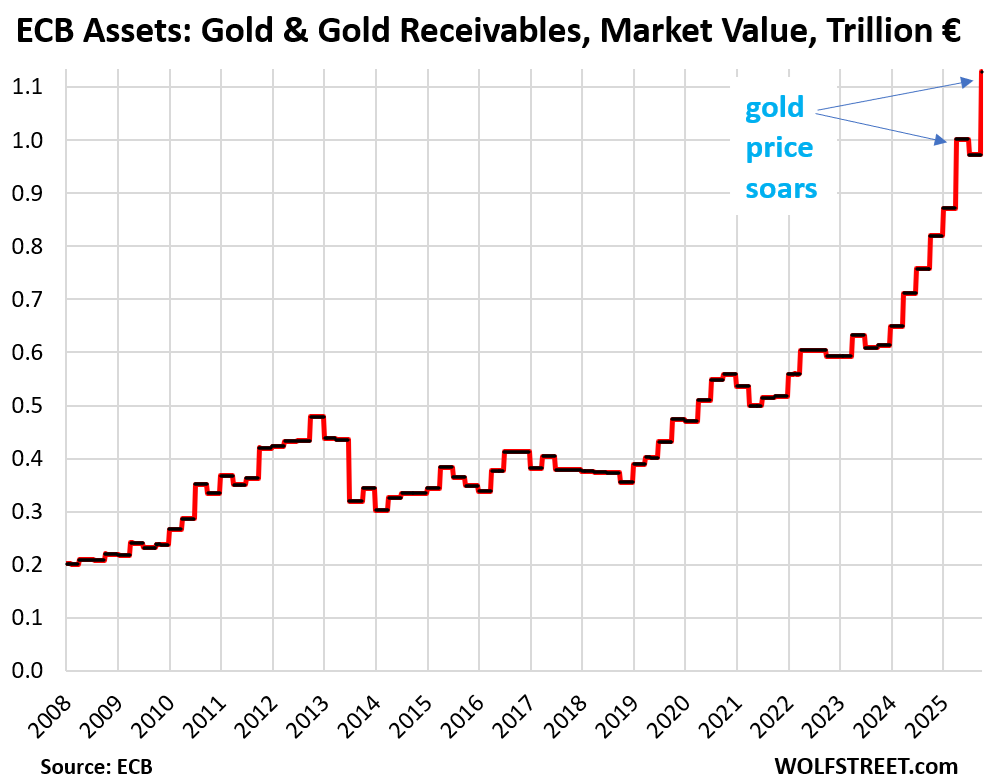
The ECB has other assets on its balance sheet, including over $1.1 trillion of gold valued at market value.
Gold holdings mark-to-market: +€156 billion in Q3, or +16%, to €1.128 trillion.
The ECB values its holdings of “gold and gold receivables” at market prices in euros. Every quarter, it adjusts its holdings to market value in euro terms. The balance sheet released today includes the quarterly mark-to-market adjustment of gold, and the price of gold spiked in Q3!
The ECB marked up its gold holdings by €156 billion on this balance sheet, to €1.128 trillion, the biggest mark-to-market increase ever, bigger even than in Q1. In Q2, the ECB had marked down its gold holdings.
Mark-to-market adjustments of its gold holdings are paper adjustments at the end of the quarter and do not involve purchases or sales of gold, or money printing, or QE or QT or whatever.
From mid-2019 through Q3 2025, the ECB wrote up its gold holdings by €726 billion (+180%), reflecting the surge of the price of gold in euros.
Total assets: This €156 billion quarterly mark-to-market adjustment of gold on the current balance sheet caused total assets to jump by €138 billion this week, to €6.21 trillion. That little hook at the end:
And in case you missed it: The ECB is way ahead of the Fed, which has shed $2.38 trillion under its QT program. But even the big straggler, Bank of Japan has accelerated its QT this year.
Enjoy reading WOLF STREET and want to support it? You can donate. I appreciate it immensely. Click on the mug to find out how:

![]()
So which CB is doing it right? Is the US Fed a laggard, or is the ECB going too fast?
The ECB is doing fine.
The Fed slowed the Treasury QT down but didn’t slow down the MBS QT.
The Fed’s actual cap is $40 billion a month. But they would have to sell outright $15-20 billion a month in MBS to get there. They’ve been talking about it casually. $40 billion a month would be a decent pace.
Hey Wolf!
So why are the ECB and BOJ accelerating and the fed slowing down to an average trickle of 22 billion a month? Even the Bank of Canada just lets everything roll off once it matures with no cap. Are they afraid of something? Cheers
The BOC has stopped QT last year, after shedding a whole big pile fairly quickly.
I don’t think the Fed needed to slow down like this, especially since they have the Standing Repo Facility now that they didn’t have in Sep 2019 when issues in the repo market got out of hand.
The Fed’s actual cap is $40 billion a month. But they would have to sell outright $15-20 billion a month in MBS to get there. They’ve been talking about it casually. $40 billion a month would be a decent pace.
But I can kind of see why they slowed the Treasury QT down (they didn’t slow down the MBS QT):
Given the dollar’s global role, the Fed has a global responsibility. Withdrawing large amounts of liquidity fast is risky. And the Fed doesn’t want a liquidity problem somewhere à la Sep 2019 to get out of hand. So they decided to go slowly.
It was a little easier for the ECB to shed its loans; all it had to do was make them less attractive, and banks paid them back when they were ready. It was up to the banks to deal with liquidity issues. And that’s what banks do in the normal course of their daily operations. Now the ECB is shedding bonds at a good clip. But it too has repo facilities to deal with liquidity issues if they crop up.
Are the ECB and BOJ seeing something different than the FED? Or, are all of these actions consistent?
They’re all seeing the same thing, but the BOJ and ECB did a lot more QE than the Fed, and the BOJ got a very late start in tightening.
The BOJ has a gigantic balance sheet (over 100% of GDP) and has belatedly started reducing it. It’s way behind. It’s doing QT to prevent inflation from spiraling out of control and to prevent the yen from collapsing entirely.
The ECB also has an inflation problem, in terms of % of GDP, it also had a much bigger balance sheet than the Fed, and it’s still larger in terms of GDP than the Fed’s (which is down to 22% of GDP).
“I don’t think the Fed needed to slow down like this, especially since they have the Standing Repo Facility now that they didn’t have in Sep 2019 when issues in the repo market got out of hand.”
We know why they did – to protect asset price bubbles at any cost, to continue their “no billionaire left behind” mandate.
That is exactly right. The current stock market and bitcoin bubble is simply disgusting. One can only hope there will be a severe correction to restore justice for humanity.
Covid was the greatest global looting and plundering operation since the great depression, it only took the money masters 16 years to cause the great depression…9,000 banks failed…millions wiped out, their cronies did very well…these cretins never go away, recycle their tired scripts…the world deserved better…everyone takes their dirty money….
Hi Wolf, thanks for these articles. Are you able to do the same for the RBA (Australia)?
Michael
I haven’t even tried. I can do and used to do the BOC and the BOE but stopped because relatively few people read those articles. So I just look at them on my own.
I read the BoC religiously but I get it
Maybe I will do an update eventually, if at least one person reads it 🤣
Could do one that includes and compares BoE BoC RBA RBNZ BoJ. Would be interesting to see the chart comparisons. I suppose it would be a lot of work to pull all this data together though.
Has the RBA reduced its b/s?
The ECB is doing great but there is still a lot of money in the system. Real estate prices in many countries have fallen but are still far from a reasonable decline to affordable levels.
In Central and Eastern Europe, prices are only going up
I have a question for the author.
If market value of long bonds falls due to interest rates, do any central banks do a mark to market adjustment like gold?
If we factored that in – Fed balance sheet will be close to 2019 levels
Central banks don’t mark their bonds to market because they hold them to maturity, when they get paid face value for them, and when market value of those bonds = face value, so market value is sort of irrelevant for them. The Fed discloses its unrealized gains and losses (difference between face value and market value) in its quarterly and annual financial statements, so you can see what it is.
At the end of Q2, the Fed reported “unrealized” losses of $928 billion. Total assets at book value are now at $6.59 trillion. So minus $928 billion = $5.66 trillion, where the balance sheet was (at book value) in April 2020.
Thanks – a very detailed and excellent post. I had this at back of my mind that market value of fed assets was lower than the stated MTM face value of bonds. So technically, if fed were to sell all longer duration and buy short it will trim down balance sheet (this is a joke – it will literally make yield curve spike up to almost a straight line).
Or may be fed should have bought more gold and made better profits :)
The Fed is short gold.
Hi Wolf,
It may be an interesting exercise to do a global QT refresher, adding up all the assets as a percentage of global nominal GDP and how much have the CBs managed to trim down their bloated bellies in unison.
BoC has a nice comparison chart at the bottom here: https://www.bankofcanada.ca/2025/01/the-end-of-quantitative-tightening-and-what-comes-next/
I think FED, ECB and BOJ dwarf everybody else but still.
One hopes that after causing such global hyperinflation and currency debasement, this QE trickery is something they will consign to history books as a bad experiment with awful results.
Words lose their meaning when you misuse them. Hyperinflation means extremely large inflation. No one would classify anything under 10% per year as anything close to hyperinflation.
A typical definition is 50% per month, or 13000% per year.
Hyperinflation was of course a hyperbole. But the 10% per year is an interesting thought regardless.
So what is the ‘true’ extent of global inflation ever since the QE experiment started in earnest in 2008 (excluding BOJ of course who caught this diseases much earlier). Using gold prices as a rough gauge, which is usually seen as an ultimate inflation hedge, we have something like this.
2008 Gold price = 850
2025 Gold price = 4000
This roughly translates to 10% yearly inflation over 17 years, of course using gold as a gauge.
I just found it interesting that the annualized inflation figure calculated like this, matches the 10% per year one thinks is too high. Was this a price worth paying? Hopefully most will think no.
On the contrary – QE could very much become a cyclical thing over the 21st century with QE/QT periods replicating every 5-10 years.
A bit of inflation and currency debasement is very much desirable for central banks for various reasons.
It’s also very good for producing artificial economic growth (growth without productivity increase). The moment the ECB began tightening GDP growth immediately fell to 0% in many European economies. QE can be dangerously addictive. It might feel crap afterwards, but while you have it you feel great.
IMO two big factors why inflation cooled down in europe:
1. strengthening of the euro vs the dollar makes our energy imports cheaper.
2. less labour mobility and less wage growth compared to the US.
The economic weaker countries continue to see higher inflation which is to be expected as their economy is growing stronger compared to the core. Which is somewhat by design. There is no raising waiges across the board without inflation.
EU economies faltering and slowing as a result? Yet their stock markets oversold to irrational levels, together with the Gold price as reported at record value. Where is all that money coming from? Sweaty private fingers on the buy button on home computers, or the big investment houses coming towards the end of their pump and dump theft cycle?
Central Banks everywhere know there paper trash money is nowhere as good as gold. So they buy gold. Assets are king for the moment.
Neither the Fed, not the ECB, nor the BOJ, nor the BOE have been buying any gold.
The central banks that have been buying gold are smaller central banks, and they didn’t buy gold with their own currency, but with foreign currency that they get from their trade surpluses.
I’d heard that China’s workaround for having trading partners settle in RMB, when they were reluctant, was to allow them to instantly convert it to gold. Is this what you are talking about?
We’re talking about central banks buying gold. So when central banks end up with foreign currency, they generally buy securities in that currency, such as buying US Treasuries with their dollars, but some have bought gold with their dollars instead of Treasuries, and some bought gold with their euros, instead of euro-denominated securities.
Well they look kind of stupid, don’t they?
Bullshit. Central banks don’t buy assets to make money. Those central banks that did buy gold did not buy it with their own currency; they bought gold with foreign currency that they get from their trade surpluses. They have to do something with that foreign currency.
Central banks hold/own very little gold and their total holdings are only about 35,000 metric tonnes out of the total of around 190,000 metric tonnes of the stuff that exists in the world and which amounts to less than 1% of global assets. Moreover, due to its high manic speculative cost gold is now going out of favor in the jewelry industry which historically accounted for about 70% of its use.
Definitely more than 1%.
200 MT translates to ~30T USD at 4000/ounce. Total US household wealth is ~175T USD. So it is almost 17% of US household wealth or probably 4% of world wealth.
It is quite chunky, whichever way you look at it. And it will keep pace with world money supply.
You’ve been bashing gold since $2000 an ounce.
How has that worked out?
Central banks hold lots of gold and unlike the value of other assets they hold it has increased in value.
IMO this is all too little, too late. Risk and trust is being repriced globally and good money is driving out bad money all over the world. This isn’t anything new and will continue as long as governments continue to be fiscally irresponsible.
Hedge accordingly.
Wolf,
Thank you for this.
Have you done a “minimum balance sheet” analysis for the Japanese Central Bank or the ECB, as you did for the Fed?
Can a similar analysis be done with the different bank structures?
My “minimum balance sheet” analysis was based on the Fed’s 2020 switch to an “ample reserves regime.” To maintain “ample reserves,” the minimum in total assets would be $5.8 trillion, according to my analysis in early 2024, and confirmed by Fed governor Waller’s analysis a couple of months ago.
But there have been discussions at the Fed that, with the new Standing Repo Facility operating slickly, it could abandon the “ample reserves regime” and revert to its prior regime (minimum “required reserves”). At least one of the Fed Chair candidates, Warsh, is a proponent of that. And Bessent has been talking about much lower reserves and much less market intervention by the Fed.
I don’t think the BOJ and the ECB have official “ample reserves regimes.” They both can go much lower from where they are. The BOJ’s total assets are still above 100% of GDP, while the Fed is at 22%.
If the Fed reverts to the prior regime, its assets could maybe drop as low as $4.8 trillion by 2030 to match its big three liabilities: currency in circulation ($2.4 trillion now), the government’s checking account, the TGA (goal now of $800 billion), and reserves (now at $3.0 trillion).
Currency in circulation and the TGA grow over time. But it could reduce its assets enough to bring reserves down to maybe $1 trillion by 2030. As the other two liabilities grow, and reserves shrink to $1 trillion minimum, its total assets would then amount to something like $4.8 trillion by 2030, my back of the envelope calculation. That would be the minimum in 2030 if the Fed reverts to the old system.
Wolf-
I’m trying to understand the reasoning behind the ECB mark-to-market on gold, while the Fed carries gold at a decades old value.
Is this due to “reserve currency” status of US dollar?
Apologies if this is trivial, obvious, or has been covered and I missed it.
Thank you
The Fed doesn’t actually own that gold. The US government does. The Fed only acts as the custodian of the gold for the US government. That Treasury gold stock on the Fed’s balance sheet is valued at the statutory (set by Congress) price of $42.22 per ounce.
It is the US TREASURY which values its around 8,000,000 metric tonnes of gold at $42.22 per ounce which is a sound value for that stuff as opposed to using some manic speculative volatile highly inflated value.
Correction: As of June 2025 the US Treasury holdings of gold are at 8,133 metric tonnes, not 8,000,000 as I incorrectly stated above and those holdings have not changed over the past year. The next largest government holdings of gold are in Germany with 3,350 metric tonnes followed by Italy and France with about 2,400 metric tonnes each.
China has bigger gold holdings than any of country.
They don’t disclose the real figures.
” They don’t disclose the real figures.”
Correct, and only gold bugs know the real figures?
Well, it went from $35 under FDR to $42 under Nixon. Probably fair to bump it by another $7 by now. Let’s just hope they’re not running out of room at Fort Knox to store all that stuff.
Only a part of the 8,133 metric tonnes of US government gold was ever store at the Fort Knox US Mint Facility with the rest being stored at other US mint facilities around the US with West Point, New York being one of the largest repositories.
When will the US sell some of this gold at $42.22 per ounce?
LMAO…. “Sound value”? Just like the stock market and the real estate market?
What about paper currency? Does it have a sound value now too?
What about those magic computer coins?
Gold is just starting to catch up.
You get a bubble! You get a bubble! Everyone gets a bubble!
The price of gold is already a laughable and inane bubble at anything over $400 per ounce! It is just a fungible commodity with rather limited uses for anything other than jewelry,
Wolf,
Yesterday an 80-year old lady in Safeway told me to buy Nvidia on any dip. Meanwhile the four horseman of the AI chip industrial complex added $250B in value in the last 3 days to $8.25T. I think we are officially in the territory where AI creates funny money faster than the Fed on a QE bender.
That sounds awfully close to the old shoe shine boy story…
“I think that this is the biggest and most dangerous bubble the world has ever seen,” Julien Garran of MacroStrategy Partnership wrote in a rather pessimistic report Friday. He estimates that a “misallocation of capital in the US” led by AI is 17 times bigger than the dot-com bubble and four times bigger than the 2008 real estate bubble.
If true, ‘4 times bigger than the 2008 RE bubble’ means any crash will be a challenge for the Fed to stabilise.