Some big shifts related to tariffs. But our Drunken Sailors keep on splurging.
By Wolf Richter for WOLF STREET.
Retail sales rose by 0.6% in August from July, July growth was revised up to +0.6% from +0.5%, and June’s growth was revised up further to +1.0%, seasonally adjusted, according to the Census Bureau today (blue in the chart).
The three-month average growth, which irons out the month-to-month squiggles, at 0.73%, was the best growth since May 2022 (red). That’s substantial growth. Consumers are out there, spending.
And it wasn’t all inflation. Retailers sell goods, not services, and inflation in goods was low in August, except in gasoline, food, and used vehicles. The driver behind inflation came from services – housing, insurance, subscriptions, healthcare, etc. – and services are two-thirds of consumer spending, but retailers don’t sell those services and their inflation rates don’t apply to retail sales. What applies to retail sales are the inflation rates for the goods that retailers sell, more in a moment.
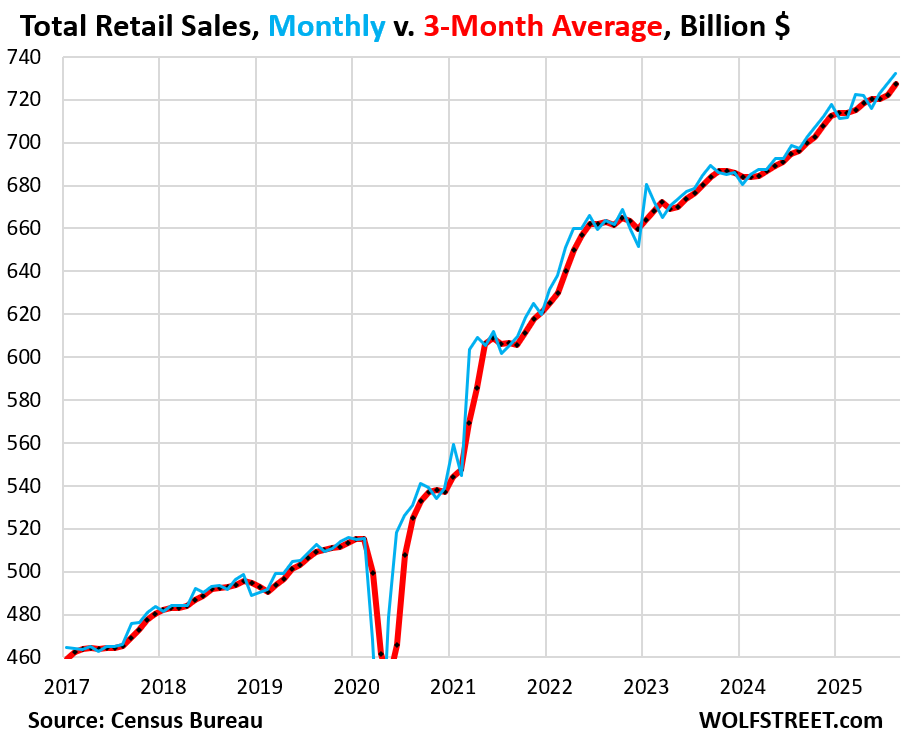
Year-over-year, retail sales in August rose 5.0% seasonally adjusted, which includes adjustments for the number of “selling days” in a month.
And not seasonally adjusted, they rose 3.5% year-over-year to $745 billion,
There had been some gyrations earlier this year for sales at auto and other motor vehicle dealers, which account for 18% of total retail sales. They move the needle.
Sales at auto and other motor vehicle dealers had spiked in March, driven in part by manipulative fearmongering about tariffs making new vehicles 20% more expensive or whatever, repeated endlessly and gleefully in the agenda-driven media and social media, which triggered some frontrunning by consumers.
When that nonsense dissipated, sales dropped off from those highs for a few months, as new-vehicle prices didn’t rise at all because automakers and dealers could not increase prices and could not pass on any tariffs because prices were already sky-high after the ridiculous price spikes in 2020-2022, leading to even more ridiculous profit margins in the industry. Instead, price cuts were needed to stimulate demand.
Then in July and August, sales at auto and other motor-vehicle dealers bounced back to normal growth trend. In August, sales rose by 0.4% from July and were up 5.9% year-over-year (seasonally adjusted, blue).
Even the three-month average could not iron out those gyrations (red). It rose by 1.2% in August from July, but that wasn’t enough to make up for the drops in the prior two months.
Year-over-year, the three-month average rose by 6.0% in August.
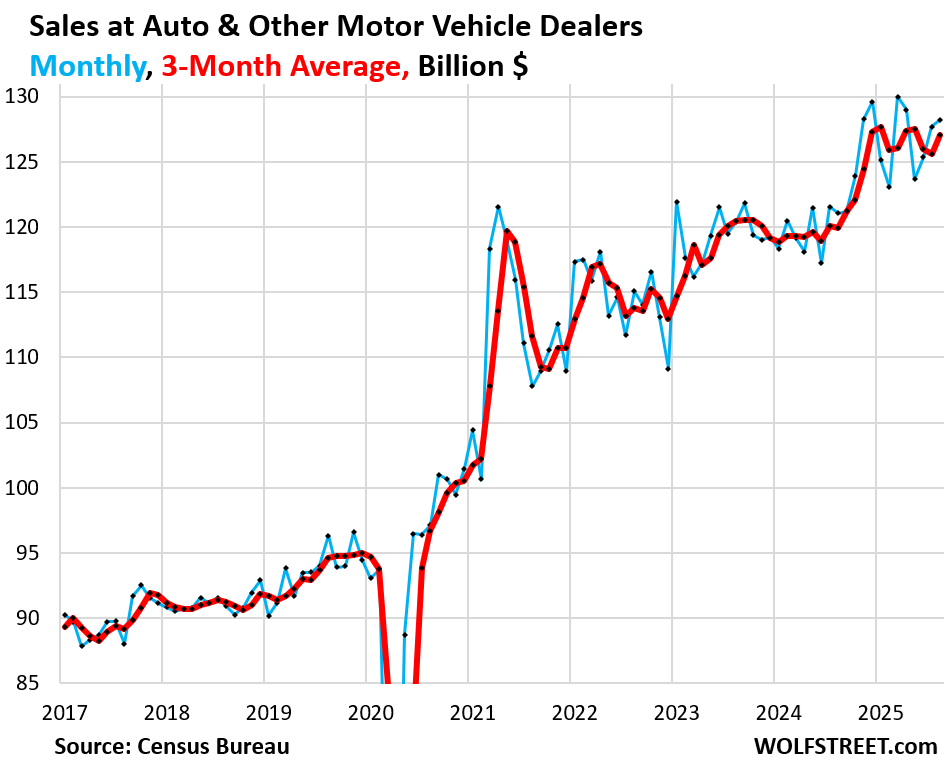
But inflation in new vehicles has been zero to negative in 2025 so far, after the horrendous price spike in 2020 to mid-2022 when consumers, stuffed to the gills with free money, were willing to pay whatever — when money is free, prices don’t matter — and dealers and automakers made sure consumers did pay whatever and laughed all the way to the bank.
But when consumers were suddenly unwilling to just pay whatever, the price explosion then hit a ceiling and price cuts via incentives and discounts were needed to move the iron.
And there’s another shift we’re seeing related to tariffs: Closing the loophole of the “de minimis” exemption caused direct sales from entities in China and other countries to US consumers to plunge. Some of those sales that used to be shipped from foreign entities directly to US consumers, thereby bypassing US-retail locations, may have bypassed the tracking methods by the Census Bureau, which is based on surveys sent to US retail locations.
When those sales shifted back to US-located brick-and-mortar stores and ecommerce operations, they would have a better chance of getting picked up by the surveys sent to US retail locations.
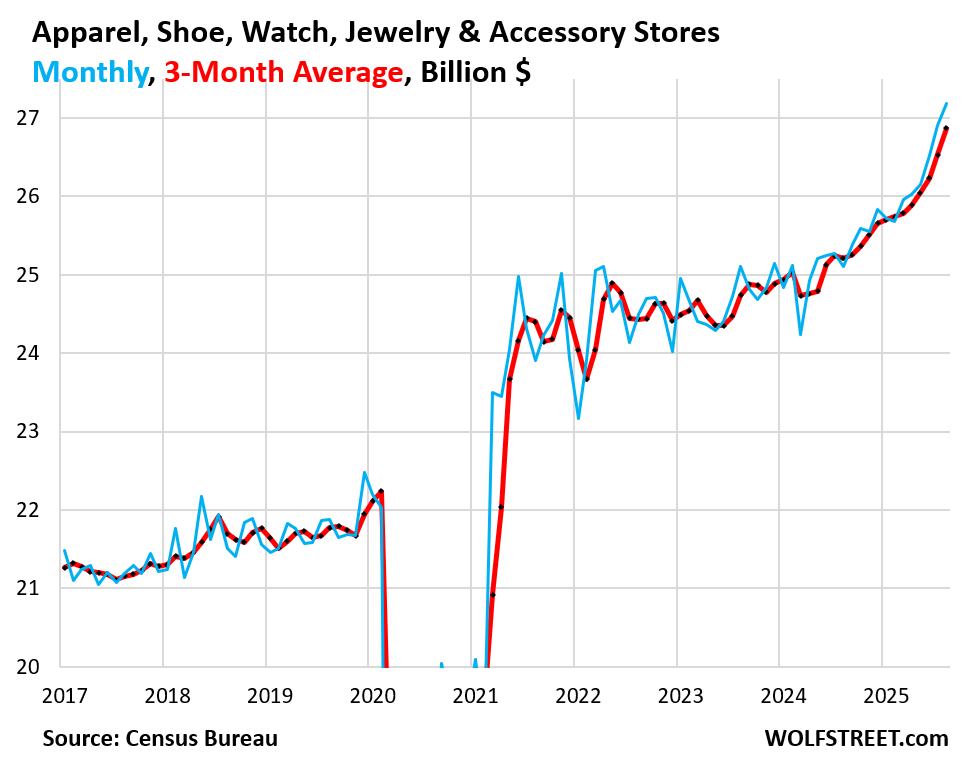
We saw for example, large increases in sales at US-located retailers of apparel, shoes, watches, accessories, etc. And we saw an equally substantial increase in ecommerce sales.
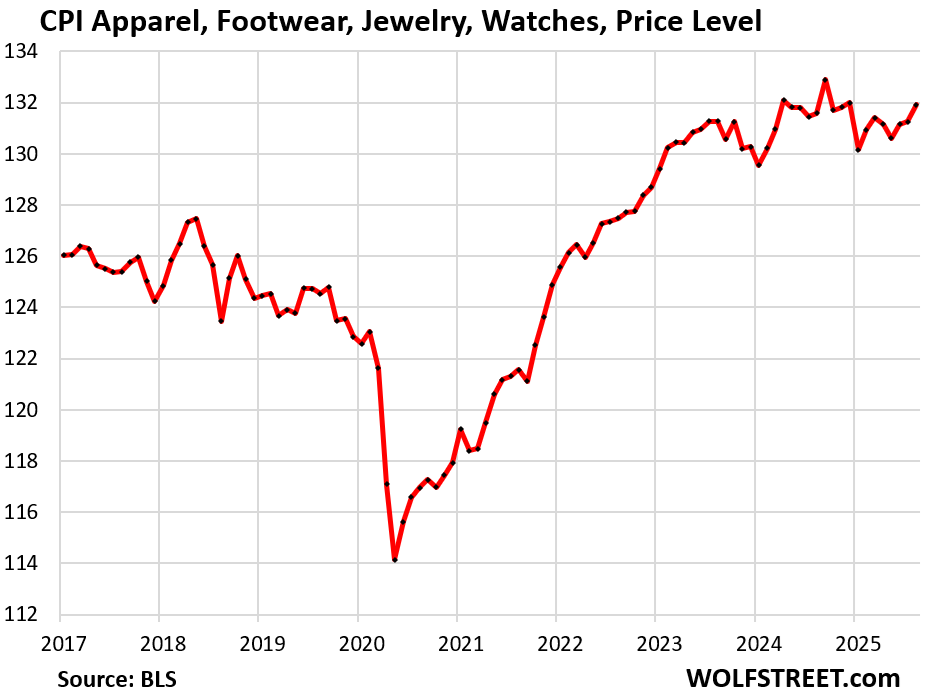
At brick-and-mortar stores for apparel, shoes, watches, jewelry, and accessories, sales jumped by 1.0% in August from July, on top of the big jumps in the prior two months, to $27 billion seasonally adjusted (blue).
The three-month average jumped by 1.3% month-to-month and was up by 6.6% year-over-year.
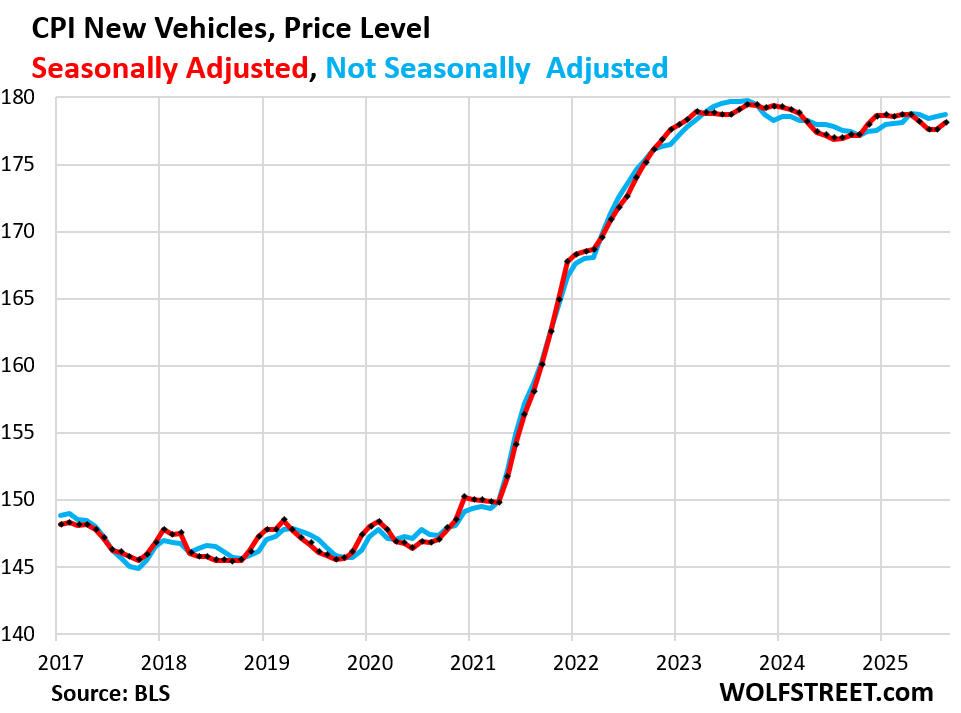
But inflation for apparel, shoes, watches, jewelry, and accessories has been essentially zero for the past two years, after the massive price spike in 2021 to mid-2023. The CPI for these goods in August was a hair below where it had been in December 2024, despite some gyrations in between:
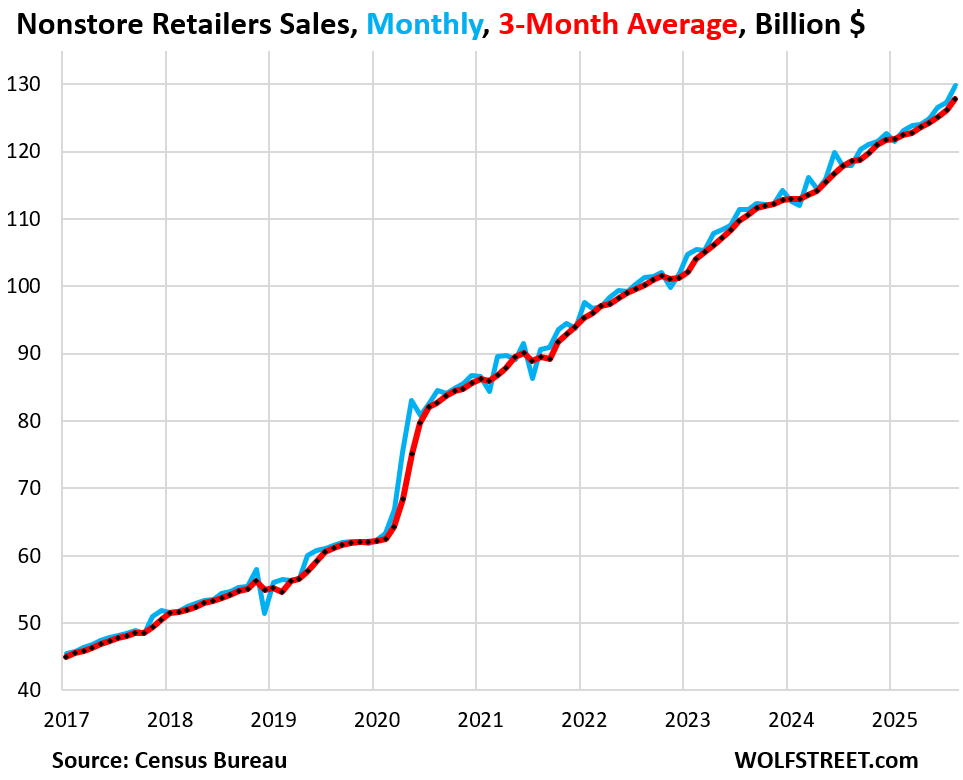
Ecommerce locations in the US may be experiencing a similar shift by consumers to forego direct-shippers overseas and buy from US-located ecommerce operations, such as from Amazon, Walmart, Macy’s, etc.
Sales at ecommerce retailers in the US jumped by 2.0% in August from July, and by 10.1% year-over-year, to $130 billion.
The three-month average jumped by 1.3% month-to-month and by 7.8% year-over-year. Ecommerce is the second-largest retailer category after auto dealers, and it moves the needle (17% of total retail sales).
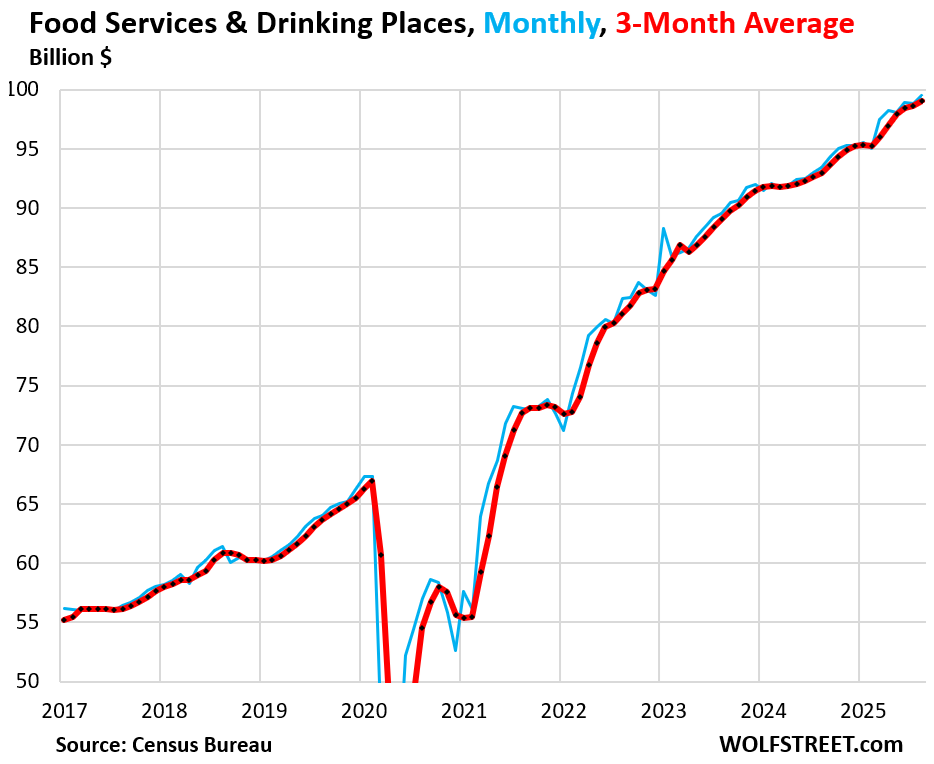
Restaurants and bars are the ultimate test for discretionary spending by consumers. And consumers – our Drunken Sailors, as we have come to call them lovingly and facetiously – are splurging.
Sales jumped by 0.7% in August from July and by 6.5% year-over-year, to $100 billion. This is the third-largest retailer category, behind auto dealers and ecommerce (13% over overall retail sales).
Three-month average sales rose by 0.5% for the month and by 6.6% year-over-year.
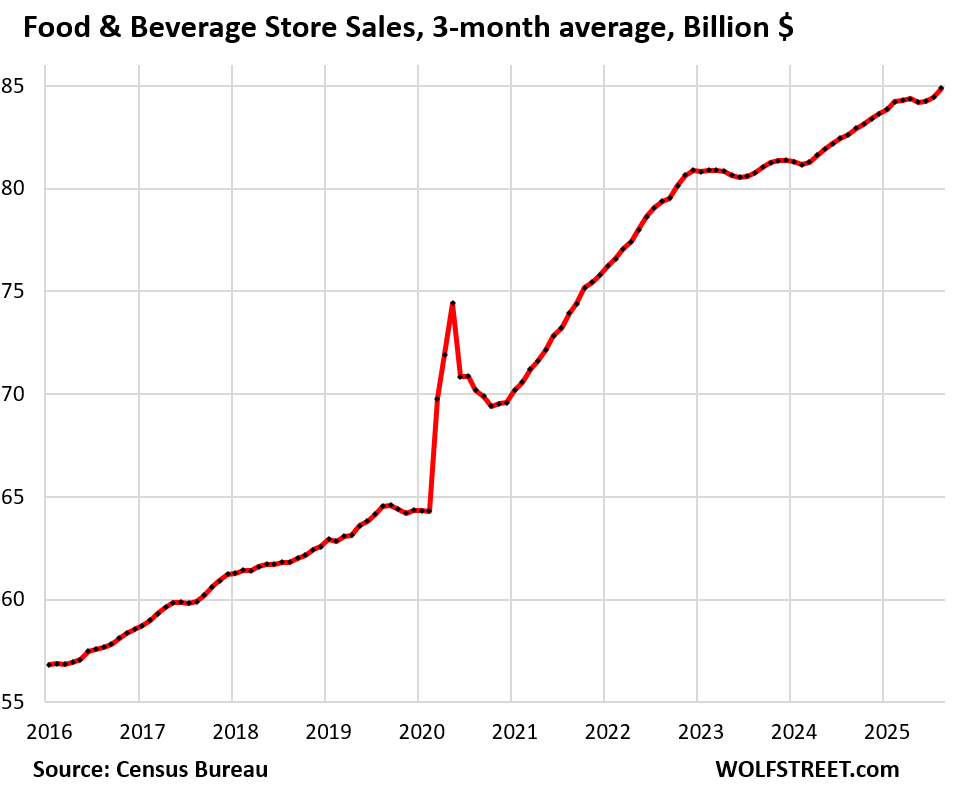
At food and beverage stores, sales rose by 0.3% month-to-month, and by 2.7% year-over-year, to $85 billion.
The three-month average sales rose by 0.5% month-to-month and by 2.7% year-over-year.
This category of brick-and-mortar supermarkets, grocery stores, and beverage stores, is driven by population increases and price increases, and is largely immune to recessions. It’s the #4 category (12% of total retail sales).
But it faces structural headwinds: More grocery sales are migrating from brick-and-mortar stores in this category to “general merchandise stores,” such as Walmart and Costco (see “general merchandise stores” below) and to ecommerce (see above).
In a decades-long trend, food purchases at stores have also wandered off to restaurants, as our Drunken Sailors have turned eating into an outside-the-home experience (see “restaurants and bars” above).
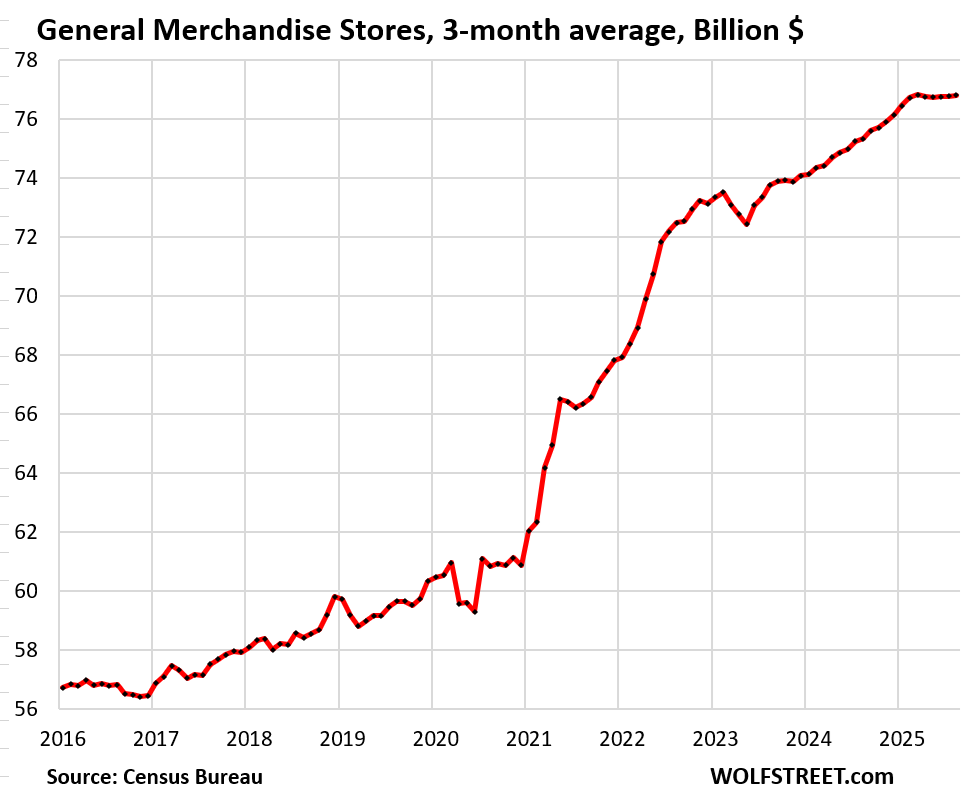
At general merchandise stores, sales dipped by 0.1% month-to-month to $77 billion, but were up by 1.9% year-over-year.
Three-month average sales: +0.3% month-to-month and +2.4% year-over-year (#5 category, 11% of total retail).
Walmart is the largest grocer in the US, and its grocery sales are included here. But its huge ecommerce operations are included in ecommerce above. What’s doing well at Walmart’s brick-and-mortar stores is food. The stuff in the rest of the aisles? Meh.
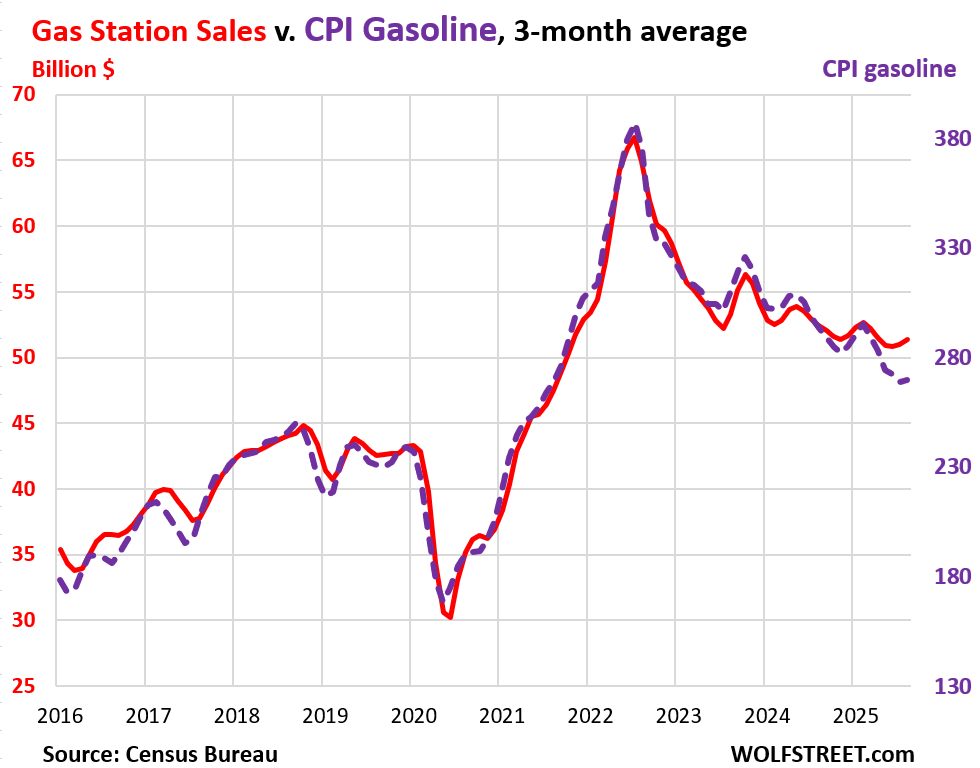
Gas station sales normally move in near-lockstep with the price of gasoline. The price of gasoline started plunging in mid-2022 and then continued to zigzag lower. Gasoline sales in dollar terms followed the price down, but started diverging in recent months.
The three-month average sales at gas stations jumped by 0.7% in August from July, to $51 billion, but due to the plunge in gasoline prices over the prior 12 months, dipped by 2.1% year-over-year (red).
The three-month CPI for gasoline rose by 0.2% in August from July but fell by 8.1% year-over-year (dotted purple).
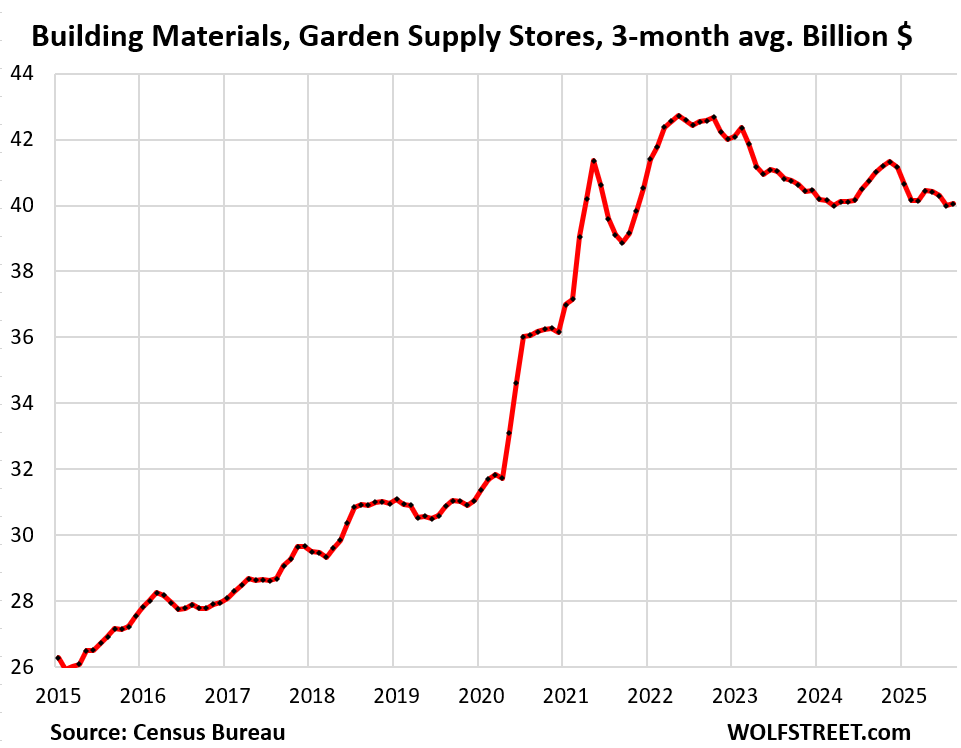
At building materials, garden supply and equipment stores, three-month average sales inched up by 0.2%, to $40 billion, but declined by 1.7% year-over-year. Sales have been essentially flat for a year-and-a-half, after coming off the pandemic spike:
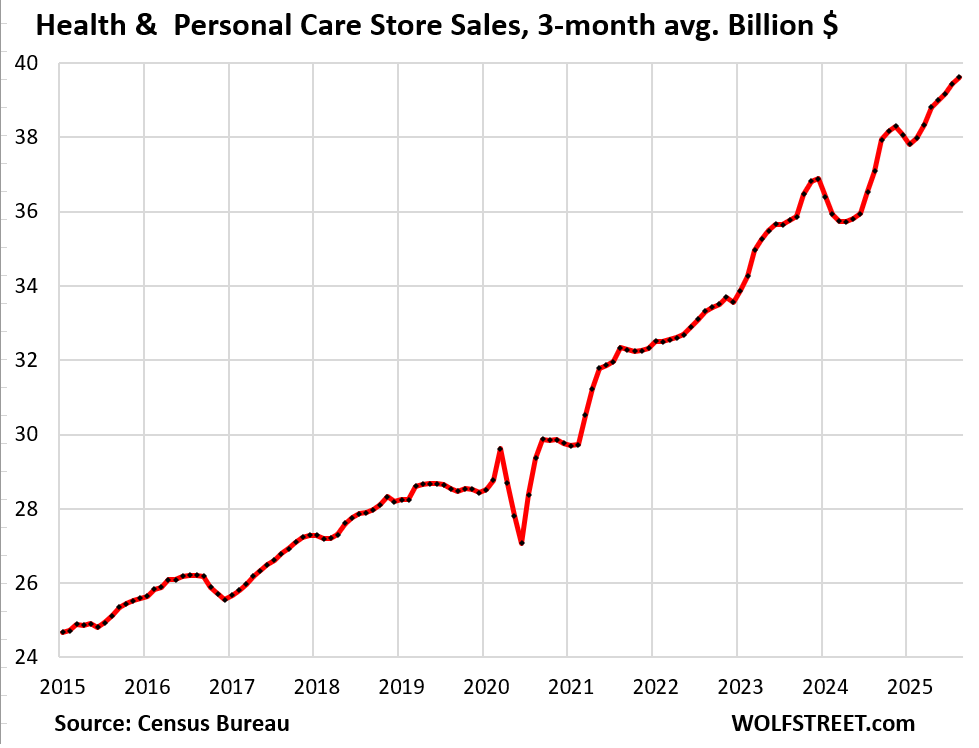
At health and personal care stores, three-month average sales rose by 0.5% month-to-month and by 6.8% year-over-year to $40 billion.
Enjoy reading WOLF STREET and want to support it? You can donate. I appreciate it immensely. Click on the mug to find out how:

![]()
I do most of my discretionary shopping using mail order catalogs and some on-line retailers. I get a dozen catalogs mailed to me. Goods are delivered right to my door. Since the pandemic, I never go to malls or retail stores other than grocery, hardware, and office supply stores. Would the mail order catalog sales be included in Non-Store retail sales? The chart above does not have any summary below like the rest of them.
Mail order catalog? What is this, 1978? I haven’t seen one in probably 20 years. Remember to put sarcasm at the end of the comment when we’re being funny.
FranWex – your comment really made me laugh. Yeah, it seems like those catalogs are from 20 to 40 years ago. Like pay phones!
However…..some companies still mail catalogs….LL Bean, and others. Sure, you normally order via the internet, but the catalogs are like the ones of old. So, maybe our buddy above isn’t just reminiscing about days long gone. Some companies still do catalogs!
Uline does catalogs like nobody’s business!
Garden supply ‘porn’! In full color on glossy paper!
It’s easier to shop on-line, and the choices are greater, rather than driving to any store.
Technological improvements have a tendency to counteract some of the worst effects of inflation, and we are still progressing in the Industrial Revolution to improved processes and tools, so the long-term prognosis for inflation is good.
The issue isn’t continuing productivity, as that is a given, but how increases in productivity are reflected in wages. Basically it stayed even from the 40s through 70s then the great decoupling occured. I’m not suggesting productivity changes purely through use of automation and technology should be reflected in wage labor but it does create challenges as you need a consumer base to spend money. Right now it is relatively holding up but hard to see that in the long term and certainly not with some big challenges. Congress has some solid work to do which should have begun decades ago and not sure at this point how, even if they wanted, could make up for that lost time.
I always thought the U S had a deflationary bent to the economy. (Example tv prices dropping every year) sales and big price drops on food and clothes and Amazon Black Friday deals, etc. Now I think 2 things have changed that. The buying out, postponing, of recessions and the drastic policy changes this year among them immigration, firings/quits, and tariffs . Time will tell how these changes effect prices and the economy.
TVs are half as expensive relative to income but last less than half as long so total spend over time is the same or greater.
Hopefully getting rid of the de minimis exception means I stop seeing all these cheap, no-name car parts on eBay and Amazon – like the $90 catalytic converter listing I saw yesterday…
Good Gawd!
I dunno. My wife buys stuff from Temu. She bought a dress for $7 that was identical to one she almost bought in Macy’s for $55. Why be forced to give Macy’s shareholders a cut of our income?
So she sends US dollars directly to China, to circulate there, cause spending and investments there, and stimulate the Chinese economy, to the detriment of the US economy (dollars getting siphoned out and not circulating here and not being available for spending and investment here). It’s bad for the US economy, but I understand why she’s doing it, and I don’t have a problem with it as long as she pays the tariffs to the US government on the $7 dress.
Logical until you realize that the $7 still flows to China, while Macy’s pockets the remaining $48. What you’re actually saying is that consumers should subsidize US retail instead of deploying their capital more efficiently. That’s not just illogical, it’s a textbook case of funding inefficient capital allocation.
Consumers like this should pay the tariffs if they buy direct from China!! Temu, a huge company, abused the de minimis exemption, which was designed for regular people to send stuff to each other. That loophole is now closed. That’s what this is about.
My preference is to buy directly from the manufactures who build products in the USA. Yesterday, I did that.
Dan Clark Audio makes planar magnetic headphones in San Diego, California. There is a pair of Dan’s ‘phones in transit to South Minneapolis today. Nope, no tariffs need to be dealt with on this.
The headphones will be connected to a one month-old DAC, that was made in Texas, and purchased directly from Schiit Audio in August. (“August Retail Sales”) In between the DAC and my new ‘phones is a Schiit Audio headphone amp that was also made in Texas. Nope, no tariffs applied to these either.
Made in the USA. The best quality there is. Every dollar spent went directly to the manufacturer. And the best part, to me at least, is that these products are designed and engineered by the people who built and run the companies ‘hands-on’ themselves.
Yeah, that’s the way to do it, eh?
I thought the bigger data point released today was import prices, which can reflect future inflation. Another data point for the Fed to lose sleep over.
Nah.
Wolf,
Interesting comment in your article:
“What’s doing well at Walmart’s brick-and-mortar stores is food. The stuff in the rest of the aisles? Meh.”
Three years ago Kroger built a larger store to replace the smaller one in town that only had food items. The new one has about 25% of the store dedicated to kids toys, clothing, shoes and other apparel. I am in at least once a week, and I can not recall seeing a single person trying on pants, shoes, etc. The food aisles are always packed with shoppers, except at night. I would estimate that 95-99% of their sales are food items.
I have often wondered why they just don’t get rid of the clothing and kids toy sections, and offer more food choices.
The only non food sections that stay somewhat busy are the pharmacy and the walk in clinic.
If they were the only store in town, it would make sense to have the extra space devoted to non-food items. But they are not.
The clothing aisle may not be busy but may still be very profitable. Margins on groceries are 1%, pants 25%.
The margin on Kroger’s groceries are well above 100% based on their absurdly and outrageous high prices and overcharging. Like $5.29 for a 16 oz. bottle of Kraft salad dressing! Their weekly circular is now good for nothing but a smirk and a laugh.
“Margins on groceries are 1%,”
That refers to net profit margins after tax for grocery stores, not gross margin. The range is 1%-3%. Clothing store net margins are only a little higher, not that much higher. Your 25% for clothing appears to be gross margin, but I think that’s wrong. Clothing routinely has 100%-plus gross margins. And higher end clothing has 300% and up.
Walmart had a net profit margin after tax of 2.9%.
GAP had net profit margin after tax of 5.5%
Albertsons Cos (includes Safeway) had a net profit margin of 1.1%.
It would be nice if they removed all the POP displays that block the aisles.
Not that it matters a bit, I was having coffee and a friend told me:
It’s possible for consumer demand to remain strong even as businesses become more cautious and scale back their long-term investments. In Q2 2025, this scenario played out with retail sales rising while nonfinancial business capital expenditures fell.
It seems that higher costs will be absorbed, but in this environment, I think many zombies will be more exposed — that may include both drunken sailors and companies that are running aground. Godbless the pirates, party on.
people spend in inflationary environment. Buy before stuff gets more expensive. Waiting costs more money. Isn’t this the main slogan of 2% inflation target? Now at 3%, it is even better.
In 2002 SPX was 1,000pts, today: 6,700pts. MIT: $36K/y, today: $90K/Y.
A house: $400K, today: $2M. Motorola Razr: $400, today Iphone: $1,000. Lexus ES300: $40K, today: $52K. Gold: $8K/kg, today: $120K/kg.
And when you sell things like houses, land, etc, you pay capital gains tax on the “profits”. These are not profits they are inflation. The government makes out like a bandit: taxes on inflation and debt repayment in devalued money.
Capital gains on real estate are only charged when you sell the property within 2 years of purchase. That’s for primary residence, you can also avoid cap gains tax on investment properties by doing a 1031 exchange: if you buy another investment property within 120 days of selling the first, then you do not owe taxes on the gains from the original sale.
Apropos nothing much, the month with the highest inflation in the UK is usually September. That’s because the ‘summer sales’ season runs from July to the August Bank Holiday at the end of August. The sales season is when retailers clear out their old stock before introducing new cold-weather stock in September. (There is a similar pattern with the Boxing Day sales starting at the end of December). I don’t know is the US has the same seasonal variations, but if so then there might be a jump in inflation and spending in the September numbers.
Sometimes I think my comments don’t make it by Wolf’s Politburo department – they seem to disappear 🫠 to Siberia (?) or somewhere.
But wow, i almost fell off my chair when he suggested (in comment section) that no financial institutions should have been bailed out in the Great Financial Crisis. One Vodka for you!
I’ve been saying this ever since I started the the predecessor website in 2011.
How about adding a tax on on unrealized capital gains? Remember when that was being proposed.
It appears that car companies aren’t the only ones who can’t pass off the cost of tariffs. I received an email today from a company called Asos (British company that sells clothes) saying they are covering all tariffs and duties for US buyers.