Amazing turn of events: From desperate “housing shortage” to massive inventory pile-up in four years.
By Wolf Richter for WOLF STREET.
Inventory of existing homes for sale in Texas jumped by 24% in July year-over-year, by 73% from July 2023, and by 208% from July 2021 – the period of inventory depletion – to 140,980 homes, the highest in at least the decade of data from Realtor.com. Compared to the Julys in 2017-2019, active listings were up by 32-37%.
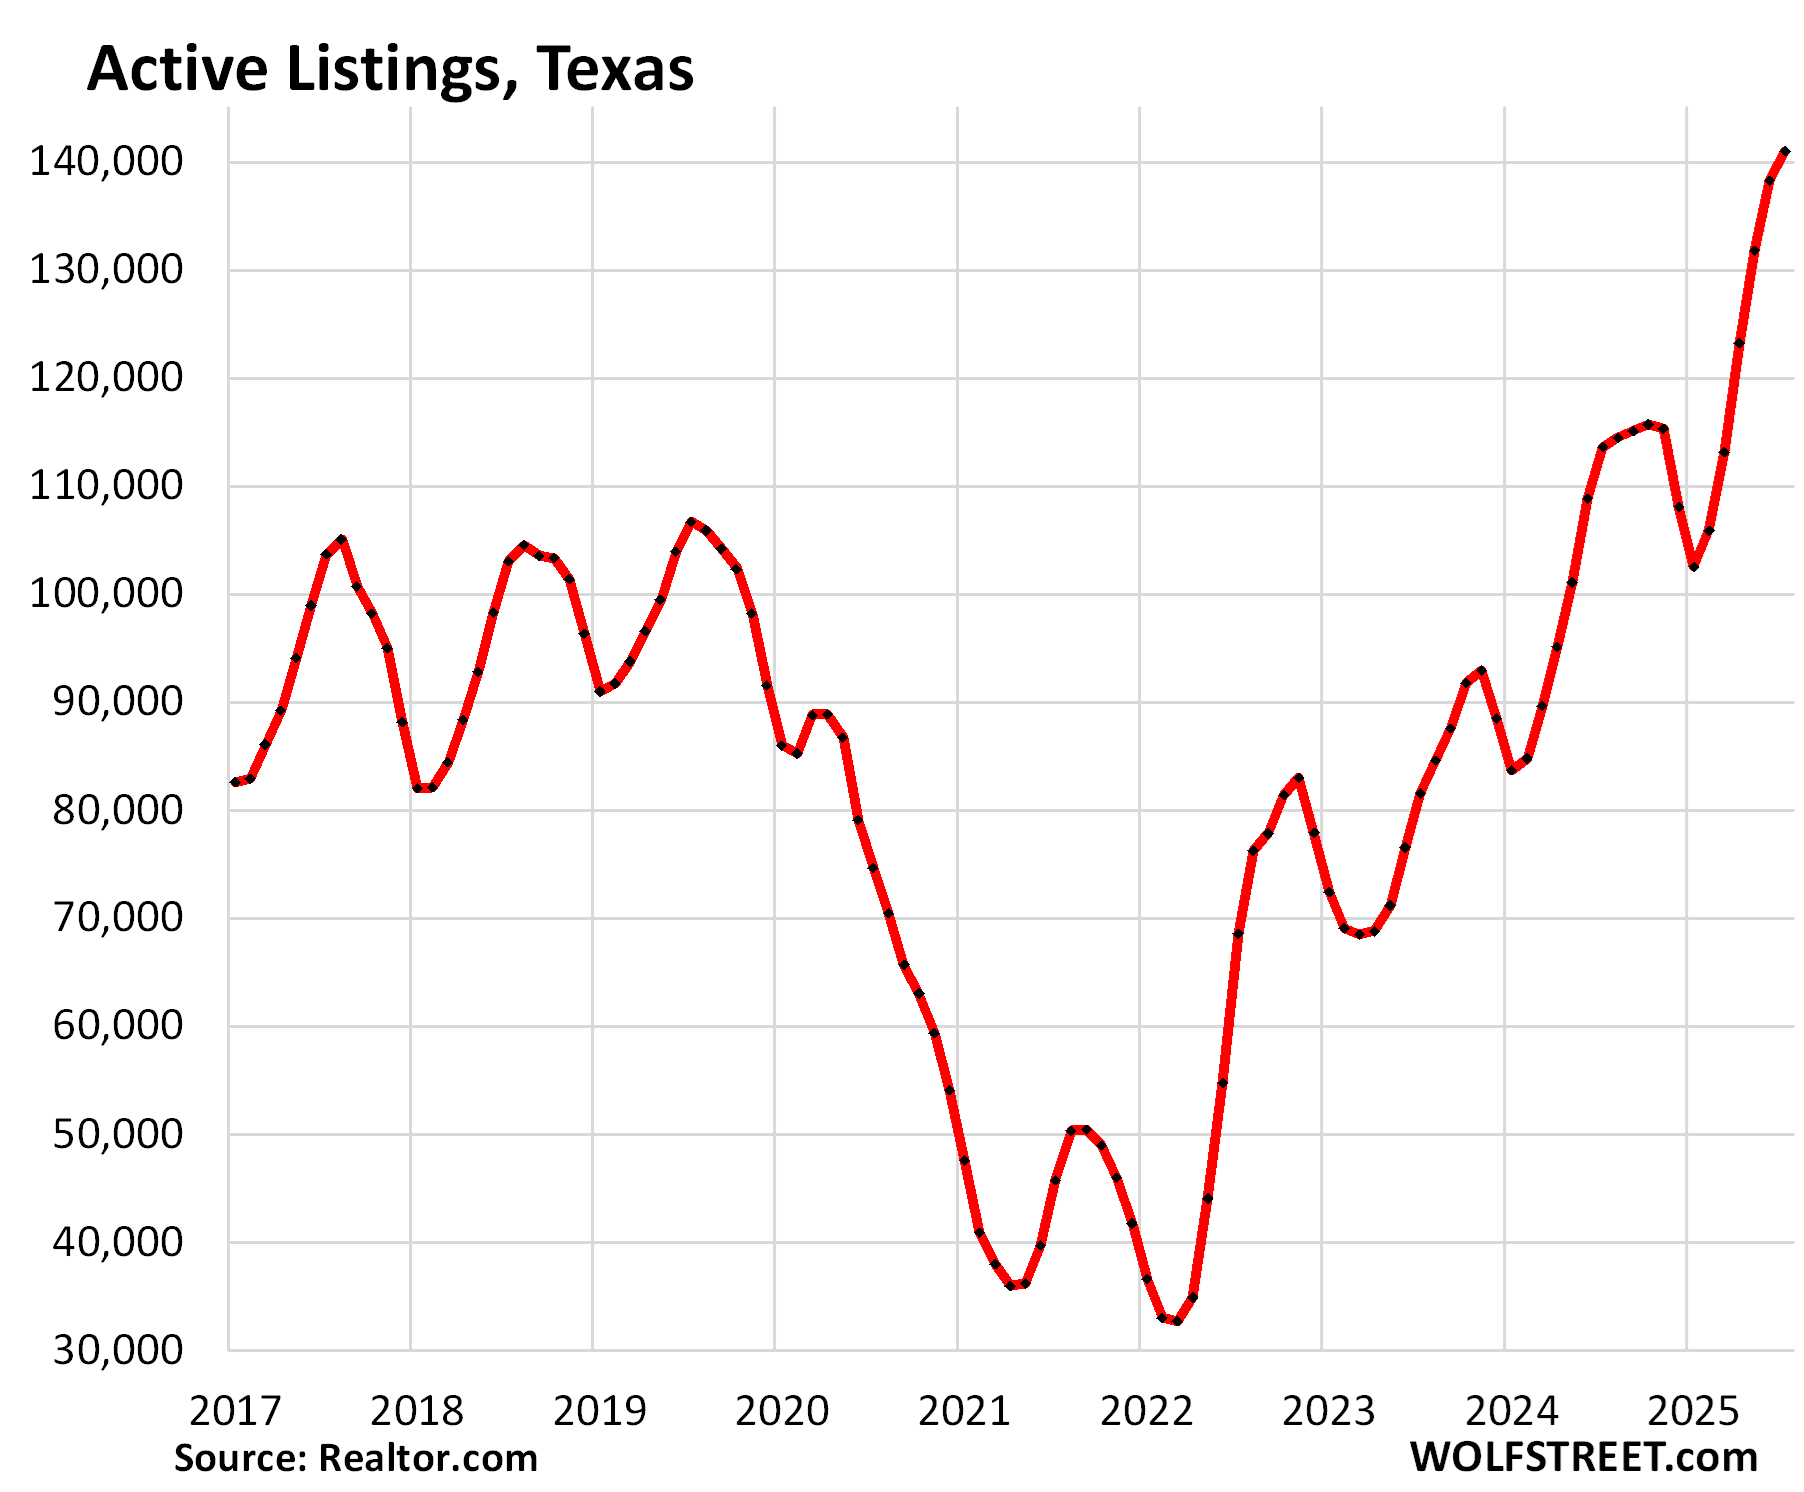
What a turn of events after the housing frenzy in 2020 through the first half of 2022, when inventory plunged to very low levels! At the time, enough buyers with access to cheap mortgages, and seeing the price-explosion underway, bought a new home and moved into it without putting their old home on the market. The goal was to ride up the price-explosion all the way up. The result was that inventory collapsed.
Now the buyers are gone because prices are too high, while some of those homes came out of the woodwork, inventory piled up and sits.
The median number of days that a home sits on the market before it gets pulled off the market or is sold jumped to 60 days in Texas, the highest for any July in the decade of data. The runner-up was July 2024 with 55 days.
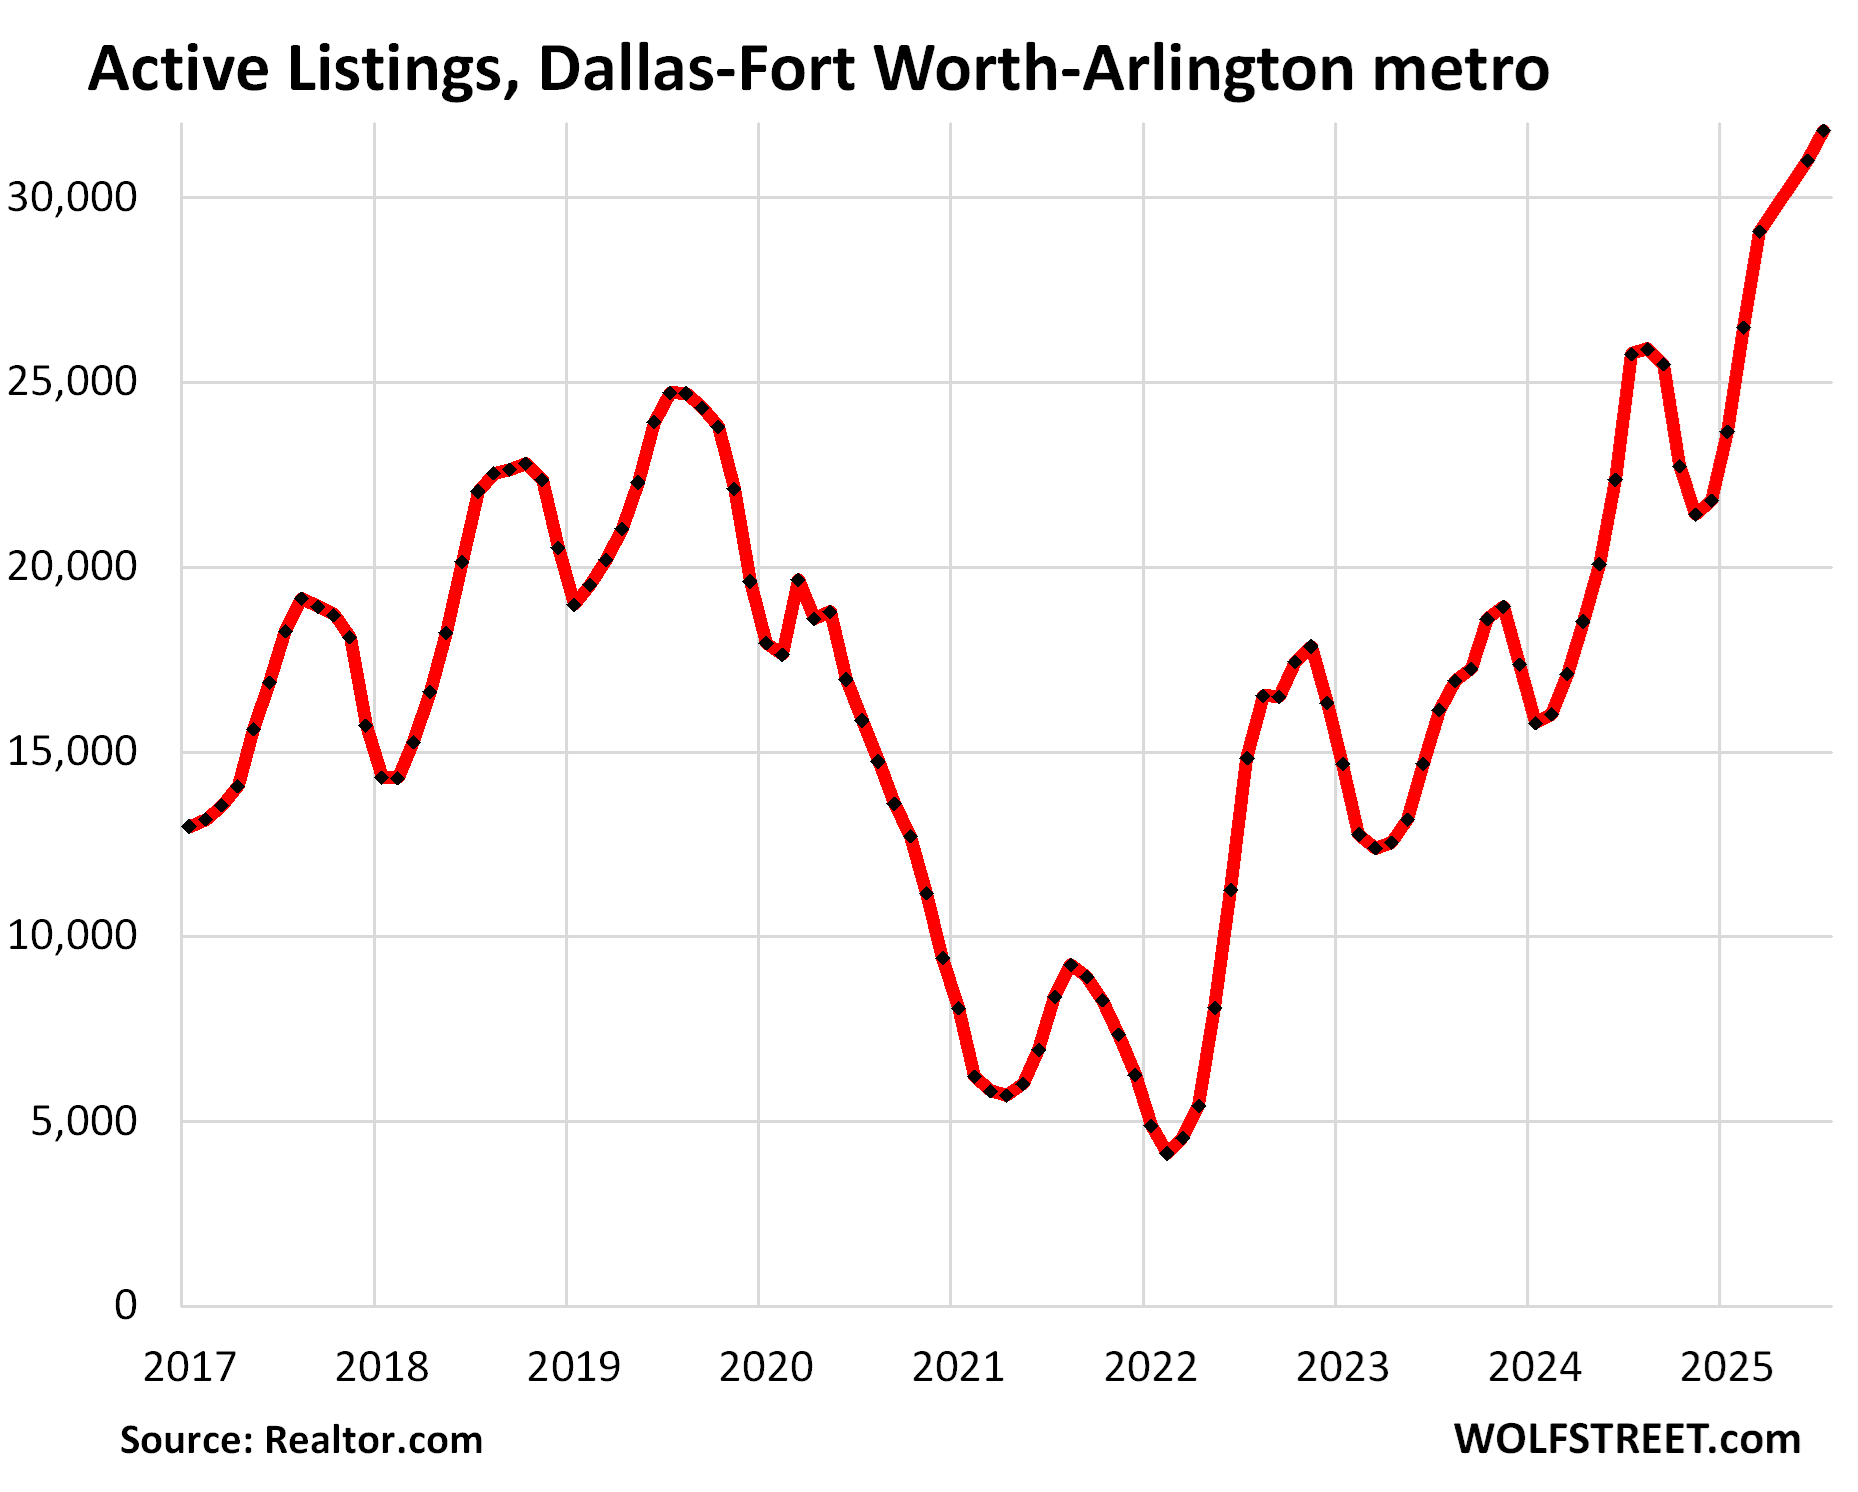
In the Dallas-Fort Worth-Arlington metro, active listings spiked by 58% year-over-year, by 142% from July 2023, and by 430% from July 2021 – the period of depletion – to 31,819 homes, the highest in at least the decade of the data by Realtor.com.
Compared to 2017, active listings are up by 104%, compared to 2018 by 75%, and compared to 2019 by 43%! Summers are the seasonal high points in terms of inventory.
During the final paroxysm of the buying frenzy in early 2022 – it began dying in mid-2022 – active listings dropped below 5,000, which was essentially near-zero for a huge housing market like the Dallas-Fort Worth metropolitan area.
The median number of days that a home spent on the market before it sold or was pulled off the market jumped to 53 days, the highest for any July in the decade of data.
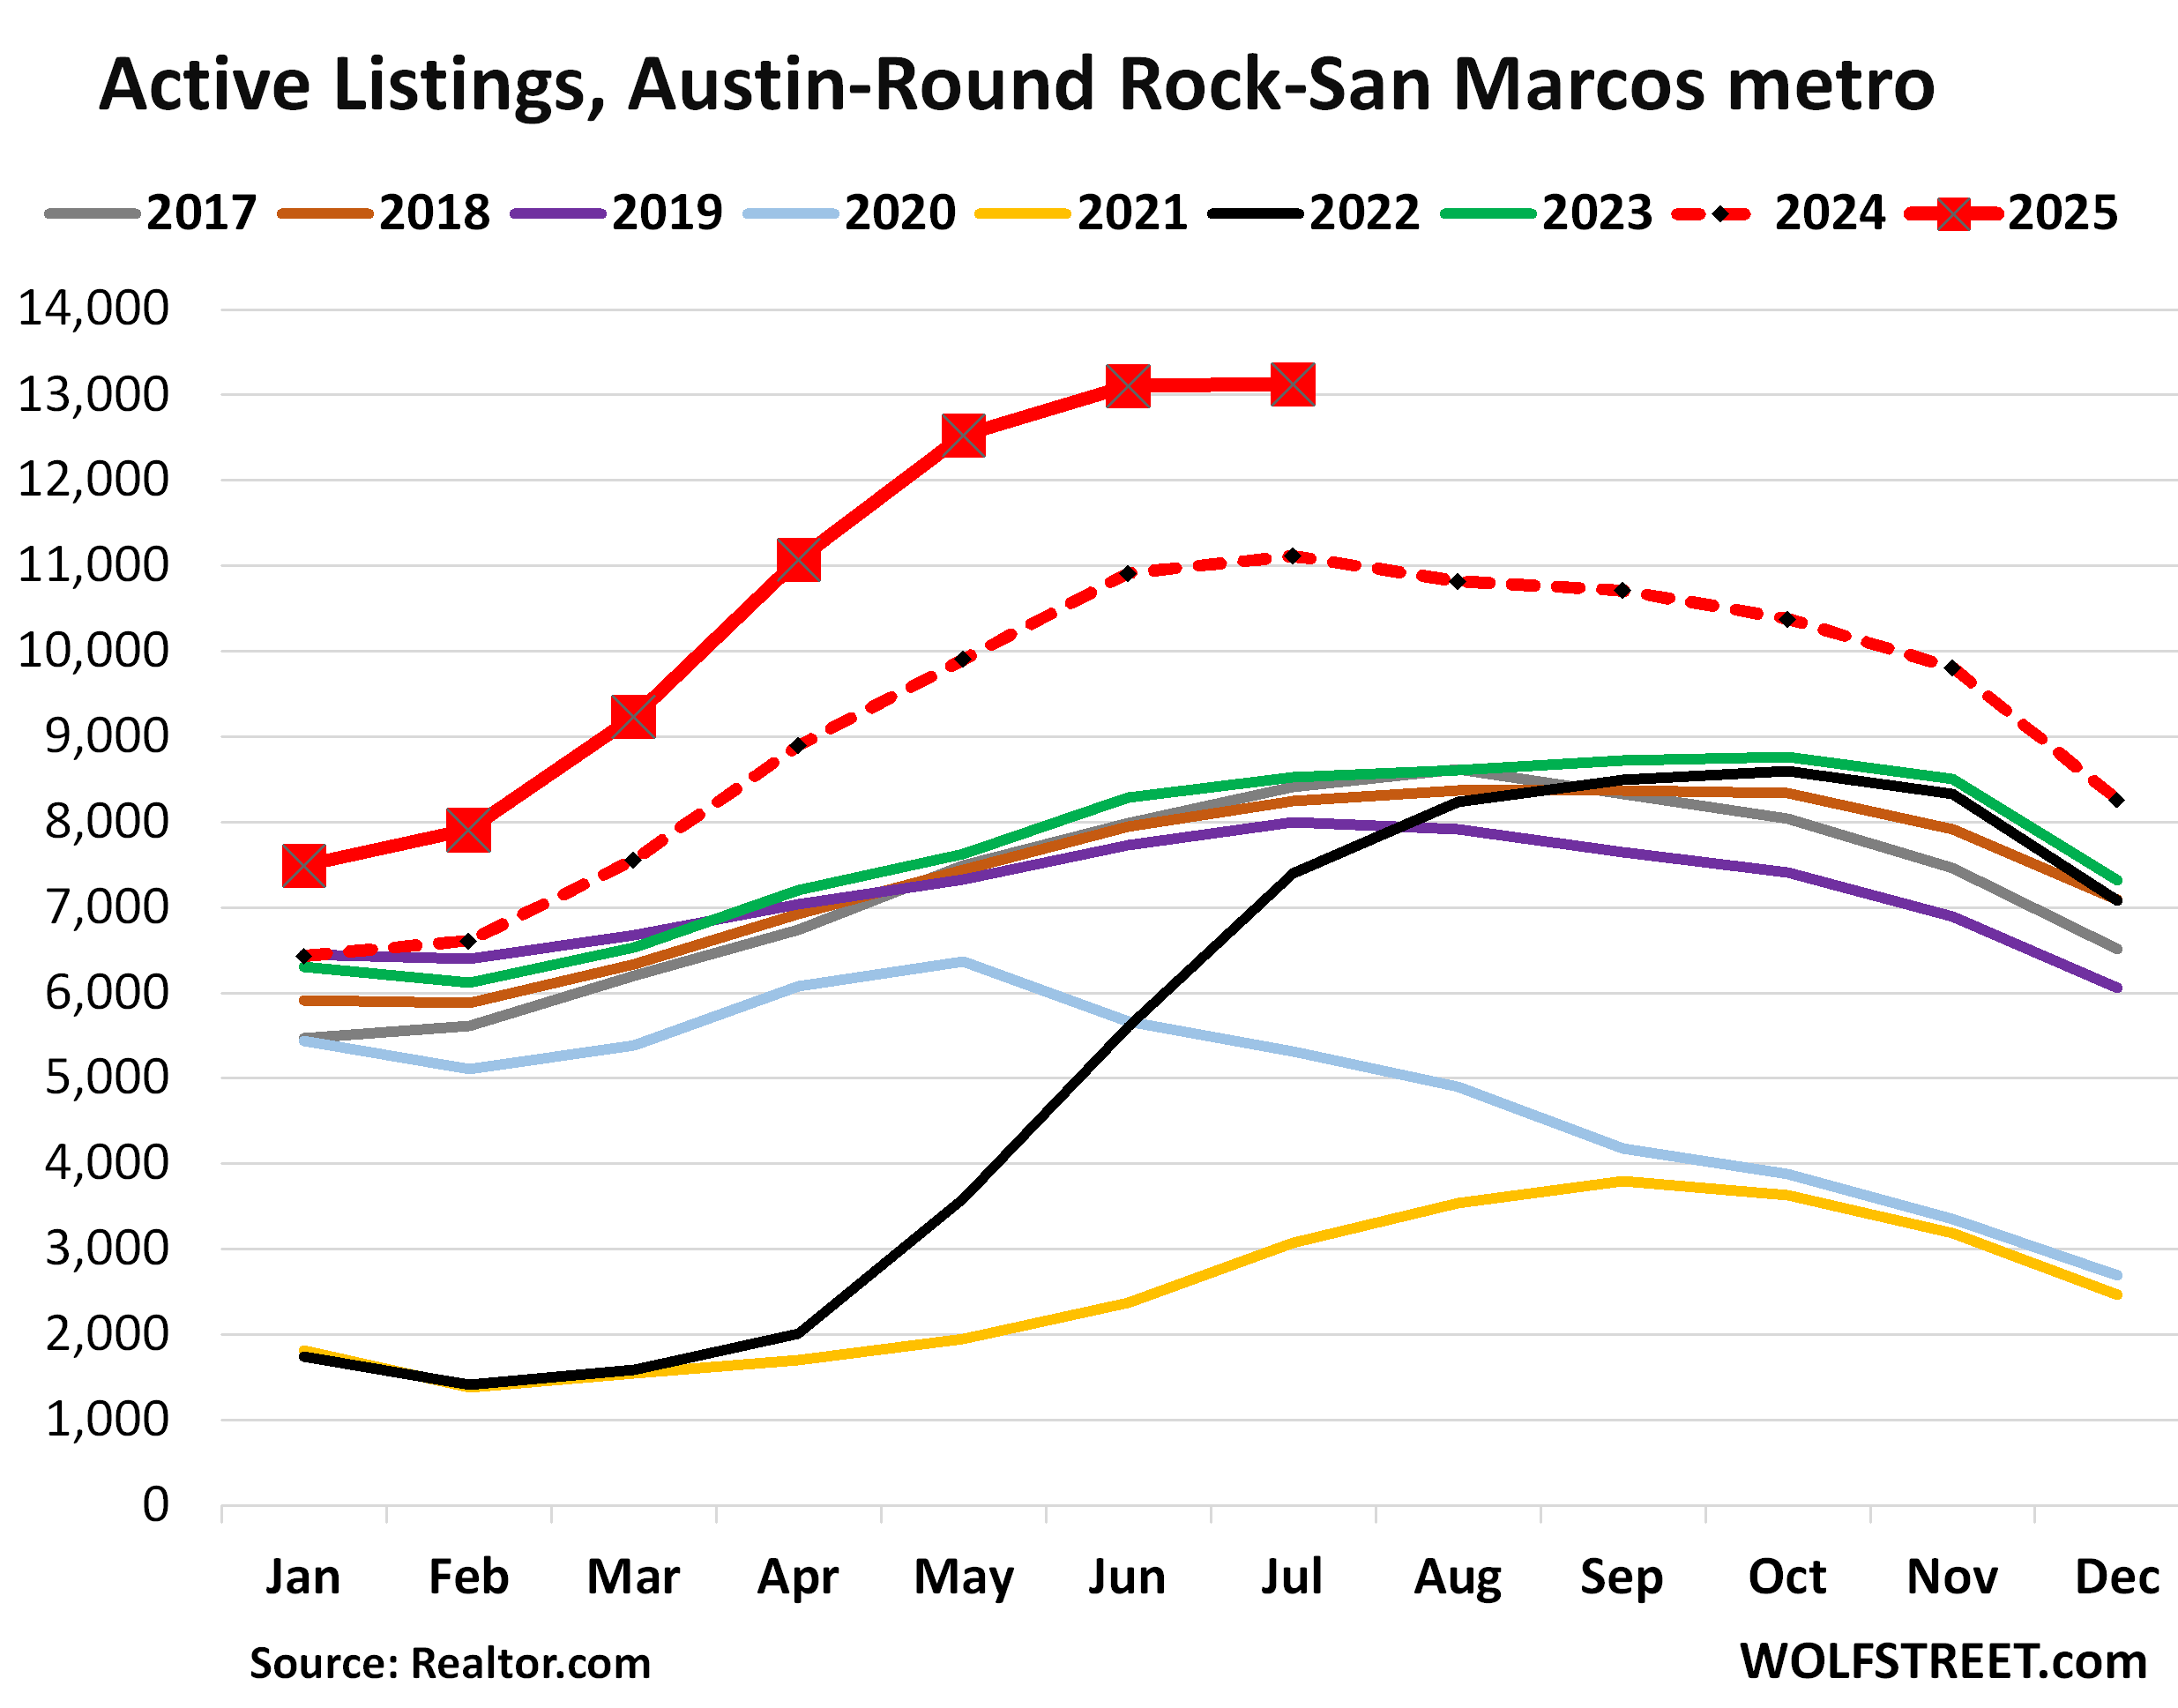
In the Austin-Round Rock-San Marcos metro, active listings jumped by 18% from July last year, when inventories had already carved out a record in the decade of data from Realtor.com; and by 327% from July 2021 when the buying frenzy had depleted inventories; and by 64% from July 2019; to 13,123 homes, the highest in the decade of data by Realtor.com.
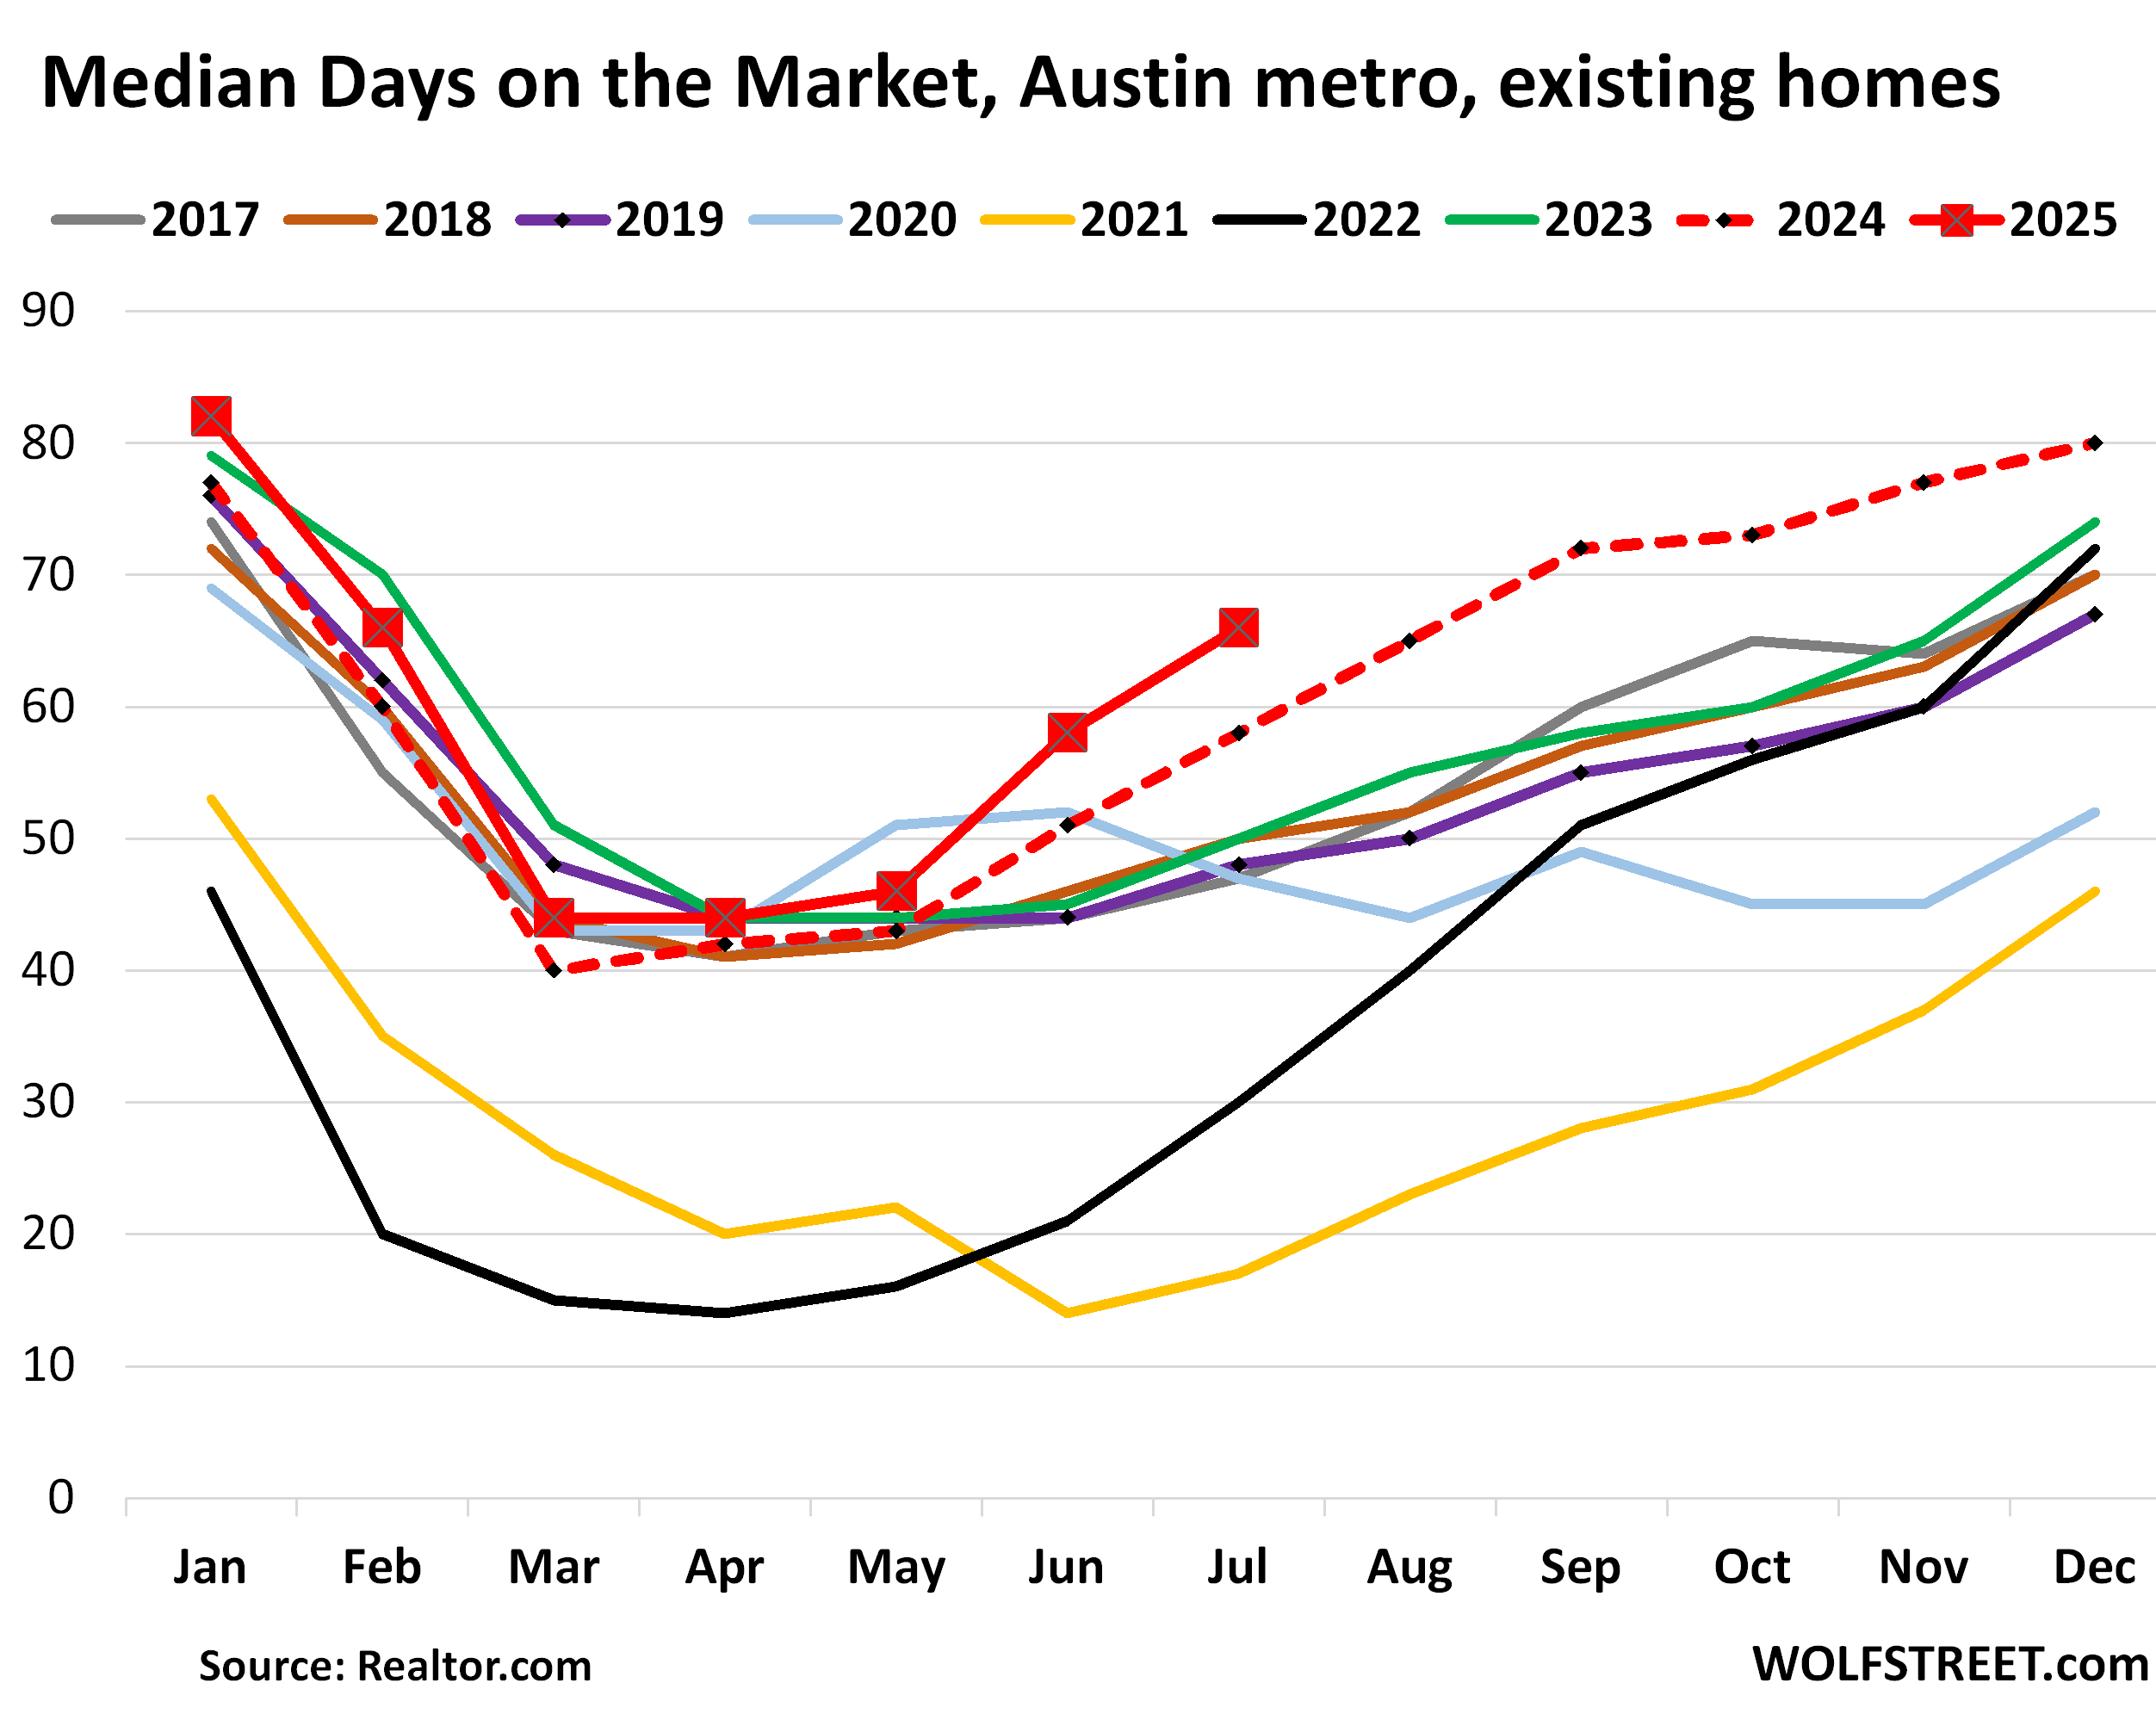
The median number of days a home spent on the market before it sold or was pulled off the market jumped to 66 days, the highest for any July in the decade of data.
Home prices are skidding lower across Texas, but the Austin metro is ahead again of the other big metros in Texas. From mid-2019 through mid-2022, over those three years, prices had exploded by 78%. Since then, transaction prices in the Austin metro have dropped already by over 23% from the peak, having given up now roughly half of the 78% three-year price explosion.
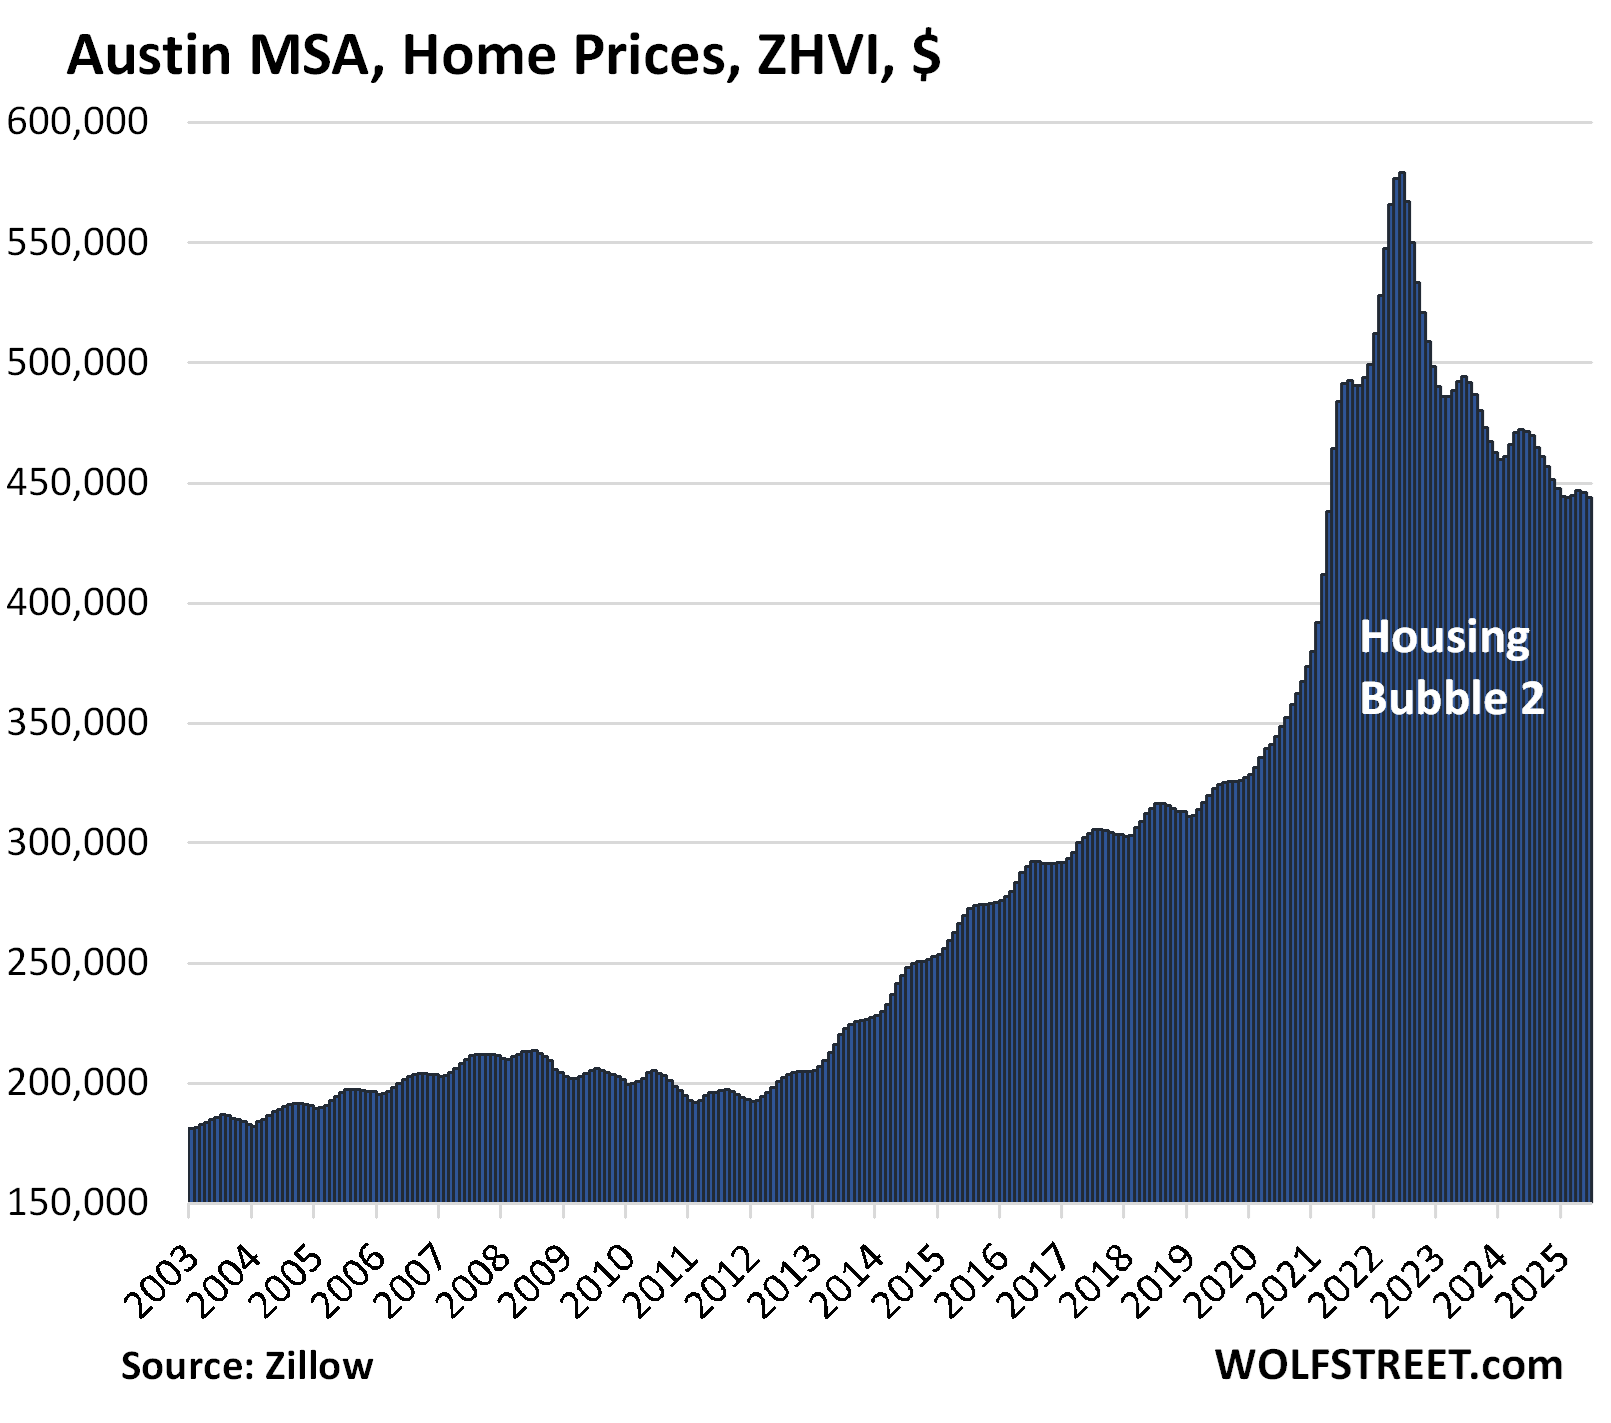
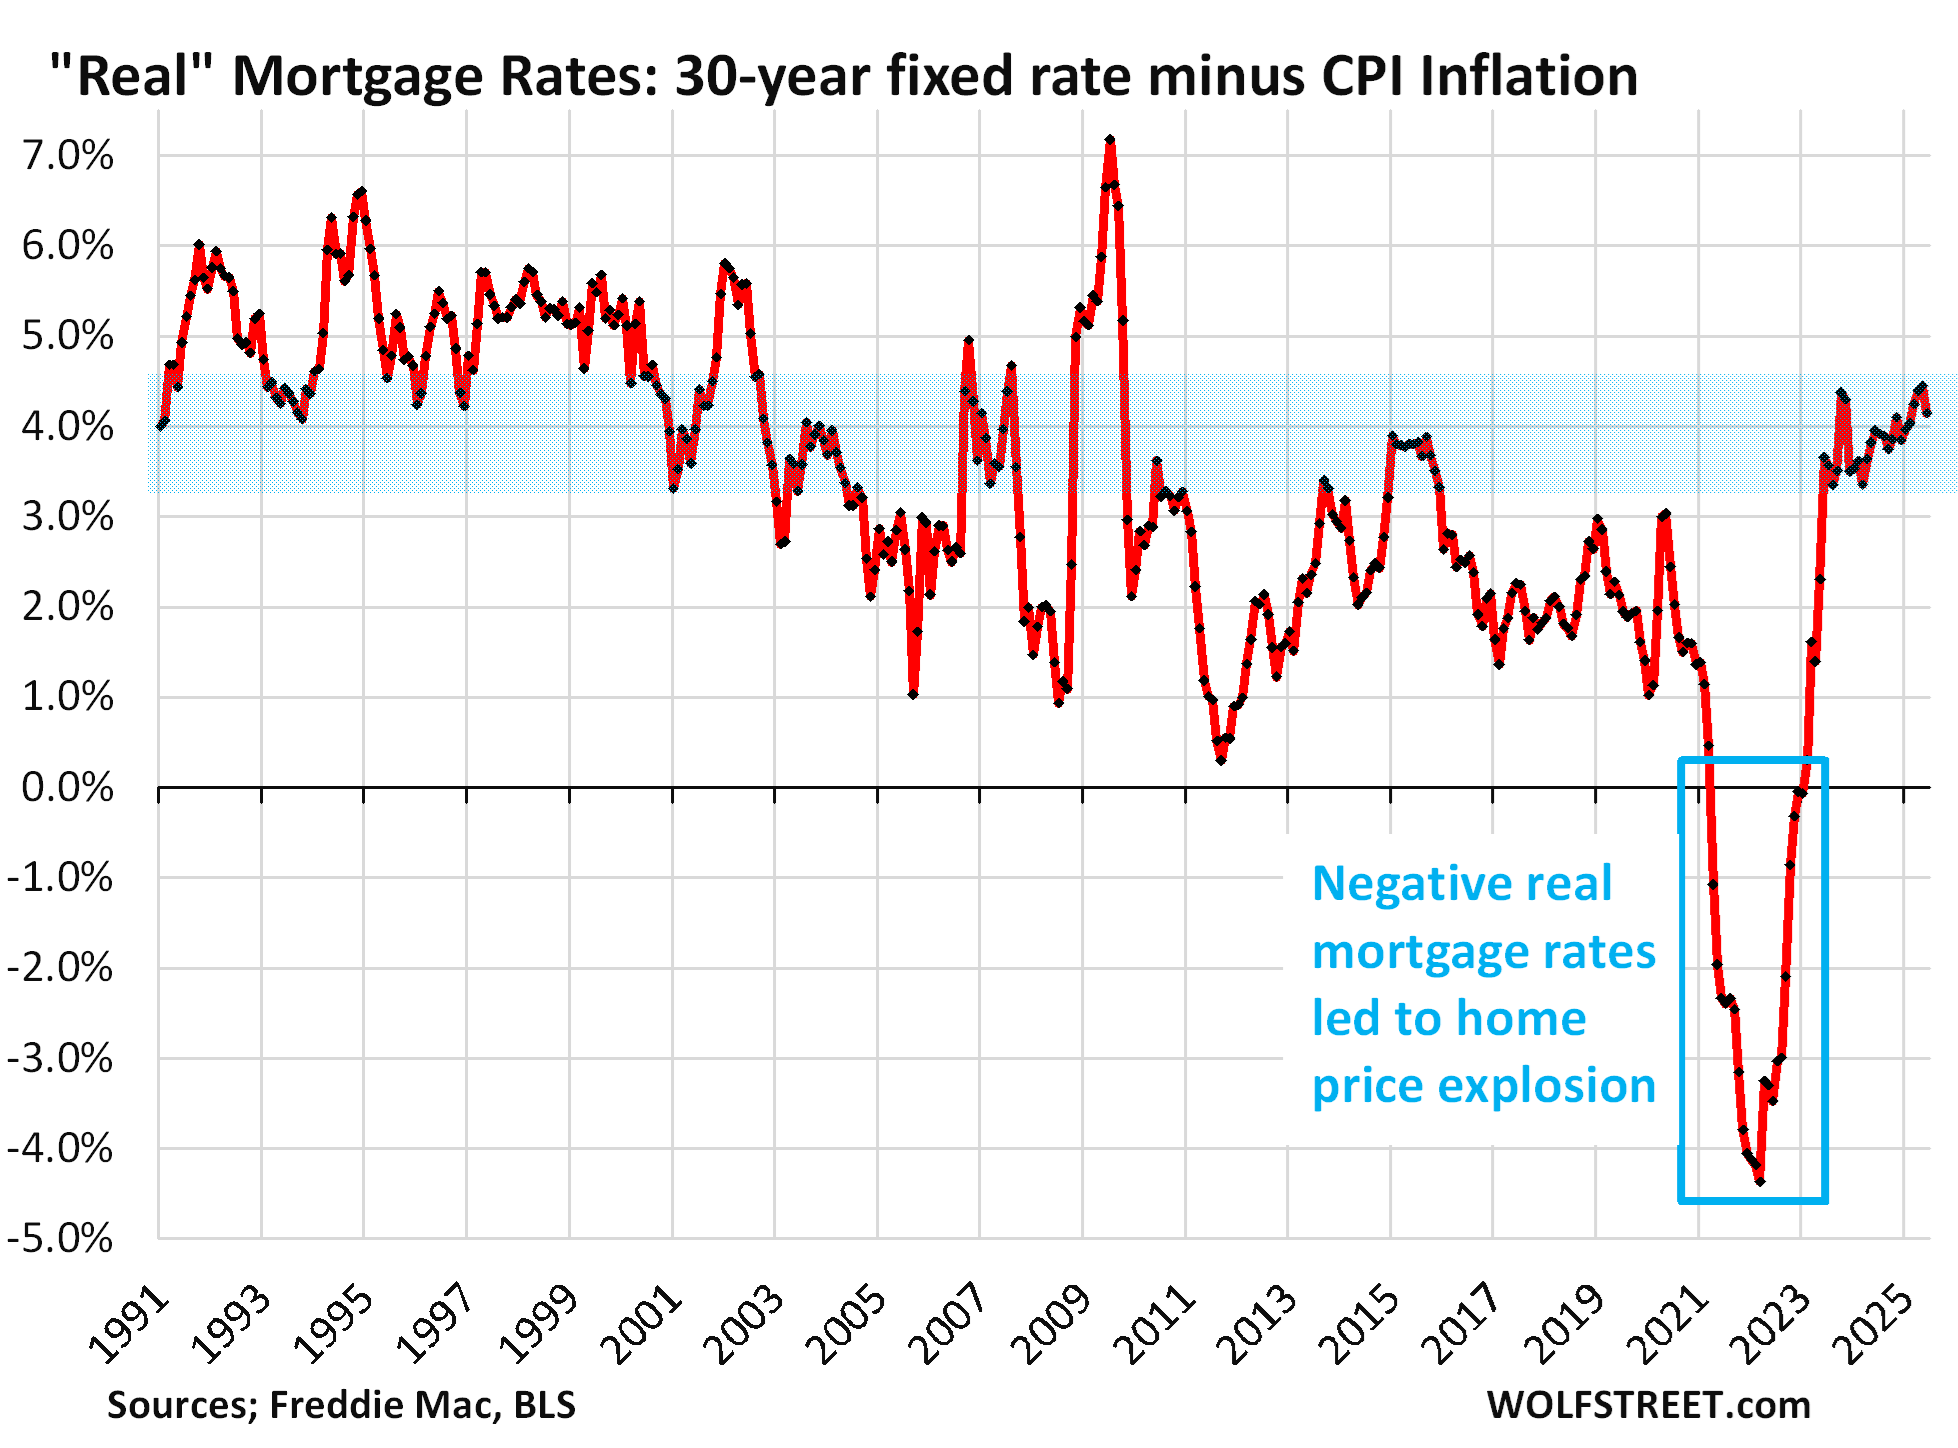
Housing price explosions like these – in Austin, 78% in three years – are indictments of the Fed’s monetary policies whose interest-rate repression via near-0% short-term rates and trillions of dollars of QE to push down long-term rates, flooded the land with liquidity and pushed down mortgage rates far below the rate of inflation (blue box in the chart below).
These negative “real” mortgage rates – mortgage rates minus CPI inflation – were as close to free money as it gets, and when money is free, prices no longer matter, and people pay whatever, and prices explode. And now there’s the hangover from those policies.
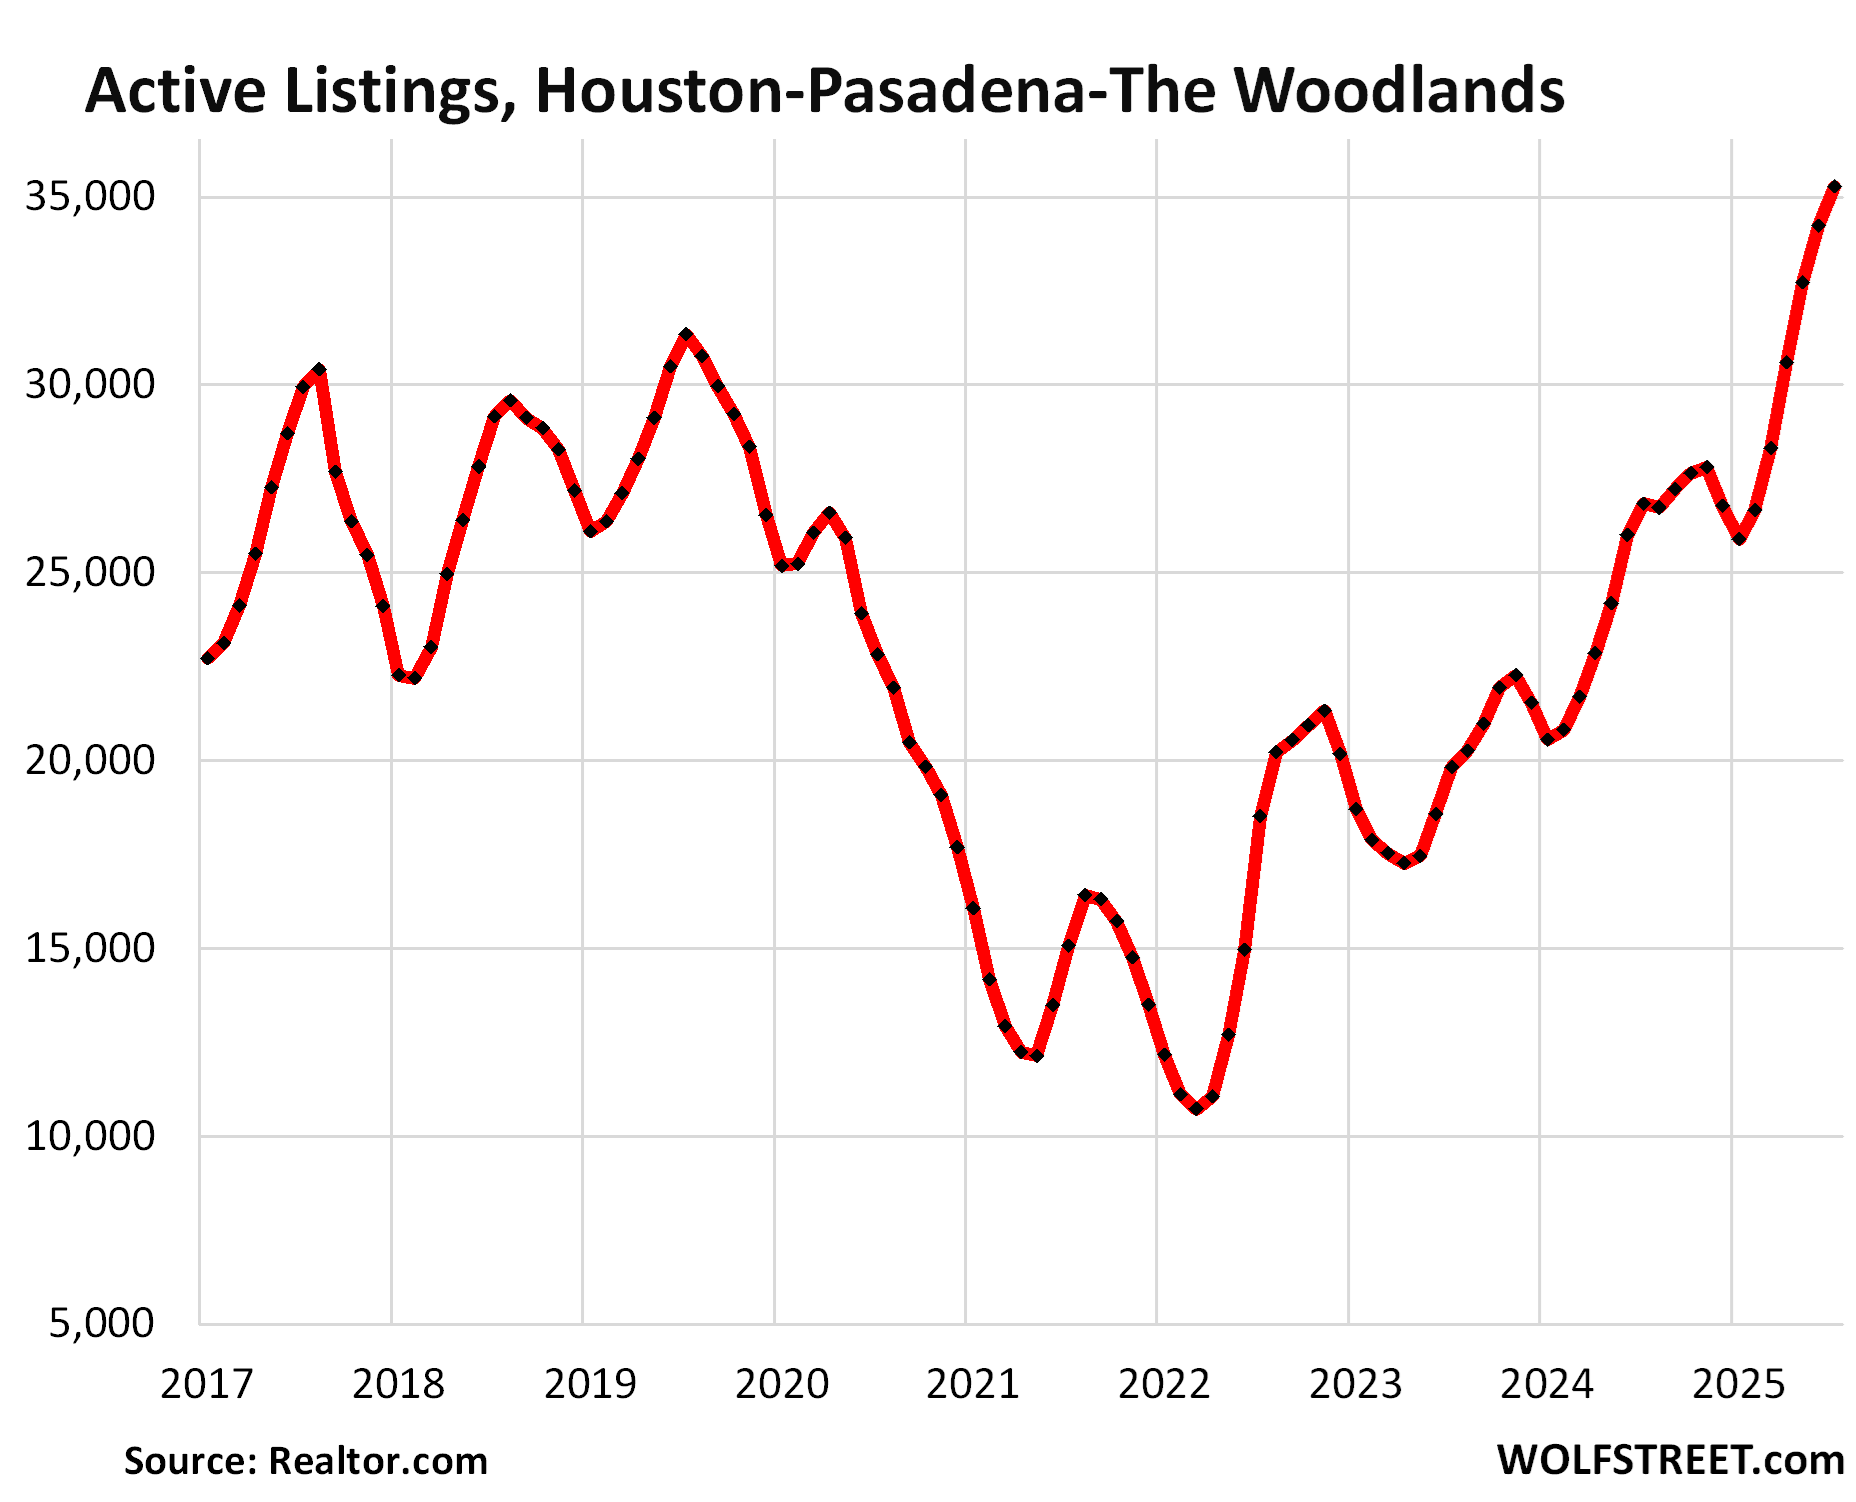
In the Houston-Pasadena-The Woodlands metro, active listings jumped by 31% year-over-year, and by 78% from July 2023, to 35,273 homes, the highest in the decade of data from Realtor.com.
The median number of days on the market before the home got pulled off the market or was sold rose to 50 days, right there with the years 2017-2020 (51 days).
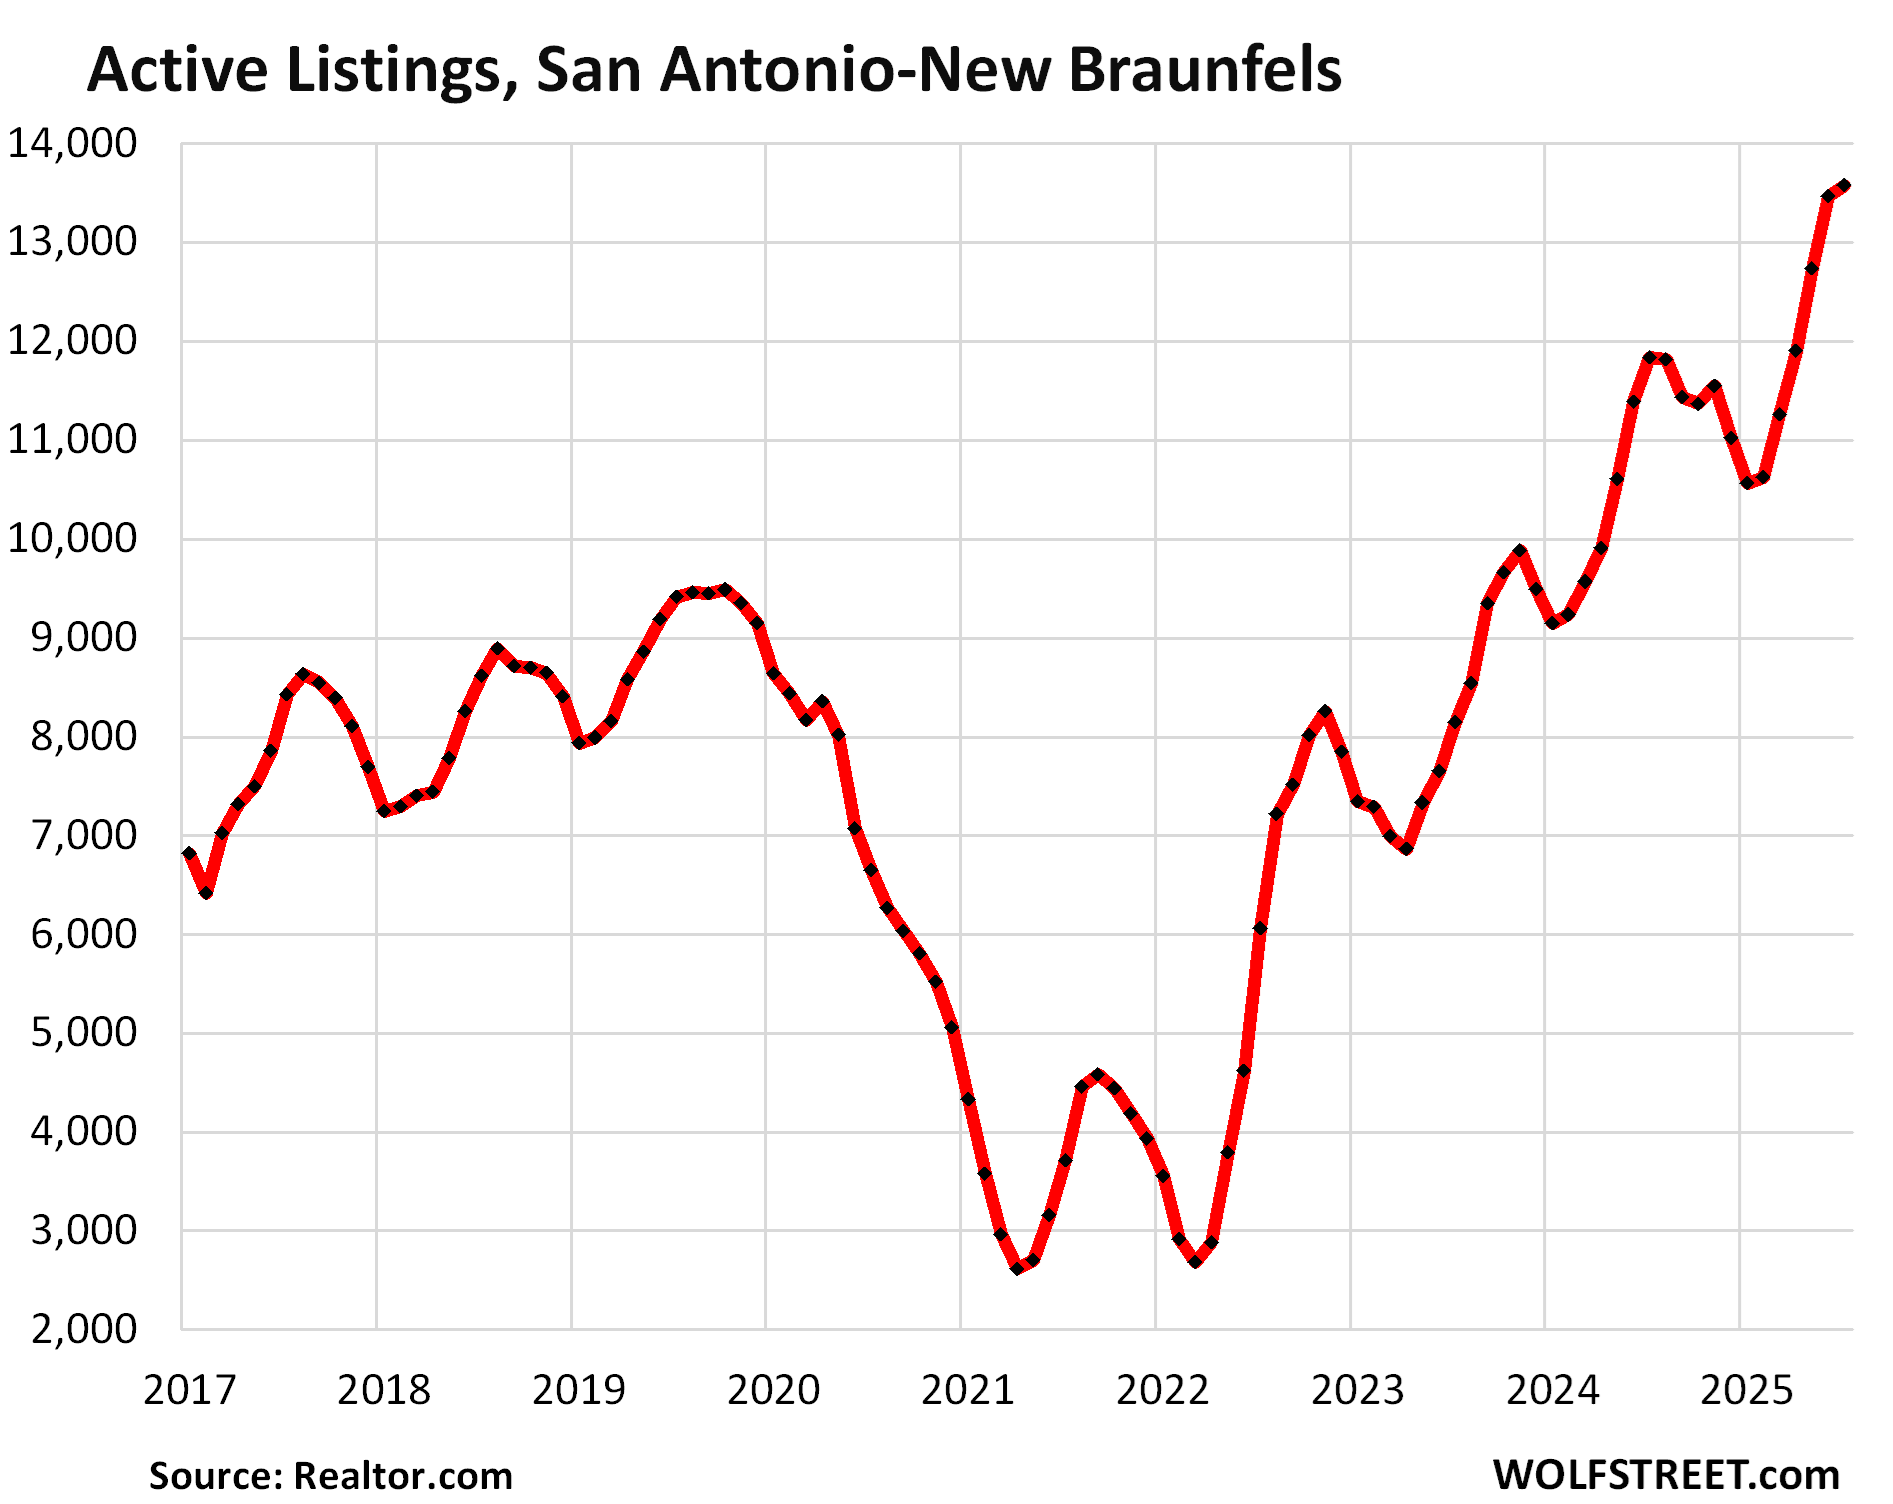
In the San Antonio-New Braunfels metro, active listings jumped by 15% from the already bloated levels a year ago, and by 66% from July 2023, and by 266% from July 2021, to 13,467 homes.
Compared to the Julys of 2017-2019, listings were up by 44% to 61%.
The median number of days on the market jumped to 65 days, the highest for any July in the decade of data. The runner-up was July 2024 at 57 days. In 2017 through 2019, days on the market ranged from 50-53 days.
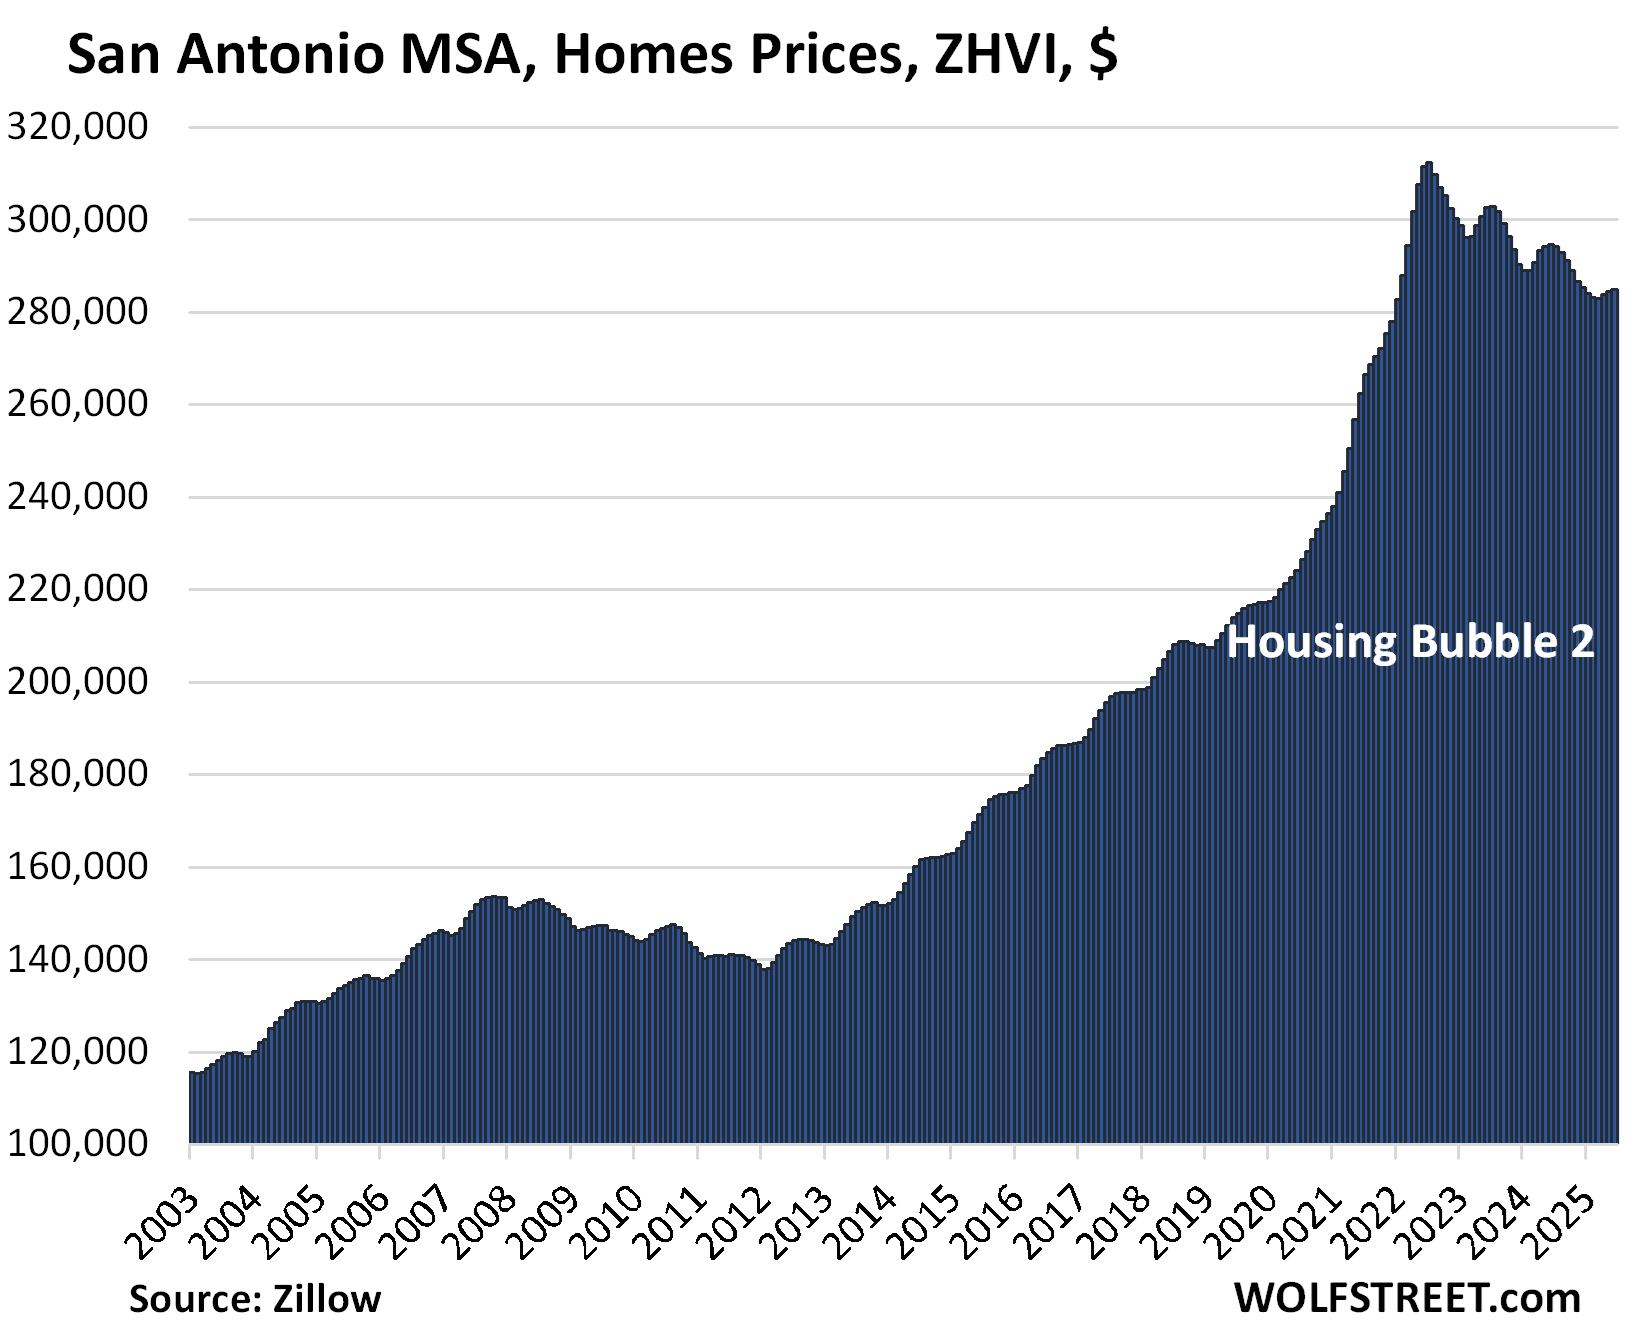
Home prices in the San Antonio metro have declined by 9% from their mid-2022 peak, far behind Austin (-23%), but ahead of Dallas (-7%) and Houston (-3%).
Enjoy reading WOLF STREET and want to support it? You can donate. I appreciate it immensely. Click on the mug to find out how:

![]()
We sold our house fairly quickly in Houston but we priced it to sell at $130 per sq ft. Our competitors, whom we smoked, are still up there at a delusional $150 per sq. ft., plus their homes are ugly. Thank goodness we closed on 7/18/2025, what a relief. We closed on our new home with lots of builder incentives, including a 2.99% mortgage rate, we are thrilled.
Yes, price solves demand and inventory issues. That’s what markets are for – to establish a price at which there is demand. But for some sellers, that’s a really hard concept to grasp.
It sounds like it was your neighbors in fact who were the ones smoking.
I thought all the hype about having hard assets due to increasing money supply was a sure thing? They forgot to mention money supply is always growing, especially during the .com and housing bubble 1.0 and look how those turned out! 😂
Thanks WR for this article.
The prices need to fall 50% or so from its peaks to help common young Americans to be able to afford a shelter.
The inputs to housing have risen meaning housing can’t fall by 50 percent.
That’s a fallacy. Costs are irrelevant to prices. Stuff sells at a loss all the time. During the housing bust, builders sold at a loss all the time.
Worse than that, with the price increases in various other aspects of home ownership like insurance, not to mention higher prices in things like food (thanks Biden).
Home prices need to be no more than $150k for Americans to be able to afford them again.
It’s a long way to the top – and a long fall to the bottom.
It might be interesting to see a paper discussing the percent change in price = f(percent change in number of active listings, percent change in number of days on market). Maybe interact each term with price level. This would give us elasticities, and we could also see if price level makes a difference. A geographic location variable might be important, but maybe not. It could go back as far as data are available, which sounds like about ten years as I recall reading in the article. It would be nice to go back to 2010. Start with annual changes, and if it looks promising, go to deseasonalized monthly changes with varying lags.
Seems like if you geo-arbitraged because everything would be WFH, that may have not been a great bet.
How is it, you report on inventory, just as I stumble across stupid inventory subplots?
Re: Home prices are skidding lower across Texas
Texas is probably very relevant in this inventory build and the overhanging elephant on the affordability cliff — that nagging ongoing narrative, that homes are incredibly overpriced and beyond the means of the vast majority of the global population. Hence, the question of how a bubble pops:
Problem solved: Our politicians have been busy turning this problem around — by creating national legislation to make trailer homes Great Again:
“The proposed “Renewing Opportunity in the American Dream (ROAD) to Housing Act of 2025” aims to address the US housing crisis by increasing supply and improving affordability. The bill includes provisions specifically addressing manufactured homes and their role in increasing housing inventory”
All those people who’ve been outbid on $500,000 homes, or those waiting for existing built homes to reprice — can now fulfill their dreams, by rethinking a lifestyle in a manufactured home.
The obvious holdback on people has been the steel chassis frames, for these units —- but now, I guess, when these things are dropped off at the rental park — the next generation of owners will be chassis-less. That apparently will crash the cost of future units, as steel is super expensive.
I think this additional mix of mobile inventory into the existing home sales inventory will be just what Santa is waiting for!
Probably not the right time to add my manufactured community comment?
Buying a house at 100 times monthly rent has always worked out in the Tampa market, especially as an investment. Excluding water front. They go at a premium.
In 2012-14 some houses sold for less than 100 times rent, and those were the bargains. We are a ways from that now, but it’s inching closer by the month begrudgingly.
I believe we will see 100 times rent again, this go around, but it’s gonna take a while. This doesn’t resolve itself over night. Most owners think they are simply entitled to those sky high prices of yesteryear, when selling. like it’s their right or something. Idk. I see it all around me. Perhaps greed, or stupidity…
With insurance premiums skyrocketing now, most cannot afford much more than 100 times rent mortgage, and that’s what we didn’t see until recently.
I used to live in the Hancock Park area of Austin. Went to Lee Elementary, lived on Texas Ave. My Dad being a rather poor AF newbie Captain, we couldn’t get officer housing at Bergstrom so settled for rentals in the $50-$75 range off base. Now the Texas Ave. area is still pretty darn hot compared to last year and as always, it comes down to location, location, location. Those $50 rentals are long gone. The house we lived in is probably $8-900k now. I checked sales for the last 6 months and things are selling at what I consider ridiculous prices. Taxes are through the roof! If it has slowed, it’s hard to see in the numbers I’m seeing.
Could you give us the home price charts for Dallas and Houston?
https://wolfstreet.com/2025/07/16/the-most-splendid-housing-bubbles-in-america-june-2025-the-price-drops-gains-in-33-large-expensive-metros/
This is through June. The July update will come next weekend.
“They” will continue to says there’s a housing crisis. Same everywhere. The narrative’s die is cast for awhile, facts be damned.
Texas has very high property taxes which are around 2.5% of house value which is around double that of California. Moreover, there are not many nice areas to live in Texas except a few in Dallas and Houston. An old college friend of mine inherited his grandparent’s house built back in the 1920s when they were founders of River Oaks on River Oaks Drive a few houses down from the entrance to River Oaks Country Club in the early 2000s and watched its assessed valuation skyrocket every year until it reached around $7 million and property taxes got jacked up to more than $160,000 at which time he decided to put the house up for sale back in 2011. Imagine what those numbers are now.