The long-defaulted federal student loans come out of the shadows of government forbearance.
By Wolf Richter for WOLF STREET.
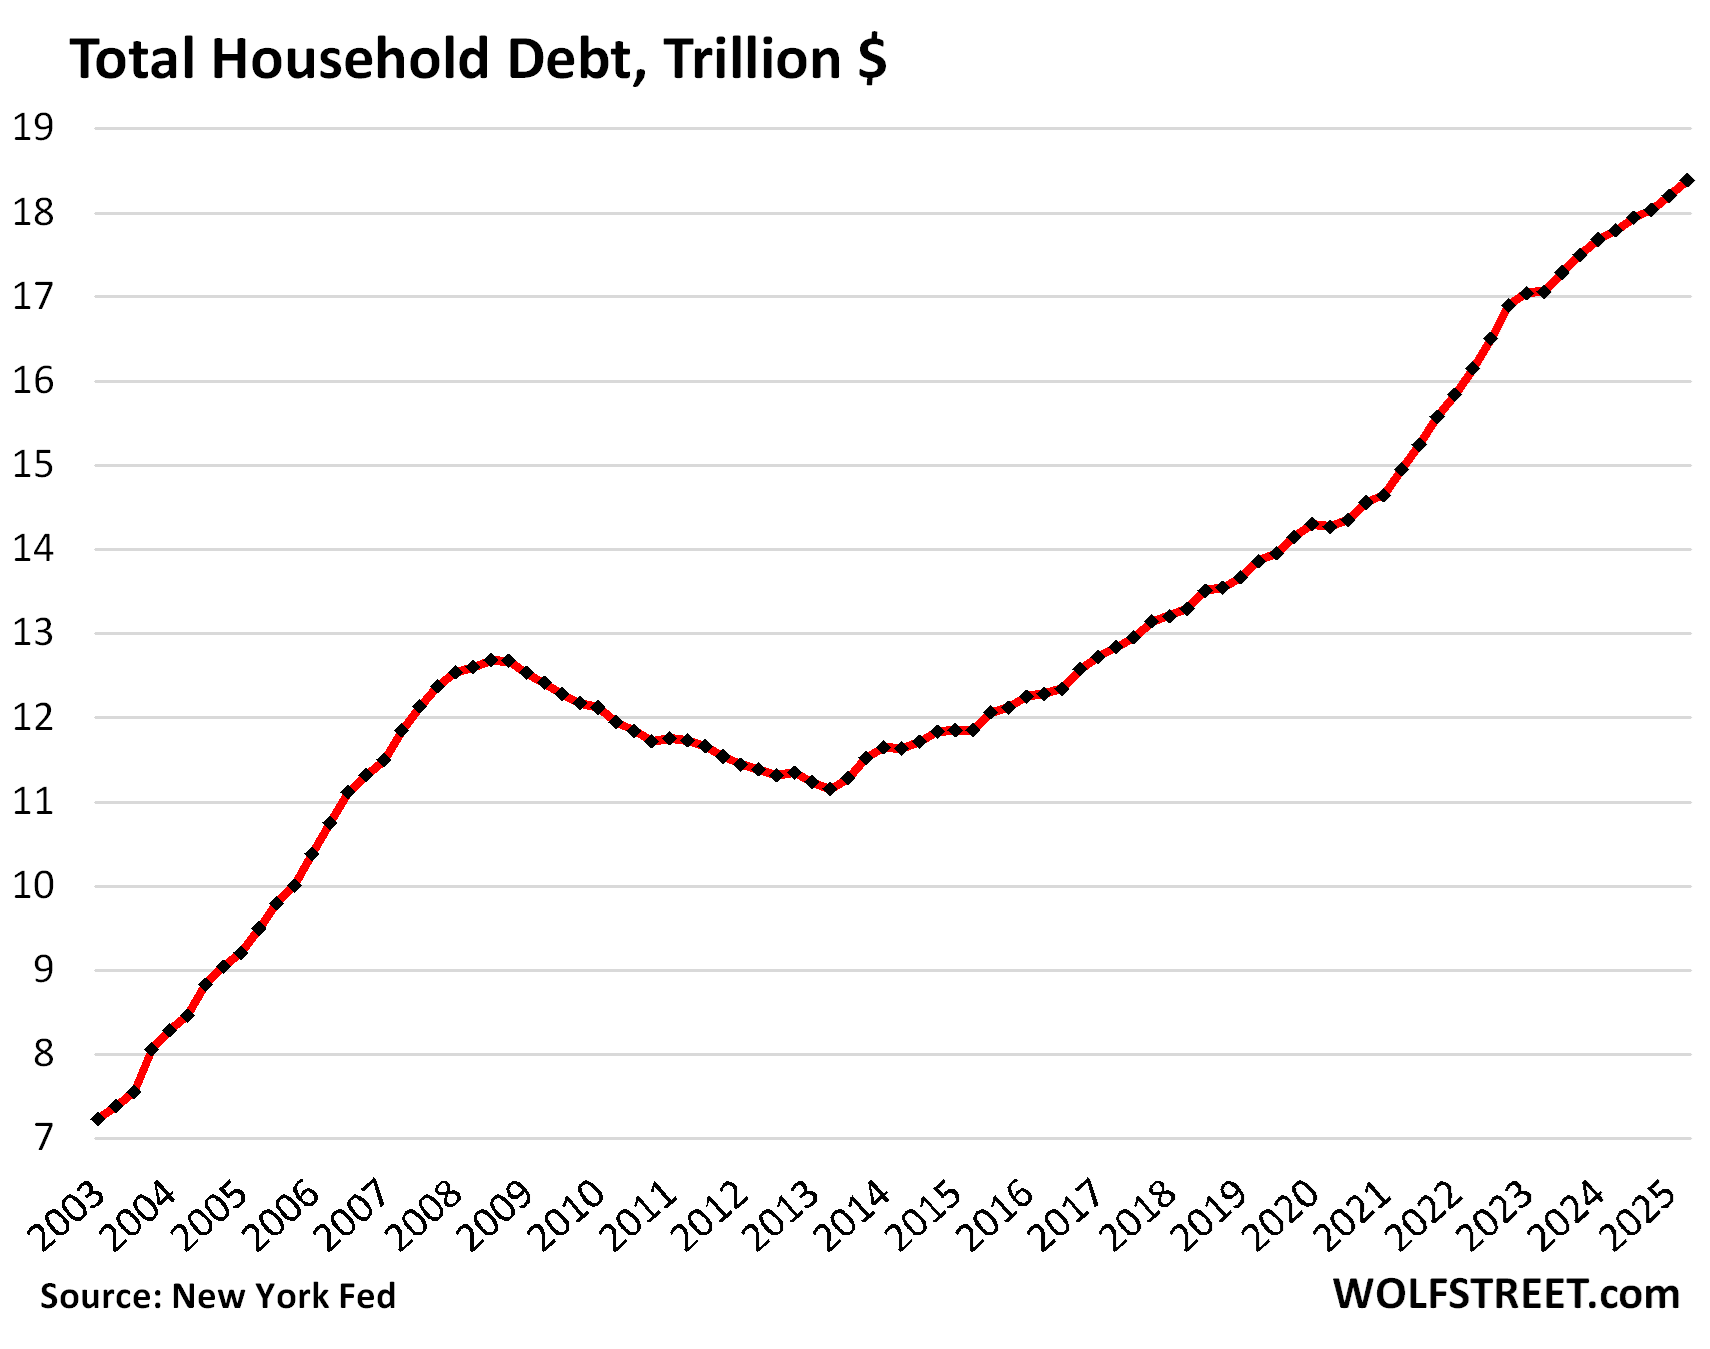
Total household debt outstanding rose by $185 billion in Q2 from Q1, or by 1.0%, to $18.4 trillion, according to the Household Debt and Credit Report from the New York Fed today.
Year-over-year, total household debt grew by $592 billion, or by 3.3%, the third-smallest growth rate since Q1 2021, behind only Q1 2025 (+2.9%) and Q4 2024 (+3.0%).
And this debt was carried by more workers earning records amount of money, and the overall burden of their debts in terms of their disposable income (the debt-to-income ratio) declined even further; more in a moment.
Balances increased quarter over quarter in the categories of auto loans, credit cards, student loans, mortgages, and HELOCs, but dipped for the second consecutive quarter in “other” revolving credit (personal loans, BNPL loans, etc.). We’ll get into the details of housing debt, auto loans, and credit cards each in a separate article over the next few days. Today, we’ll look at the overall debt, its burden, delinquencies, collections, foreclosures, and bankruptcies.
In terms of delinquencies, the standout is that student loans became loans again this year, and those loans that have been delinquent since 2020, but covered by the government’s forbearance programs, started counting as delinquent again this year, and the results are sort of funny. The move this year is so massive that it jacked up overall delinquency rates.
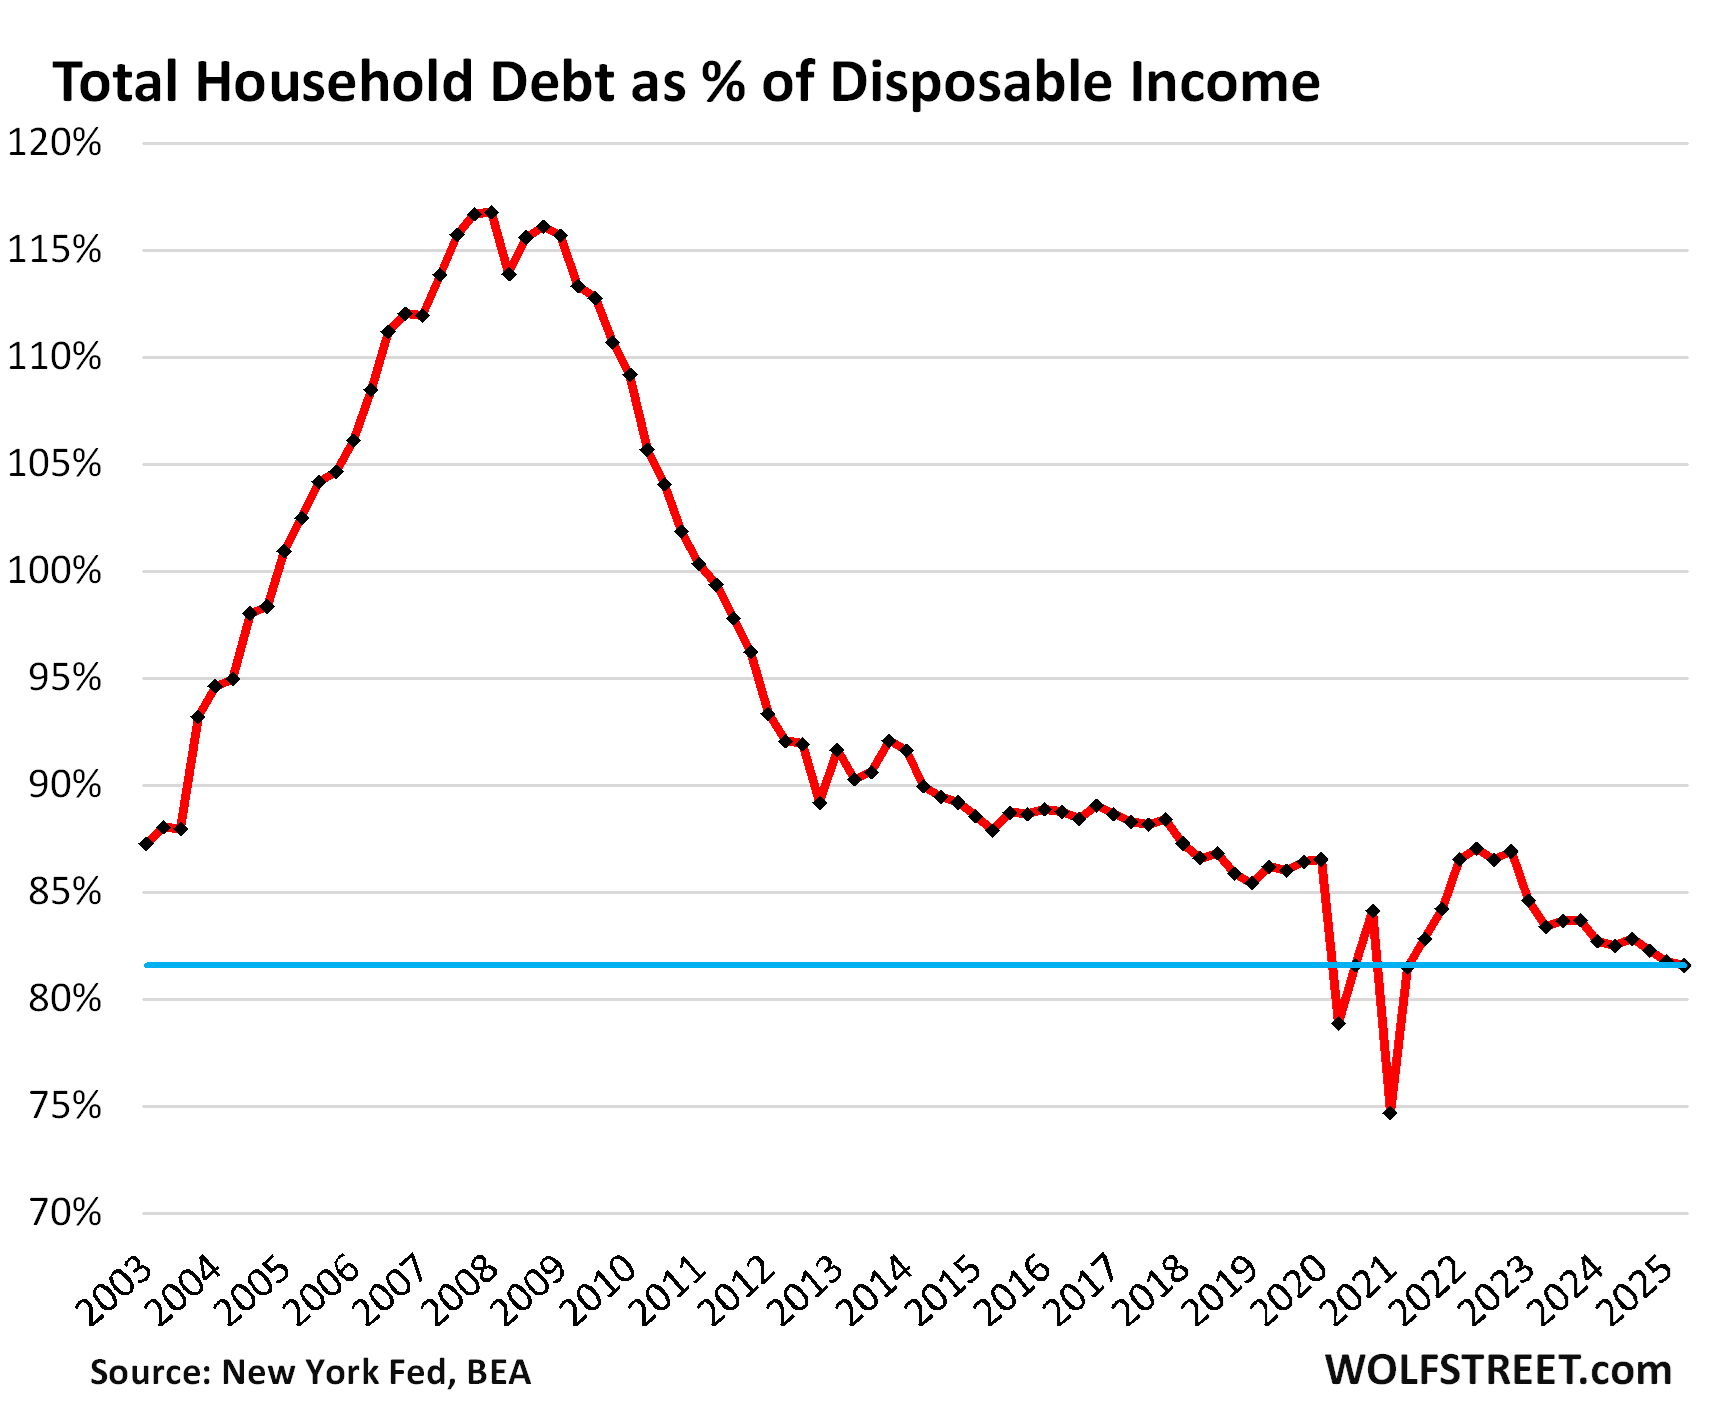
The burden of household debt: Debt-to-income ratio.
A common way of evaluating the burden of a debt is to look at the debt-to-income ratio. With household debt, we look at the ratio to disposable income, which accounts for more workers and higher incomes.
Disposable income, released by the Bureau of Economic Analysis, is household income from all sources except capital gains, minus payroll taxes: So income from after-tax wages, plus income from interest, dividends, rentals, farm income, small business income, transfer payments from the government, etc. Disposable income is essentially what consumers have available to spend and service their debts.
Disposable income rose faster than debt in Q2:
- QoQ: disposable income +1.2%, total debts +1.0%.
- YoY: disposable income +4.5%, total debts +3.3%.
The debt-to-income ratio thereby declined to 81.6% in Q2, the lowest ratio in the data going back to 2003, except for two quarters during the free-money-stimulus era (Q1 2021 and Q2 2020) that had inflated disposable income into absurdity.
So seen as a monolithic entity, the American Consumer is in good shape, the balance sheet is in good shape, 65% own their own homes, over 60% hold equities, they have $4.6 trillion in money market funds that still pay around 4% in interest, they have $1.1 trillion in small CDs, and $2.4 trillion in CDs of over $100,000 that all generate income. That’s a pile of cash they’re sitting on.
It seems our Drunken Sailors, as we lovingly and facetiously call consumers, learned a lesson and became a sober bunch, most of them. But not all of them.
Subprime-rated borrowers – a small subset of consumers – are always in trouble with high debt-to-income ratios and missed payments in their credit history, which is why this segment is called “subprime.” But it’s not a fixed part of the population; people fall into subprime credit scores and climb out of them all the time, it’s a constant flow. And subprime doesn’t mean “poor” or “low income,” it means bad credit; the young dentist that goes in over his head is a classic example. Low-income people rarely can borrow enough, if at all; it’s the higher income people that can borrow a lot that can get into deep trouble.
The heavily indebted economic entity to worry about is not the consumer but the federal government with its ballooning mountain of debt and reckless deficits. The other entities to worry about are overleveraged businesses, often funded by private equity and/or private credit.
Delinquent student loans face reality again.
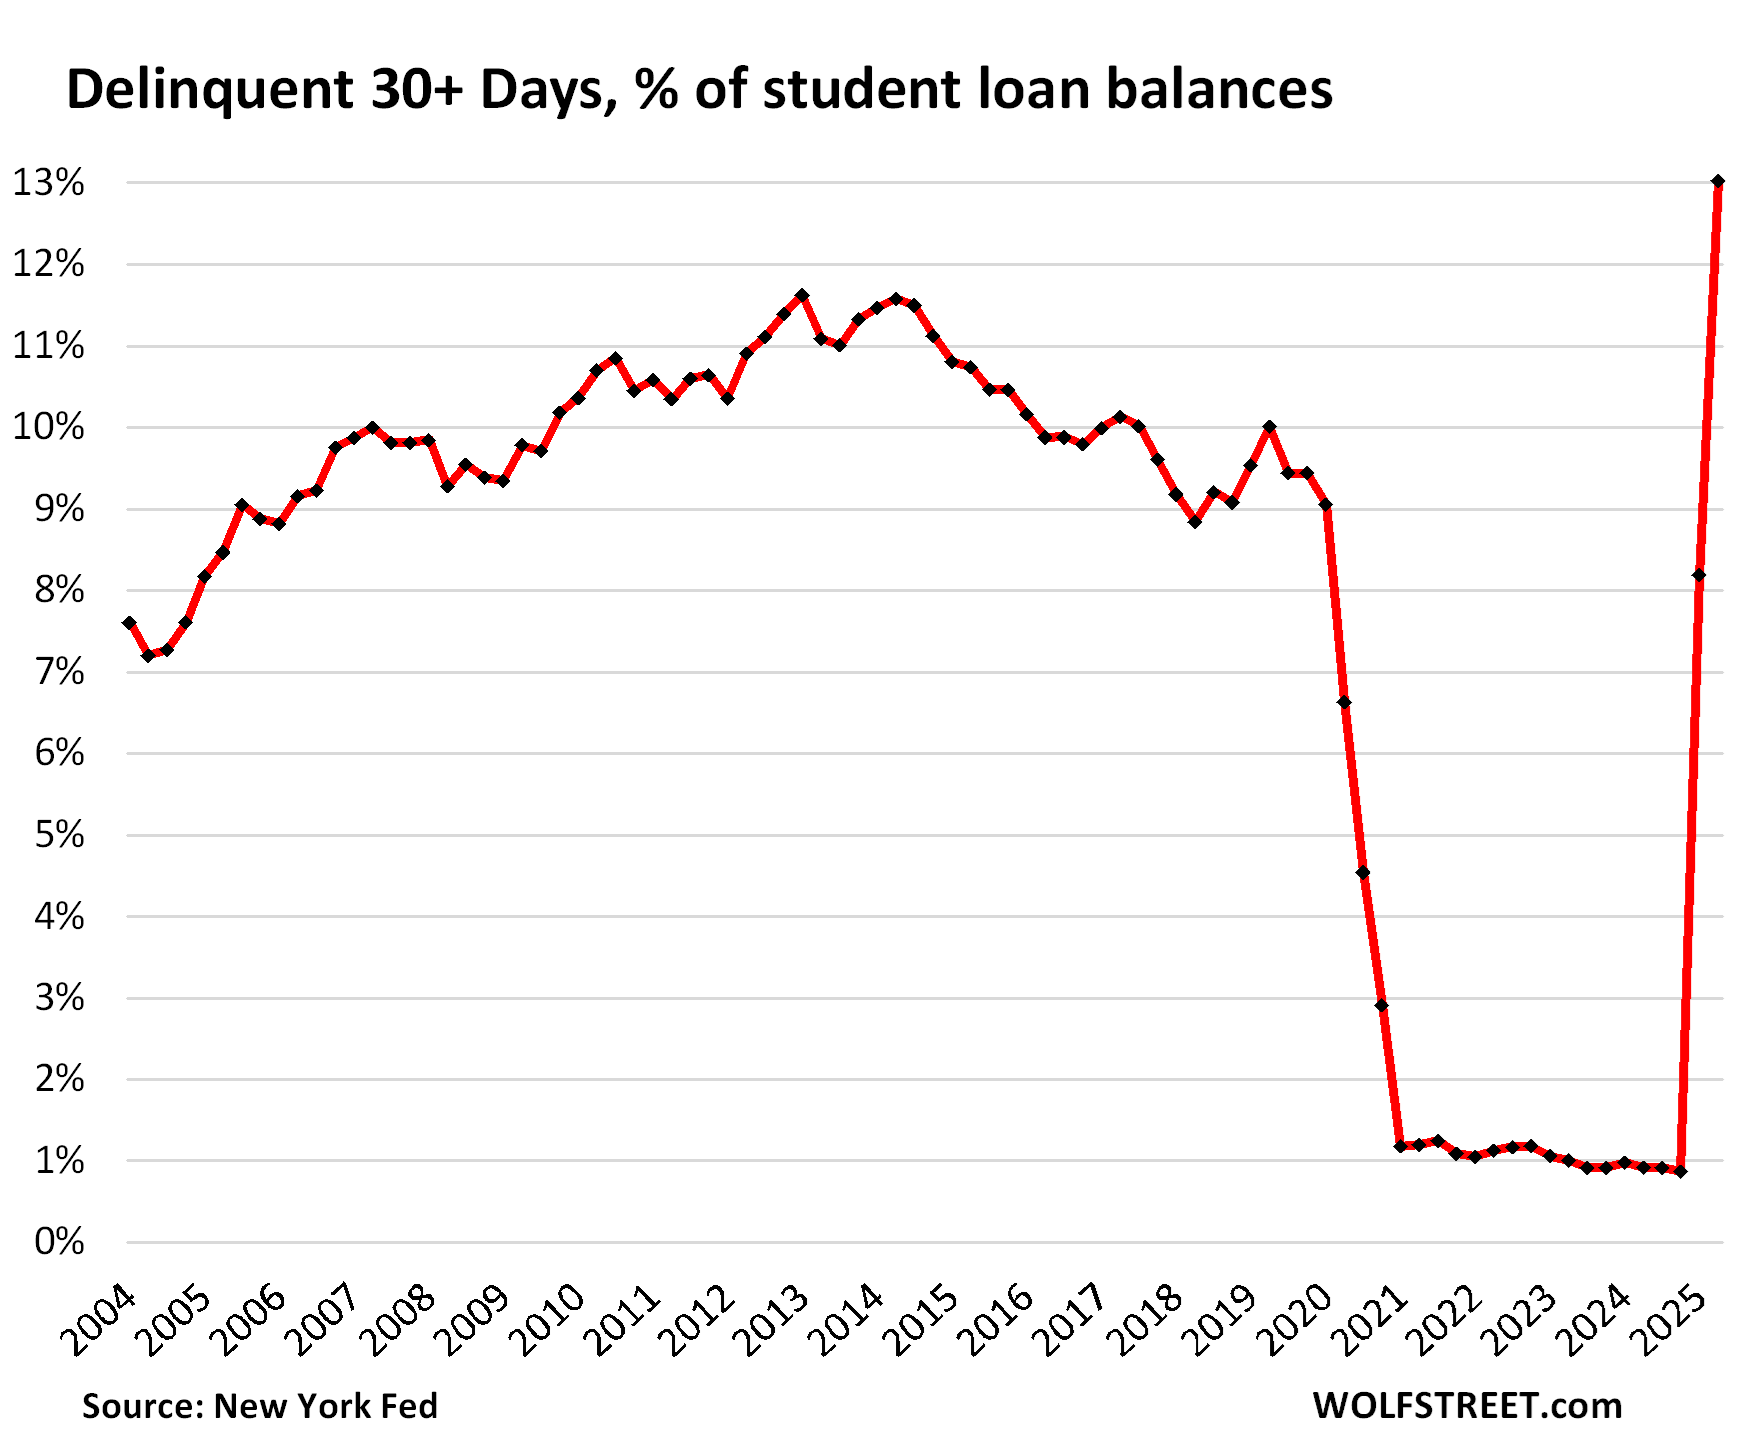
In 2025, federal student loans that had been covered by blanket forbearance since 2020 while waiting for forgiveness, face the reality again that a loan is a debt that needs to be serviced, and if it isn’t serviced as agreed, it becomes delinquent. And these delinquent federal student loans, after having been absent from credit reports since 2020, are back in them, and with a vengeance.
The 30-day delinquency rate spiked to 13.0% in Q2, the worst ever, up from 8.2% in Q1 and from 0.9% in Q4, according to the NY Fed’s report today, based on Equifax data.
Roughly $213 billion (13.0%) of the $1.64 trillion in student loans outstanding were 30-plus days delinquent in Q2.
The spike was driven entirely by moving these delinquent loans out of the shadows back into reality and into credit reports.
The 90-plus day delinquency rate for student loans spiked to 10.2%
There is suddenly an old reality out there: Delinquent loans mess up credit scores, limit the ability to borrow, and increase the interest rate borrowers have to pay when they do borrow. That should have been taught in college.
Student loans whack the overall delinquency rate. That $213 billion in delinquent student loans in Q2 caused the overall delinquency rate of 30-plus days in Q2 to shoot to 5.3%.
In Q4 2024, before these delinquent student loans were counted, the overall delinquency rate was 4.1%, well below any period before the pandemic.
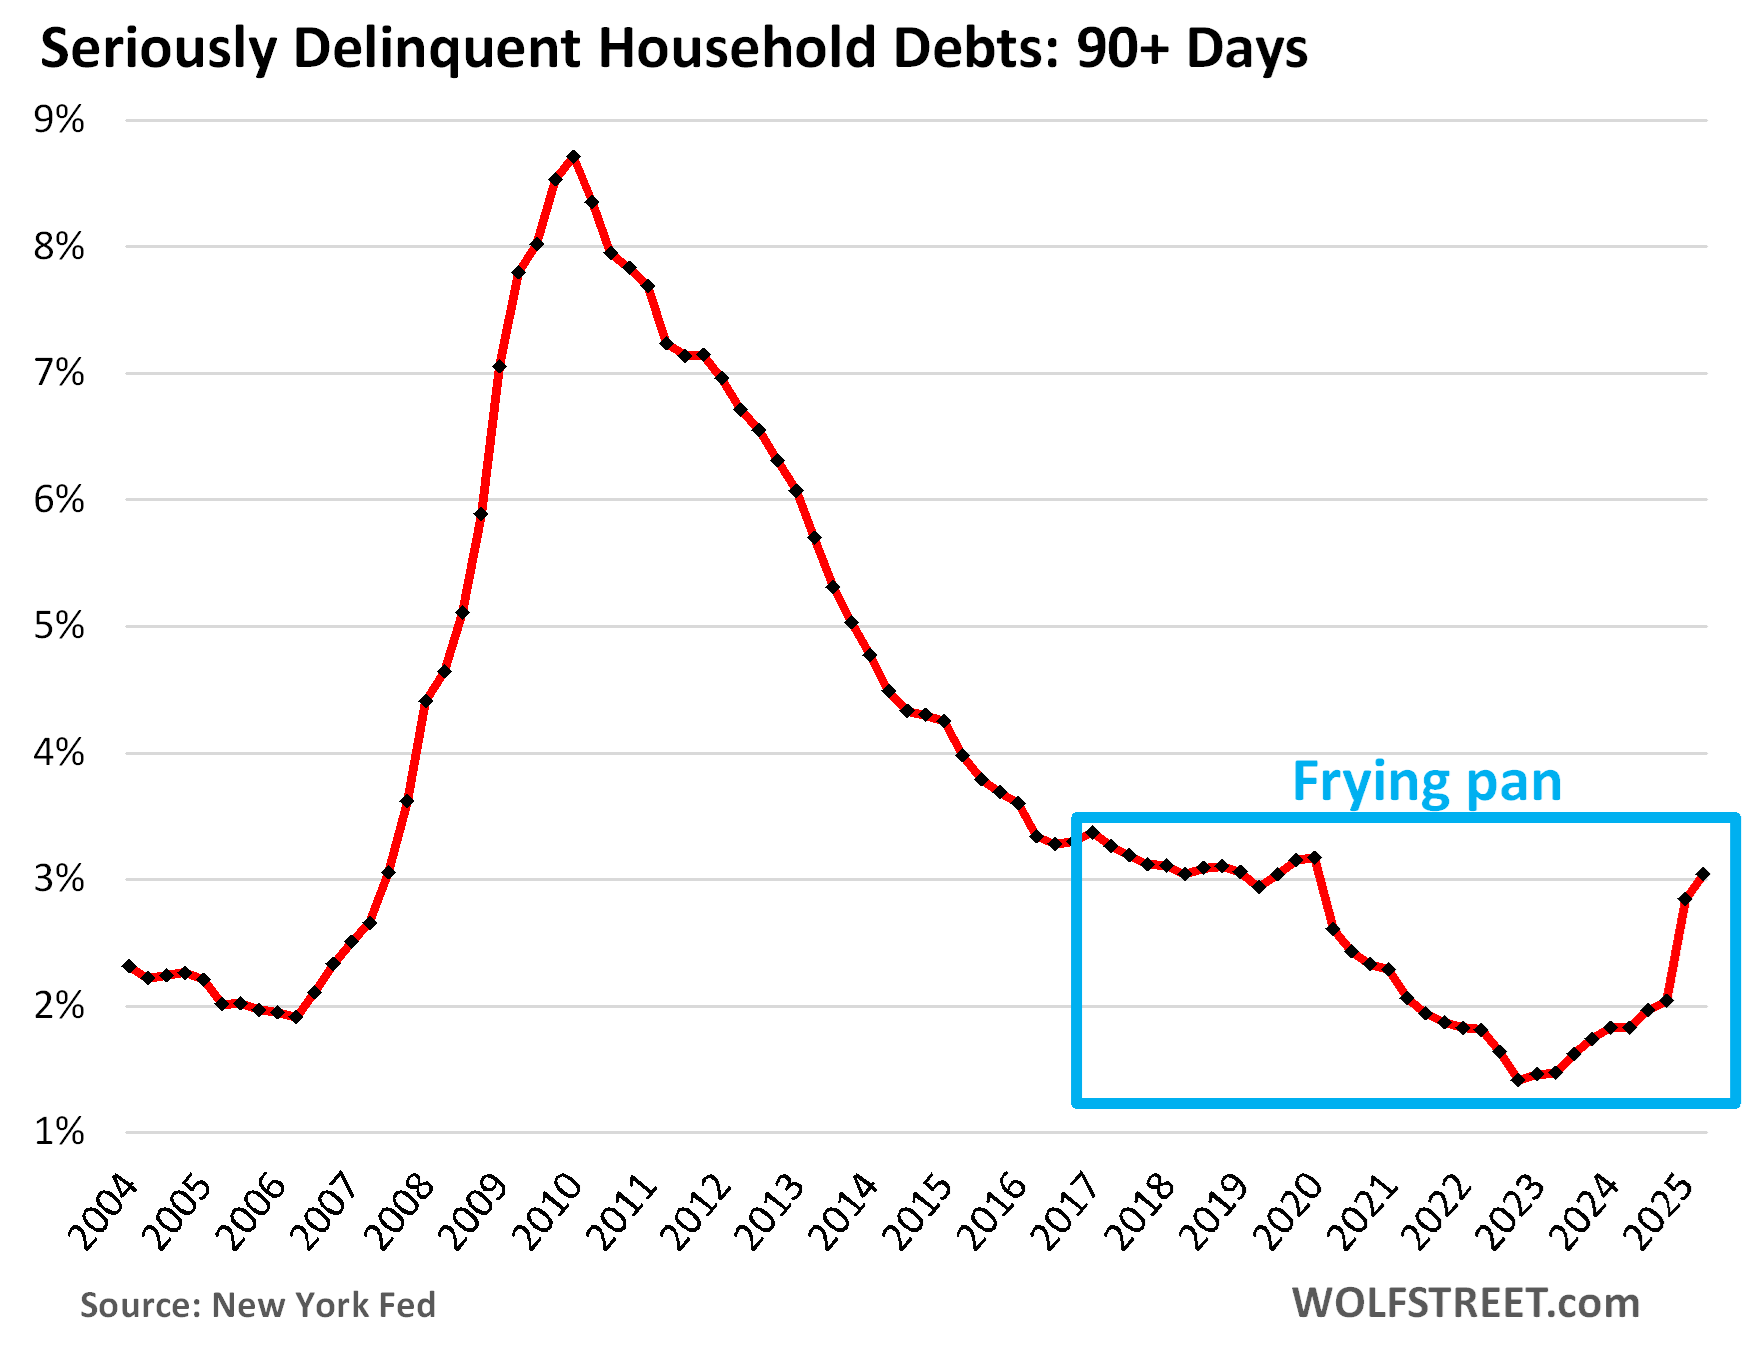
The 90-plus day delinquency rate – the rate of “serious” delinquencies – rose to 3.0%, pushed up by the 90-day student loan delinquency rate of 10.2%.
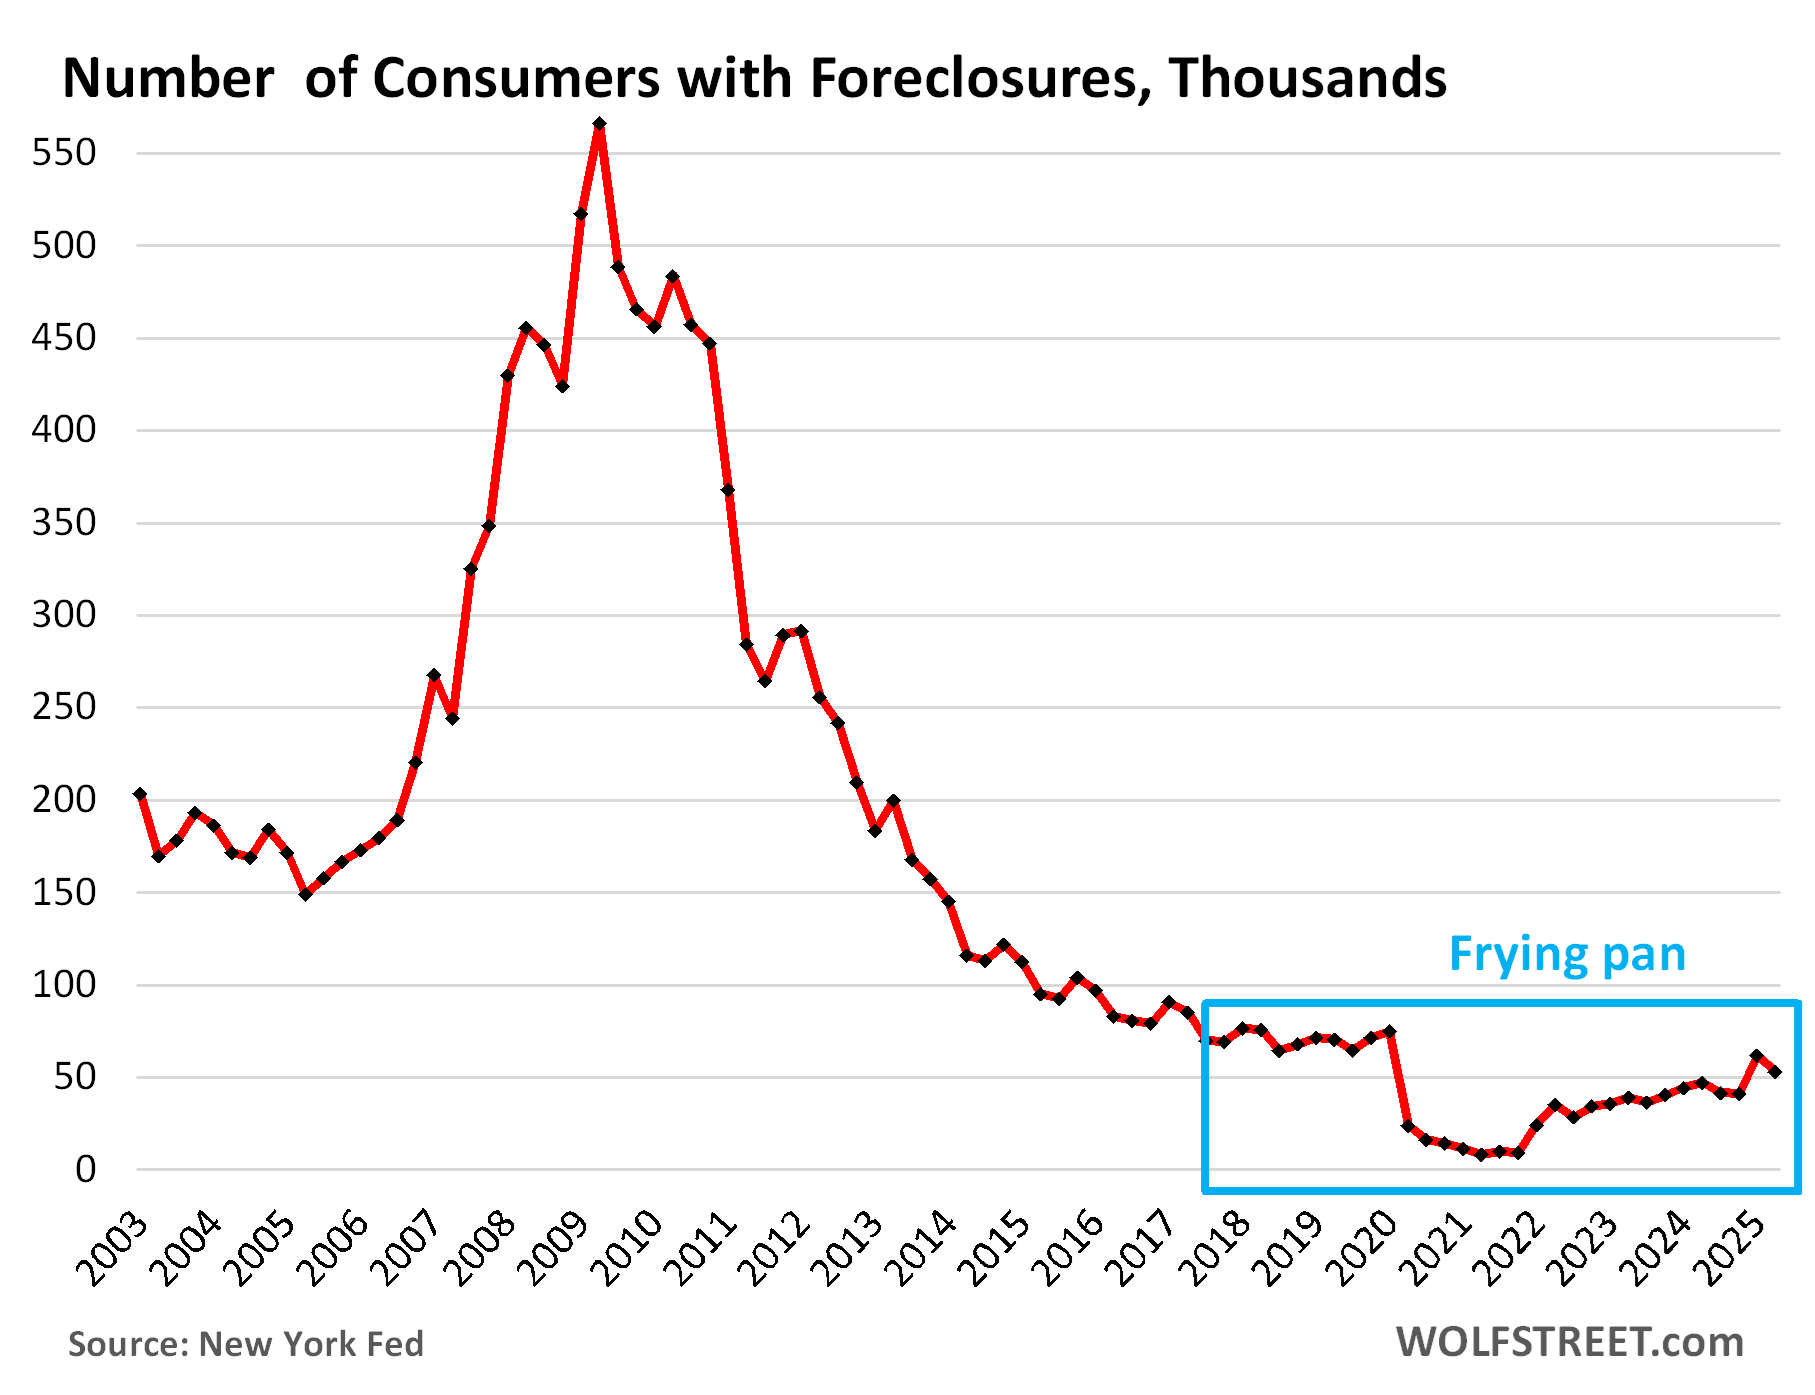
The infamous “frying pan pattern” – a WOLF STREET technical term – has formed, where the panhandle represents the prepandemic level, the pan represents the free-money level, and the other edge of the pan represents the post-free-money return to prepandemic levels:
Foreclosures declined and are low. The number of consumers with foreclosures in Q2 dipped to 52,800, and remained below the range of the Good Times in 2018-2019 between 65,000 and 90,000.
During the Free-Money and mortgage-forbearance era, during which foreclosures were essentially impossible, the number of foreclosures fell to near zero.
What is keeping foreclosures low is that home prices exploded during the Free-Money era, so most struggling homeowners can sell their home for more than they owe on it, pay off the mortgage with the proceeds from the sale, and walk away with some cash, and their credit intact.
But in markets where home prices have dropped more significantly, this option is starting to slip away from buyers who’d bought near the peak.
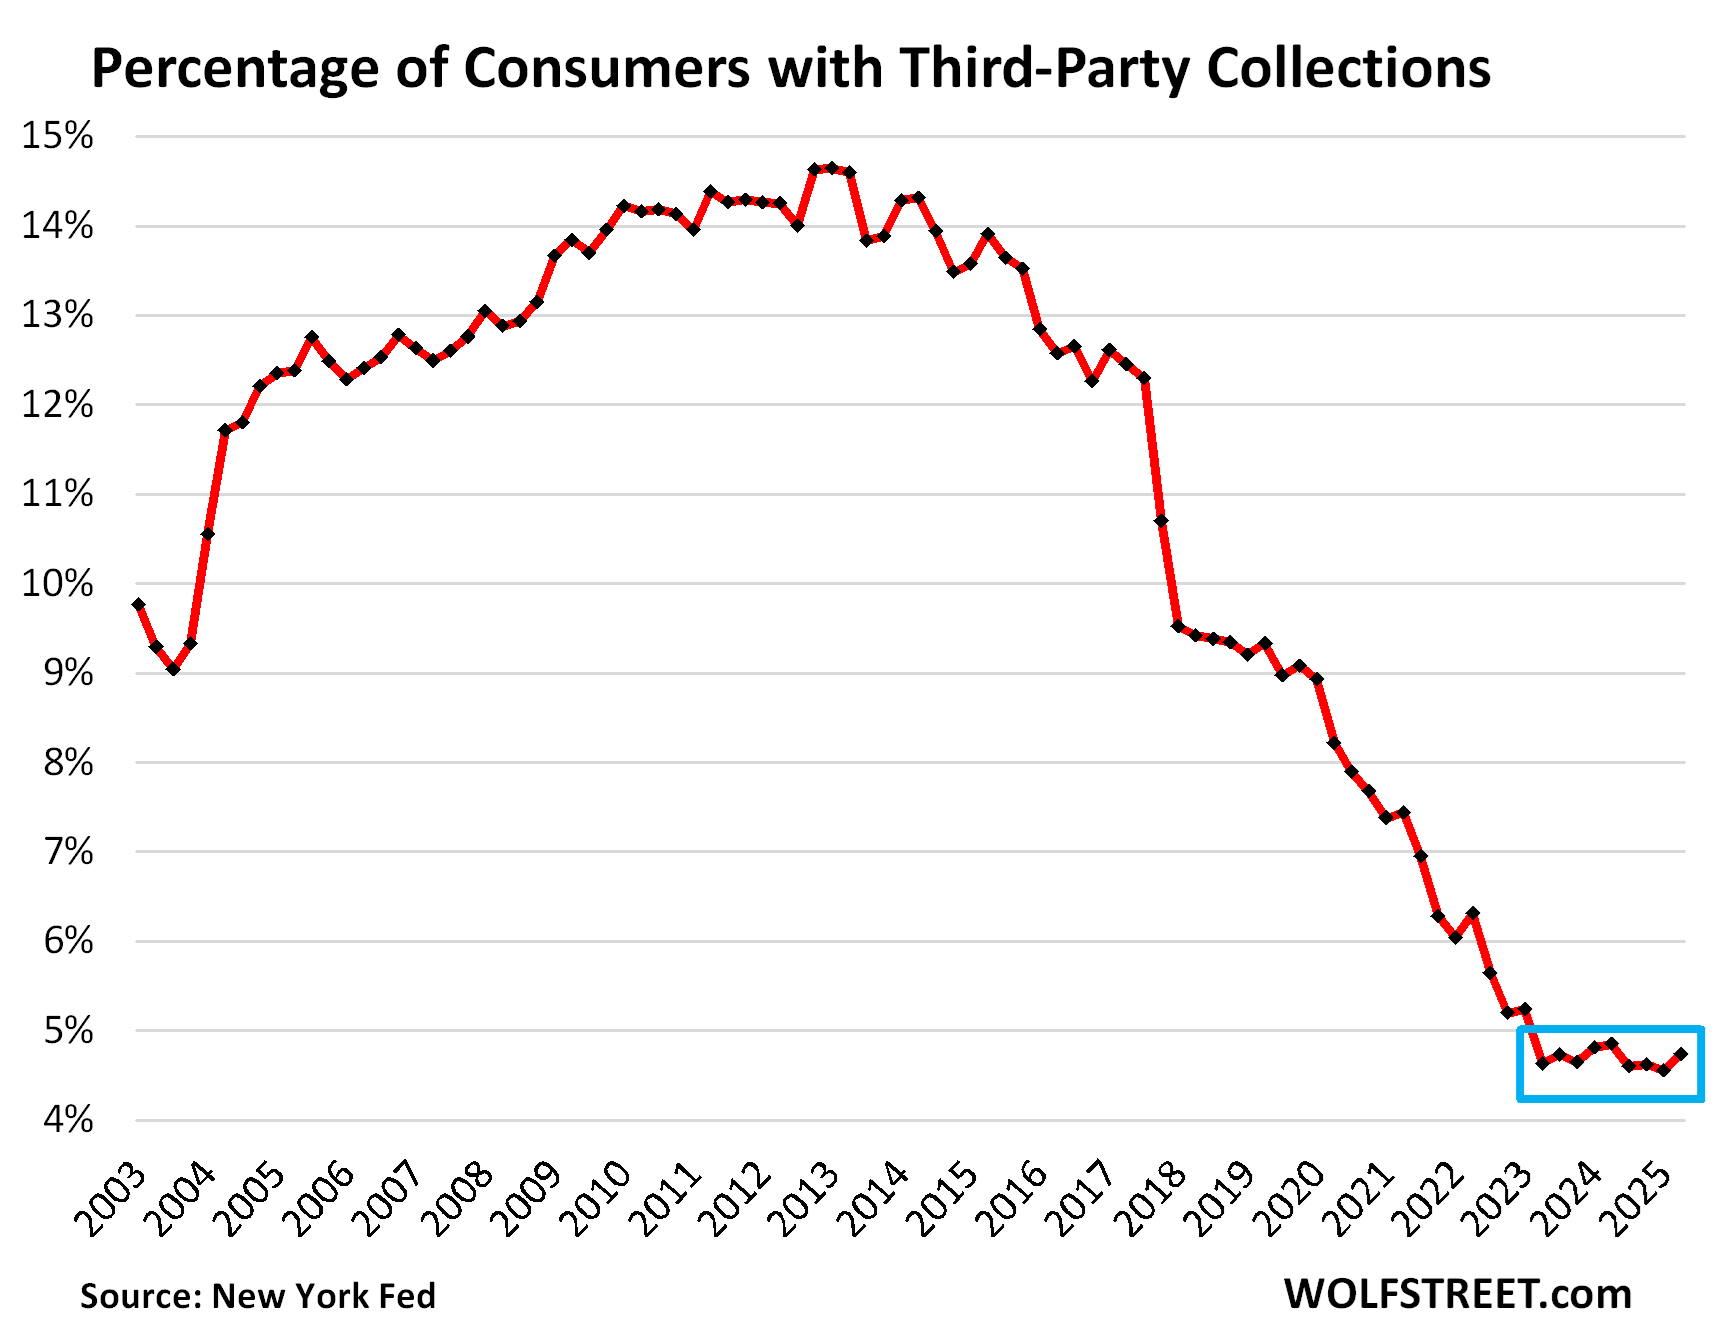
Third-party collections at rock bottom. A third-party collection entry is made into a consumer’s credit history when the lender reports to the credit bureaus, such as Equifax, that it sold the delinquent loan, such as credit card debt, to a collection agency for cents on the dollar. The New York Fed obtained this data on third-party collections in anonymized form through its partnership with Equifax.
The percentage of consumers with third-party collections skidded from record low to record low during the Free Money era and has hobbled along near those record lows even after the free money vanished, and in Q2 was 4.7%.
But, but, but… there is some discussion to turn defaulted federal student loans over to collection agencies – and if that ever happens, it will cause the percentage of consumers with collection entries in their credit records to spike.
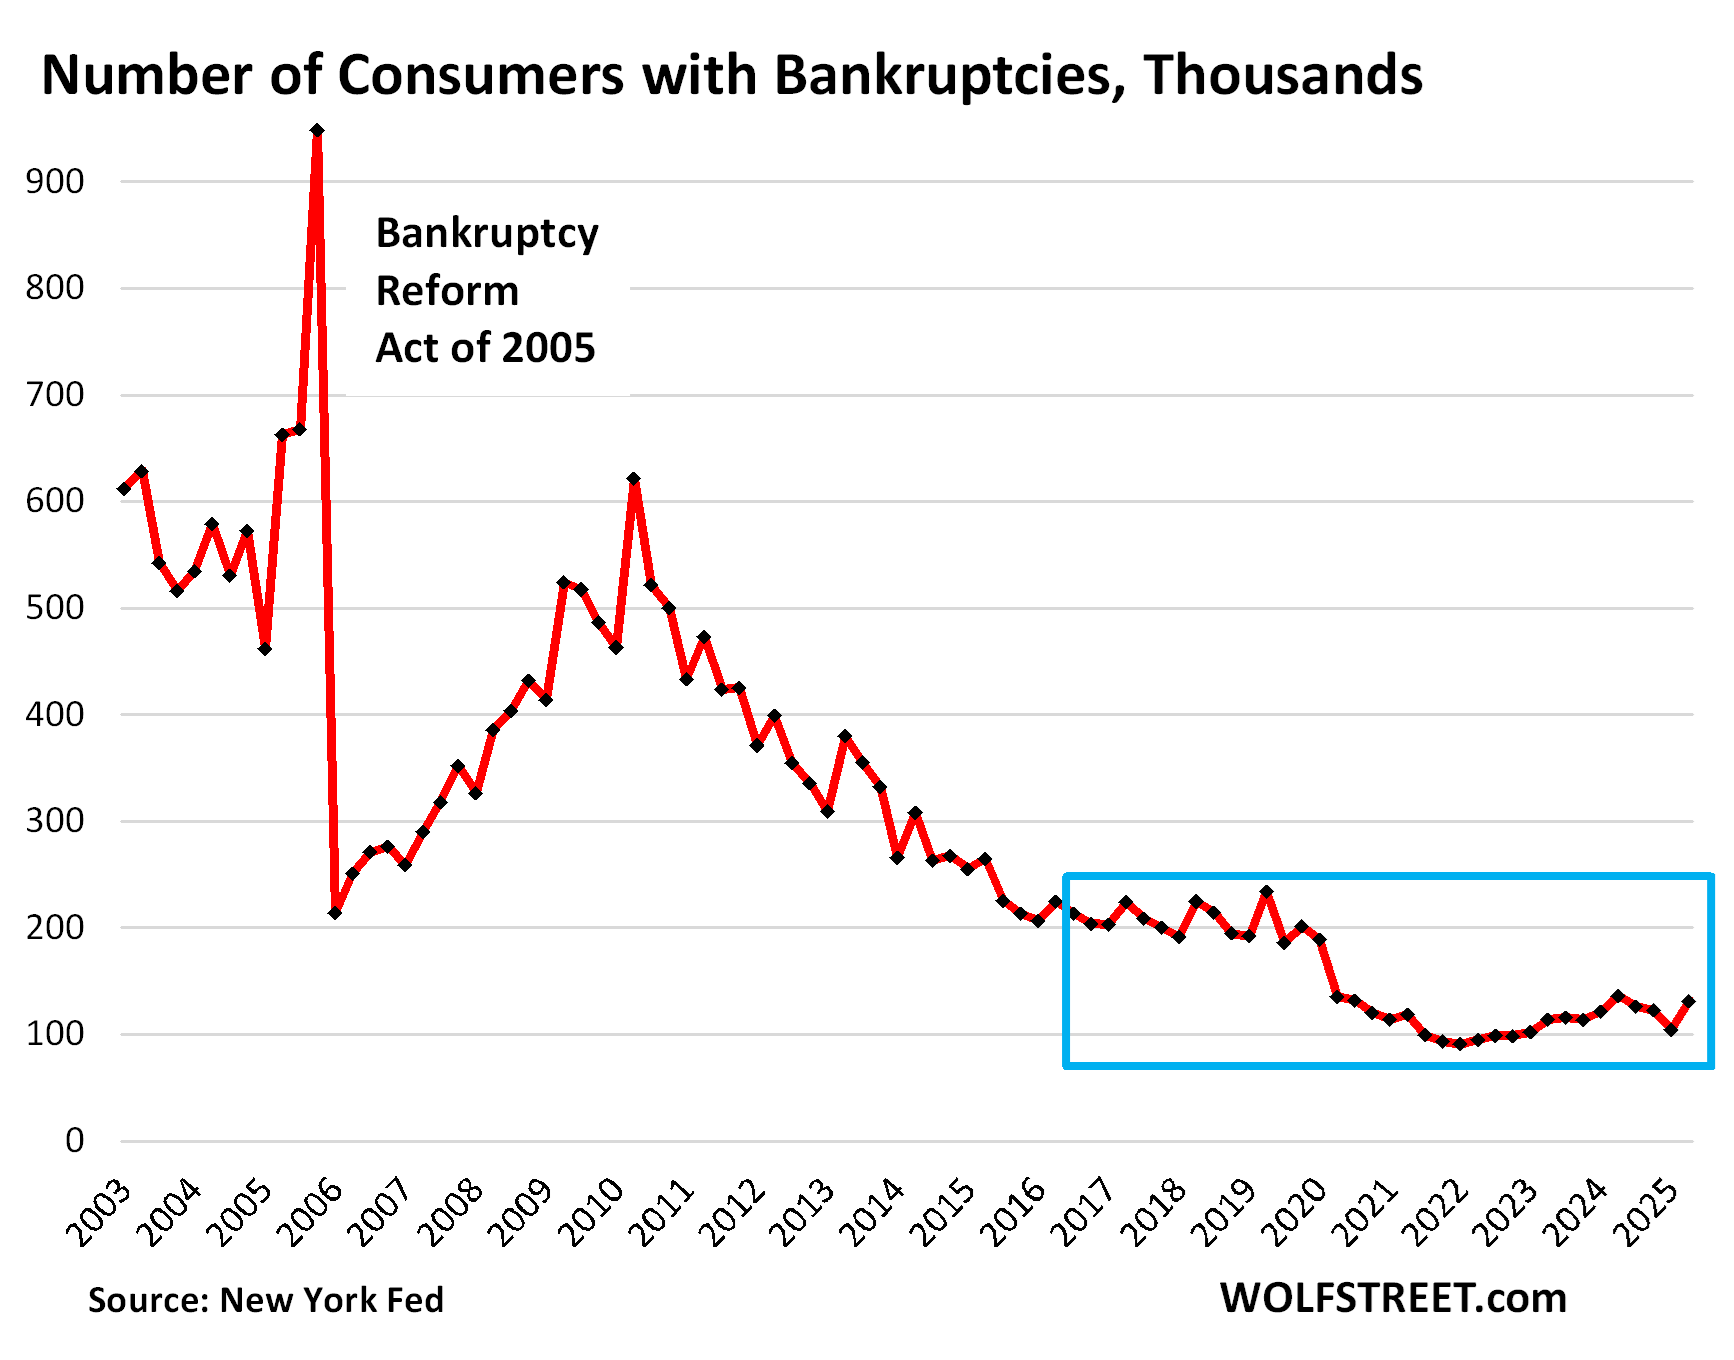
Bankruptcies remain low. The number of consumers with bankruptcy filings rose from a near-record low to 131,320 in Q2.
During the Good Times before the pandemic, the number of consumers with bankruptcy filings ranged from 186,000 to 234,000, which had also been historically low.
We’re going to wade into housing debt, credit card debt, and auto debt in separate articles over the next few days. Next one up is housing debt.
Enjoy reading WOLF STREET and want to support it? You can donate. I appreciate it immensely. Click on the mug to find out how:

![]()
Looks like there is absolutely no reason for the Fed to cut.
But they WILL cut.
Next meeting. Apparently 90% chance atm.
The jobs side called in sick
(Also we’ll see how well this ages 🥛)
The curve is going to get steep at this rate. Jobs vs inflation is going to be an unwinnable battle.
How accurate have prediction markets been at predicting the Fed’s actions over the past few years?
3 month T-bill says no cuts. Still holding at 4.25%.
Bubble economy is rocking! Wait till stock, crypto, and real estate reality hit.
Ahh peep show.
What a good one
📺
How could you forget the ham? On Christmas Jeremy!
The fact that it is celebrated when the debt to income ratio is ‘only’ 81.6%, is certainly not reason for joy.
It is utterly absurd to have that high of debt ratio, even if measured against net after tax income. That leaves only 18.4% left over to pay recurring bills, rents and food.
Secondly, as to some homeowner supposedly being able to sell their house for more than they owe on it, is patently ridiculous right now. Irrespective if they bought at the peak or not.
The housing inventory sale to closed transaction ratios are dismal. It’s in the data clearly, and as inventory for sale rises yet further with layoffs, we will see those delinquency and default rates rising as well.
Assuming the banks actually report the data on loans honestly in a mark to market environment.
1. You misunderstood in your first paragraph. The ratio here is “debt” to income, so the “total amount you owe” to income. It is NOT “debt service” (monthly principal and interest payments) to income.
2. “Assuming the banks actually report the data on loans honestly in a mark to market environment.”
Most of those mortgages are government guaranteed and held by investors via agency MBS; most of the remaining mortgages that are not government guaranteed are also held by investors via private label MBS. Banks only hold a small portion of the mortgages. That’s one of the hugest changes out of the financial crisis.
I note that FRED publishes a “Household Debt Service Payments as a Percent of Disposable Personal Income” chart.
I note that the current level is ~11.25% as of Q1 of 2025. That’s lower than all points on the chart with the exception of the COVID period, the early 1990s, and the early 1980s. Outside of the COVID period, the percentage never got below 10% going back to 1980.
Am I correct in suggesting that that paints the households as in even better shape than the debt to disposable income ratio, as it takes into account the change in interest rates, and is still historically excellent?
Thank you
“I note that FRED publishes a…”
You have no idea what you’re talking about. Stick to your knitting. That data (FRED only republishes the Federal Reserve’s original data) was trash, and the Federal Reserve knew it, and I knew it, and everyone knew it that ever looked at it, and finally the Federal Reserve trashed the entire data set, and started over again in Q3 2024 with an entirely new methodology, this time from the credit bureau, and backdated it. So this is a new creation just a few months old.
This is what the Fed said at the time about it:
“Changes to Debt Service Ratio (DSR) publication: Starting with the 2024:Q2 Debt Service Ratio (DSR) publication, the Board will transition to a new, credit bureau data-based methodology for calculating the DSR, Mortgage DSR, and Consumer DSR. The new series can be found at https://www.federalreserve.gov/releases/dsr/ and the new methodology is described here. An archived version of the old DSR series will continue to be hosted at https://www.federalreserve.gov/releases/housedebt/default.htm, but will no longer be updated. ”
NO WAY IN HELL WILL I PUBLISH A BAND-NEW DATA SET BASED ON A NEW METHODOLOGY.
I need to see it proven over time. Consumer debt service payments are hard to establish, and I DID publish the old DSR when I sill didn’t fully understand it, and I got burned.
In addition, that DSR chart looks very similar to the debt-to-income ratio because consumer debts are dominated by fixed interest-rate debts that don’t change during the term of the loan (mortgage, auto, student loans), and only interest-bearing revolving credit changes and that’s less than 10% of total debts.
It is total debt as a percentage of household income. Mr. Wolf clarified it nicely.
Zero debt is the new American dream.
Thank You for the post W.R.
It looks like the big Dipper actually. If you don’t pay the annual property taxes, you don’t own your home…perpuality is a given like paying for a bridge or road toll, forever after the asset has been paid off numerous times…60 percent of households own stocks… didn’t know this, thought it was much smaller.
Taxes pay for the system that creates and maintains property rights. No taxes, no property rights, no ownership.
*angry libertarian noises
Water, sewer. streets, cops, schools, libraries, fire…etc.
LOL state level taxes have almost nothing to do with that or IL and NJ would be twice as good at property protection than TX and FL, which they manifestly are not.
A more chilling stat is that the top 10% of households on 93% of the stocks held by households. It is extremely lopsided.
Had an argument with a coworker that ‘so what if amazon barely pays taxes (despite benefitting from the taxes we all pay) the stock has gone up a ton!”
That’s why they’re the top 10% and why they became the top 10%, LOL. If the bottom 10% owned 93% of the stocks, they wouldn’t be the bottom 10%, they’d be the top 10%!
I dunno about those stats.
Could be right but you know vanguard owns a ton of stocks because people’s retirement funds are invested in their mutual funds.
They get your check and literally go out and purchase the shares.
You sell and they sell too. But they keep so much cash in reserves they basically just take it out of there.
It’s really fascinating to see how it functions.
Somehow they use the futures market too after hours.
This is not chilling, it’s a manifestation of the value of people who have worked and saved and started businesses for 30 years, the top 10% are overwhelmingly people in their 60s who worked their whole life to get where they are, only to be demonized by clowns who don’t understand economics or free enterprise.
The distribution of stock ownership is important. The top 10% of households by wealth own around 93% of stocks. The remaining households own around 7%.
I’m not sure I understand your point about “perpuality is a given like paying for a bridge or road toll, forever after the asset has been paid off numerous times.” A bridge or toll road needs to be paid for in perpetuity because those assets need to be maintained in perpetuity or will decay beyond the point of usefulness. Paying for most assets is only the first step in an ongoing process of keeping those assets functional. Likewise, property taxes pay for schools, roads, police, and other services whose costs run in perpetuity, or at least until the community becomes a ghost town.
…the philosophical power of YOLO amongst contemporary ‘murican society…
may we all find a better day.
The cost of schools, roads, and police are a tiny portion of overall government spending, I would be delighted to return to a world where these items and defense were the only government spending.
Before 1811-33 if one invested in stocks and the company invested in went bankrupt, the shareholder’s homes and things could be taken!
You could have been thrown into debtors prisons.
Nothing goes to heck in a straight line except that 2-month jump from 1% to 13% for delinquent 30+ days of student loan balances. What the actual F?!
Anecdotally, I have a close friend who I suspect is delinquent on his 50k+ student loan debt, or may be soon based on hearing he’s now living paycheck to paycheck with a 100k+ salary. Brother never wants to talk about finances or ask for input/advice. Hedonic adjustment through and through. Ugh.
So the taxpayer is on the hook for the $200B+ delinquent student loan balances right? More ugh.
Makes me wonder how consumer spending for 24-40 year olds are going to shift, if at all, in the short and medium term based on return to paying student loan balances and the delinquencies.
A lot to unpack. Interest payments on student loans was supposed to pay for ACA. Before the pandemic, there was a lot of mismanagement of money. Today it’s worse due to a long pause of student loans. BNPL will show up on credit reports soon. Terrible policy created today’s financial distress. Repayment rate of student loans low before pandemic and now worse than before. I was one of the 450k people that made payments of a 40 million populous of loans. Wish there was something good to say about this, but people need to be more responsible.
I agree, but there’s been a whole generation of kids that were raised with the idea that all you have to do is go to college and everything else will take care of itself.
Still on board with the personal responsibility thing, but feel kind of bad for the people that were making major long-term decisions at only 17 and 18 years old based on lousy advice.
Going to college can work out very well if you pick the right subject. Plenty of bad advice was flying around about that by the looks of it.
I was fortunate that my advice of ‘better get a second degree you can get a job in to supplement the one you love that the college encouraged you to get’ worked out well. Got a bit more debt to income ratio than was necessary for the advisee but that’s life.
We call that bad parenting.
Every action must have a reaction. Colleges committed fraud and became an entire industry over employing and over paying. Just like healthcare. If you bailout student loans, the job market will still suck, but the colleges will get off scott free. Isn’t it odd that in the last 20 yeas, the only industries that have grown and grown and the costs have become unreachable for many is healthcare and higher education? If you polled how those people vote, how do you think it would look? They are literally that quote from some guy back in the 18 century about democracy only lasting as long as people realize they can vote themselves money.
The benefits of a college education are obvious. Trouble is many students and many parents are foolish.
My fourth child just graduated and will soon be working in NYC in the banking industry. Computer Science degree and 4 year varsity athlete. She had a plan, worked hard, and developed marketable skills.
I went to college to get into medical school.
You’ve got to set goals and then execute your plan to achieve them.
So personal responsibility, nobody is arguing with you Chris.
In fact, i’d say when you boil it down, every problem our society faces is do to a rejection of personal responsibility. Seriously think about it. Name a problem and i’ll tell you how its due to a rejection of personal responsibility. And this is why the left will lose in the long run. They reject nature, fine if they want to do that, just don’t make me pay for it.
“Seriously think about it. Name a problem and i’ll tell you how its due to a rejection of personal responsibility. And this is why the left will lose in the long run. They reject nature, fine if they want to do that, just don’t make me pay for it.”
The forever wars conducted against countries that have never invaded the USA. I’ll be looking for a stat on how much of the $37T debt is due to wars.
House,
“…the only industries that have grown and grown and the costs have become unreachable for many is healthcare and higher education”
Source? Data from many sources shows college affordability in line with CPI for decades. If you’re smart about selecting a school, it can be more affordable today than historically (it’s food and shelter that makes it out of reach for many without large loans).
Your personal responsibility comment is so silly it’s not worth responding to
“The forever wars conducted against countries that have never invaded the USA. I’ll be looking for a stat on how much of the $37T debt is due to wars.”
Has anyone held those who initiated them personal responsible? Or do Democrats now love George the stupid?
@ BenR
“College tuition has generally risen faster than inflation, with average tuition costs increasing nearly 180% over the past 20 years, while general inflation has been much lower. This trend indicates that college costs have outpaced the overall inflation rate significantly.” sofi.com finaid.org
Silly huh? You wouldn’t happen to work in either of those industries would you? ;)
Listing random websites to defend made up claims isn’t citing a source. And my field of work doesn’t influence college tuition costs. Maybe if you took your education more seriously you’d know that!
Average cost of in state tuition at a public school is under $10k annually in 2025, according to research by the Education Data Initiative (article: Average Cost of College Tuition). You can earn that back in a year after graduation if you work hard and pick a good major. Plus, you’re significantly less likely to sound ignorant on message boards! (source: your posts)
Hahaha whatever guy, i have no student debt. And when this blows up again next (and it will) and the bailouts don’t work i sincerely hope you get crushed! ;)
“So the taxpayer is on the hook for the $200B+ delinquent student loan balances right? More ugh.”
Maybe, but the borrower is on the hook forever. Those loans are non-dischargeable in bankruptcy, and the interest keeps accruing whether in forbearance or not. Student loans plus a bad major: Not quite as bad as a felony record, but it’s getting up there. I paid mine off long ago, but know others who are in a bad spot.
What about a bailout for students, Americans who supported higher education only to get eliminated by AI with limited entry level jobs? It’s interesting that the money changers got bailed out, autos, etc…but not the little people…well, they got 5 years, that’s something…isn’t fraud a business model for the fortune 500? Pay fine, move on.
How about we make the colleges and universities that sold these BS degrees cover the cost rather than the taxpayer.
I almost spit out my coffee. I love the idea!
But but but we need to renovate the gym for a 3rd time and add granite to the freshman 1400 sqft dorms!
Bingo. Require Universities to pay for defaults in student loans, instantly all gender and ethnic studies programs vanish in a cloud of smoke.
…while we’re at it, mebbe have the NFL/NBA/et al, kick back some financial acknowledgement of the unpaid value of their farm systems and infrastructure for same (…tough, I know, given the past record of ‘muricans tax support of sports stadium construction…)?
may we all find a better day.
Shiller proposed an insurance to protect against career nullification. I quite agree!
“A People’s History of the United States” by Howard Zinn is a great place for people to learn and understand the true American system.
From the revolution through the constitution, the design goal was to protect the monied and property holding class at any expense. If people went on strike because they were working 12hr shifts in horrible sweatshops, the owners would call up their friends in local or national government. Those friends in government would then send in either cops, or military, or paid enforcement goons to crack heads and break the strike or protest. The time period where labor(that would be most people in our society) made gains was late Industrial Revolution to the Post WW2. Workers gained at the expense of the monied class. You know ridiculous crazy stuff like overtime, safety standards, non discrimination protections, vacations, maternity and paternity time off, sick pay, so on so forth.
Seems the current political team in DC is backing the monied class 100%, as is the true historical norm. Every policy I have read about undermines citizens protections. All the agencies they gutted were agencies that are purpose built to benefit the people.
Opening our national parks to resource exploitation, gutting regulations for clean air/water, eliminating health insurance for millions, attacking workers rights. Regression sure is fun.
May I suggest reading “The Great Taking” by David Rogers Webb….
The only way to end the student loan “crisis” is to completely stop any and all taxpayer backed Federal student loans. Cold turkey. The existing $1.8T or whatever it is can be financed at 2% fixed and paid off – or be delinquent on credit reports like any other debt.
Without that plentiful taxpayer money that “might not have to be paid back if you vote right wink wink” colleges and universities will have to either dramatically lower tuition or maybe self-fund the loans and collect the payments themselves.
MOODY’S economist says USA ‘on precipice of recession’…
According to these recession mongers, the US has been on the precipice of a recession or already in a recession ever since the Fed raised its rates to 0.25-0.5% in March 2022. There are thousands of comments here to document this.
Motley Fool has these 5 stock picks!
Lol
If you had bought AMZN in 1999…
I feel your comment on student debts: ” Delinquent loans mess up credit scores, limit the ability to borrow, and increase the interest rate borrowers have to pay when they do borrow. ” doesn’t go far enough in describing the hole into which delinquent borrowers are sunk.
Those bad credit ratings make it difficult to rent, difficult to get a good job, and cost them higher rates on insurance, and may make it difficult to get a bank account. The inability to borrow money affordably makes even transportation needed for a job difficult.
Many, if not most, will ever dig themselves out of this hole. We are creating an entire lost generation of people.
If you get current on ALL your obligations and stay current, pretty soon your credit rating starts to improve. It doesn’t improve if you don’t get current.
If only there a way to fix this like, call me crazy, paying off a loan you voluntarily took…
Bankruptcy. Oh, wait….
Wolf wrote: “So seen as a monolithic entity, the American Consumer is in good shape, the balance sheet is in good shape, 65% own their own homes, over 60% hold equities, they have $4.6 trillion in money market funds that still pay around 4% in interest”.
I’m in the 60% that owns a home, with money in the stock market and tons of cash in money market funds that is doing pretty well, but I rent to people in the 35% that don’t own a home, have much in the market and most spend more than they make most months (even when they make over $120K/year) with mulriple 18-20% credit cards with big balances that make me cry. It seems like saying “a monolithic entity, the American Consumer is in good shape” is like saying “looking at San Francisco and Phoenix as one entity the weather is a mild 89 degrees” when it is a 64 in SF and 113 in Phoenix today.
Lots of renters are “renters of choice” that pay $4,000 in rent or $10,000 in rent and are doing fine. Nearly everything that was built for rent over the past 15 years has been higher end for renters of choice — because that’s where the money is, LOL. You’re renting to the lower end of the market, it seems. But kudos. That is an essential part of the rental market.”
” with mulriple 18-20% credit cards with big balances that make me cry.”
That is a relatively small number of people — including the classic young dentist I mentioned that got into it over his head. And the total amount the owe all combined is only about $500 billion. These people will pay off their credit cards and be fine and other people rotate into their spot, and then rotate out of it, that’s how it goes, part of the learning curve. I went through that too when I was young.
Wolf is correct that I rent mostly on the “lower end of the market” (for those in other parts of the country on that SF Peninsula that is apartments worth ~$500K/unit that rent for ~$4K/month). The one property I rent that I don’t own is my brother’s first home in Burlingame that is worth ~$3mm and rents for $9K/month and the people looking to rent that home “West of El Camino”over the years have had better looking credit reports than anyone looking to rent my apartments “East of El Camino”. I would be interested if Wolf has ever seen something that calculated that percentage of “renters by choice” that could actually “buy” a home or condo similar to the one they are renting (aka had liquid assets that would allow them to make a down payment big enought to qualify for a loan to cover the rest).
So people rent in the center at a higher-end tower with lots of amenities at for example $5,000 a month, instead of buying out in suburbia for $5,000 a month… that’s a big part of the “choice” that people make: They WANT to live in a central location or within walking distance of the BART or whatever, and nearly all multifamily construction over the past 15 years has catered to them.
Then there are the other renters of choice that the big single-family landlords now go after with their purpose-built SF rental developments. These are nice houses in the suburbs or further out that now rent for less than the monthly costs of buying an equivalent house in a similar area. There may be 300-500 rental houses in that kind of development, with common amenities, such as a leasing-maintenance office, a pool, etc. They choose to rent because it saves them money, and because they don’t have to hassle with ownership issues, and if they want to move a year or two later, as many younger families do to change jobs, they can do so without losing their shirt trying to sell the home they’d bought a year or two earlier.
This is all widely discussed in the earnings calls of those landlords. They tell you the median household income of their tenants, which are above the local medians. They tell you all kinds of interesting stuff, including rent increases on renewals v rent increases on lease signings. As landlord, you’d find their earnings calls and financial statements interesting. You can get the transcripts of those calls from Seeking Alpha. I have discussed a few of them over the years here, just like I discuss the homebuilders occasionally.
I love your message “this should have been taught in college.” I got news for you, that’s way above the capabilities of the current “educators” in college. These basic financial education should have been done in high school, but nope, we are still too busy teaching equity in the public school systems. There is no such thing as basic finance or even how to keep your own checkbooks balanced… why? Cause checkbooks are obsolete, and everything must be gamified to help part you from your money.
And besides, good financial education must be limited, otherwise, where will we get our debt slaves from.
If someone had told me when I graduated with over $50K in student loans back in 1992 that’d I’d have 5 years of NO interest payments and could focus on paying down the principal I’d have been overjoyed! I hope some of the people with student loan debt took advantage of the “moratorium” to either pay down their debt or save enough that they can now pay down a large percentage of that debt.
Is it possible they just forgot they had loans?
No.
I think they figured that these loans would be forgiven, and it would be stupid to make payments. Someone actually told me that. Had the temerity to tell me that.
I’ve heard this as well – it was the rationale for not paying down principal during the moratorium.
I had the exact same conversation with two young dudes at the Denver airport back in 2023. Advised them to begin paying now, because the loans wouldn’t be forgiven, for the simple reason it gives the government leverage over them. Here we are, and i’m shocked, shocked i tell you, that gambling is going on at this establishment.
Many such cases, I knew a guy who bought a house back in 2021 because he could now “afford” the mortgage with the money he no longer was putting to his loans. I wonder how he’s doing these days.
(Meanwhile, I refinanced my student loans to private in 2019 and made full payments the entire pandemic. At least my interest rate is only about 3.2%.)
This seems harsh to me. If corporations were told they didn’t need to pay back loans temporarily, the loans wouldn’t be subject to interest, and there was a chance the loans would disappear at taxpayer expense, do you think the corporations would continue paying them? Corporations have been bailed out constantly but the idea of some indebted citizens catching a break for a few years is that outrageous? I paid my loans off within a few years of my degrees, but if I hadn’t, it would’ve been silly not to take advantage. Simple mathematical decision.
I had a number of friends that weren’t aware that the payments were restarting. All with different loans from different lenders, none claimed to have gotten a notice that payments were restarting. They all took some hefty hits to their credit scores.
Well if you think in a macro sense:
Loans are financial innovation that help GDP + More people graduating (that wouldn’t before) helps GDP + more advanced education helps GDP
+more advanced careers/employees/population
= overall better gdp.
Does one just say American makes X from the whole package and then minus out the loans?
If the loans are minuscule compared to the GDP gain then yes it’s a good idea to incentivize that to encourage the growth.
True only on a macro scale, because STEM and accounting and finance degrees are mixed with degrees that don’t add financial value to the economy.
Thanks Wolf. I’m curious where you got the BNPL numbers. I was under the impression that they were not that transparent. Keep up the good work!
Patience. That will be part of the credit card article.
Regarding student debt, sorry but when the previous admin suggested pardoning that debt I was major PO’d. Lot’s of parents put them through college, and lots of their kids (one being me) worked and went to school. That free ride thing was crazy, sorry to say it.
Government loans for student education should never have happened. The universities should have been the lenders to students. Many universities have rich endowments. The universities are the ones who ultimately profited from student loans, and we see this in the massive increases in professor and administrator salaries, benefits, and pensions.
The money went from taxpayers to the government to the students to the universities to the professors and administrators. I got through university by working and the occasional scholarship. Back then tuition costs were lower. Colleges actually provided an education. Loans were not generally needed and professor and administrator salaries were reasonable. Universities nowadays are cesspools of corruption and graft.
Colleges and universities are the ones who jacked tuition up through the roof over the past few decades. When I went to UCLA in the 1970s tuition was $250 per quarter for an annual in-state tuition of $750 per year for 3 quarters. Tuition – especially at public universities – needs to drop back down to these levels or become free.
Yes, who system is broken. I admire the countries that public education doesn’t stop at high school but fund valuable education that benefits society whether it be college or the trades. Fortunately at least where I am at junior colleges are almost free for 2 years. It is almost like the system was purposely setup to get people into debt early on. State universities weren’t all that expensive in the early 90s and with 2 years of JC you either had no debt or paid it off quickly.
100%
If you want to finance a new Honda, you talk to Honda Financial Services.
If you want to finance a Harvard degree, you should talk to Harvard Financial Services, not Uncle Sam.
Yep.
It’s exhausting to consistently read the uneducated commentary regarding student loan “forgiveness” under the previous admin. Loans were NOT BEING FORGIVEN. It was a $10K BALANCE REDUCTION. The assclowns who pen self-righteous commentaries like this are usually the same ones who scammed the government for FRAUDULENT (and, yes, FORGIVEN) PPP Loans.
Does own a home mean outright. mortgage free or just they are the owner?
About 40% of the homeowners have no debt on their house. The remaining 60% of the homeowners have some to a lot of debt on their home. But they’re all on the title and own the home.
“This should have been taught in college.”
Nice.
I’m just curious if this data includes people like my wife and I, who sold our house in 2022, moved multiple states away, and are renter’s of choice due to current simple math.
Yes, our income has technically increased every year, and we also carry ZERO debt; however, due to inflation and frankly, corporate greed, for the things we spend our money on, we’re pretty much a wash. The only corpo revenue garnished from us is purely inflationary/demand (if we chose to outlay).
We’re not actively increasing GDP with our spend — just maintaining the status quo. Not exactly a recipe for growth (especially at these inflated P/E ratios). Just makes me wonder how many are in the same boat, let alone those who are underwater?
The point is: not exactly a gangbusters growth scenario, regardless of debt servicing.
I feel the same way. I think I was better off in 2019, and I’ve switched jobs since then.
“There is suddenly an old reality out there: Delinquent loans mess up credit scores, limit the ability to borrow, and increase the interest rate borrowers have to pay when they do borrow. That should have been taught in college.”
Can we please add one more important (maybe THE most important) financial lesson to be taught to, what seems like everyone involved with college and college finance, from students to school faculty to administration to reporters and politicians clamoring for “affordable student loans”
Student loan interest is SIMPLE but College Costs COMPOUND and compounding always wins in the end.
If costs continue to increase at rates above a reasonable amount (inflation, income growth), at some point even a zero percent loan will be un-affordable.
Then what?
Wow. A whole lotta people here are bent out of shape over student debts. Wolf wrote: “Roughly $213 billion (13.0%) of the $1.64 trillion in student loans outstanding were 30-plus days delinquent in Q2.”
My Libertarian buddies are always telling me: “A debt that can’t be paid, won’t be paid.” If the debt can’t be paid, why carry on with all this extend and pretend ? Just write the debt off. Then either get the government out of the student loan business, or limit involvement to something small, like maybe $3,000 total.
Even that $1.6 Trillion number does not seem as big as it once was. Since the topic here started out talking about “spending like drunken sailors”, lets look at the Billionaire who spent $500 million for his yacht ( a half trillion $ right there).
A google search found: “using his vast wealth, primarily accumulated from his ownership stake in Amazon. He also likely utilized loans, potentially secured by his Amazon stock, to manage the purchase and ongoing costs, as borrowing can be more tax-efficient than liquidating stock.” Yeah baby, what could possibly go wrong here? ? (sarcastic rhetorical question). And Bezos is just one debtor.
Full disclosure here. My first semester of college back in the 1960’s was $159 (for 18 credits). A big number for the time, but manageable. Unfortunately, I had an expensive girl friend in college, and graduated with $350 in debt, which was paid off over 3 years time.
OK. Rant over.
500 million is half a billion, not half a trillion.
You are right. My mistake.
“Just write the debt off”
One person’s liability is another person’s asset.
@old ghost If EVERY household in America paid an extra $1,000 a MONTH for a YEAR we would still not pay off $1.6 Trillion.
I pay in-state tuition at a large public university in Florida. Graduate school program. $990 for 3 credits. 30 required to graduate. Thankfully employer reimburses me tuition and textbook costs, but not a couple approximately $40 in fees.
Much more cost competitive than the >$70,000 program I was eyeing at Columbia in NY.
Write off debt that “won’t be repaid?” No, the government has a big stick. It demands taxes, or else. It can demand repayment, or else. Folks may be unhappy with that, but that’s why you don’t take loans from Uncle Sam in the first place. The government should get out of the loan business anyways. Puts government in this awful position.
Wolf Street.com, the only reliable financial news provider. I will hold off another quarter before I purchase my doomsday bunker.
@SoCalBeachDude UCLA was close to $1K/year for 3 quarters in the early 80’s when my sister went there (the state school I went to was a little less for 3 semesters).
If anything I think that schools like UCLA should “raise” not lower the price of tuition. I also think that they should make the classes harder and let kids transfer in to fill the spots of the kids that can’t cut it (vs. lowering the bar and inflating grades to get a “diverse” graduating class like they are doing now).
Before the 60’s less than 10% of American adults were college grads and I feel that the main reason they were more suscessful than average had to do that they were smarter than most Americans and “most” college students were already from the social and economic “top 10%” (aka they started on third base).
Today most (almost all) high schools try and get EVERY kid to go to (borrow money) and go to college (even the kids that have a hard time reading and doing basic math). It is no surprise that most 18 year old kids will take “free” money to go party at a “college” (and we now have half the men under 30 living with parents and I have a hard time finding anyone who speaks english to fix anything).
UCLA was always very selective as to those admitted including back to 1976 when tuition was $750 a year. Currently, in state tuition is now more than $12,000 per year and going up all the time and should in my opinion be reverted to less than $1,000 per year while maintaining high standard for those accepted.
I remember when I sent my youngest off to college. Only 10 years ago or so. They did everything possible to exclude the parents from seeing what was going on or having access to any of her records. To give me access, even to pay online both she and I had to jump through all sorts of hoops.
I sat with her one year as she went through the registration process and the screen with the final bill came up. They offered student loan financing as an option and the checkbox for that option was pre-checked. To opt out of borrowing we had to go through 2 more screens and press several buttons. They made it so easy and painless to spend and borrow…a lot like congress I guess.
Schools must protect student record privacy, pursuant to the FERPA act of 1974. For students over 18, schools need specific permission from the student to share records, for example about grades, enrollment, or billing, even with parents.
Personally I think it’s a dumb law, it makes even such ordinary tasks as writing letters of recommendation a bureaucratic matter. However, it is the law. :shrug:
That’s the educational-financial-real-estate complex you were fighting.
Once again, well intended members of society have kind of screwed up a bunch of under informed kids.
If the assumption is that college degrees should be almost as common as high school degrees, how can they have substantially more value for the average graduate?
At the same time the value of the degree decreases, the cost goes through the roof and these poor kids get to live with it.
Dan, thanks for the perspective financial aid checkboxes boxes, BTW.
Perhaps a mandatory 3 credit Bible class in the freshman year would be helpful….
“The rich ruleth over the poor, and the borrower is servant to the lender.”
– King Solomon
Just understanding a few of the Proverbs could save folks a world of lifetime hurt.
Look !
A thumper !!!
Have lost too much to the Chinese. Watch “GM Will Die Soon. They Deserve It. (Engineer explains why)” on YouTube
Bob Carey at First Trust says this:
“From a geographical perspective, the share of credit card debt currently in delinquency (30 days past-due) surged among people living in the wealthiest U.S. zip codes, increasing from 4.8% in Q2’22, to 8.3% in Q2’25.”
Might be worth keeping an eye on that one as a frontrunner of potential issues, considering top ~10% spends the ~50% …
That guy is a dumb noodle. I’m so tired of commenters dragging stupid BS into here that some dumb noodle tried to create clickbait with on the internet, and that I then have to waste my time with.
1. his numbers are total bullshit. He has no idea what he is talking about, nor do you.
2. credit card delinquencies are DOWN year over year and are 2.8%.
3. Low-income people don’t qualify for credit cards, or if they do, they have very low credit limits, and when the small balances become delinquent, it’s not even a rounding error. It’s the people with higher incomes that have the high credit limits, and when they fall into delinquency, then they move the needle, that’s always that way, DUH.
4. That manipulative dumb noodle is comparing the historic Free-Money low in q2 2022 to current rates.
Looks like he got those numbers from the St Louis Fed chart here
https://www.stlouisfed.org/on-the-economy/2025/may/broad-continuing-rise-delinquent-us-credit-card-debt-revisited
Yes, you just proved that all my 4 points nailed it, that you have no idea what you’re looking at, this are quarterly “transition into delinquency rates” by individuals and doesn’t include those that have exited delinquency by getting caught up. They’re NOT actual delinquency rates by dollar balance. And the charts only go back to the free-money low-point, which is my #4, that this is manipulative bullshit.