The situation in Texas and its four big metros, Houston, Dallas-Fort Worth, Austin, and San Antonio.
By Wolf Richter for WOLF STREET.
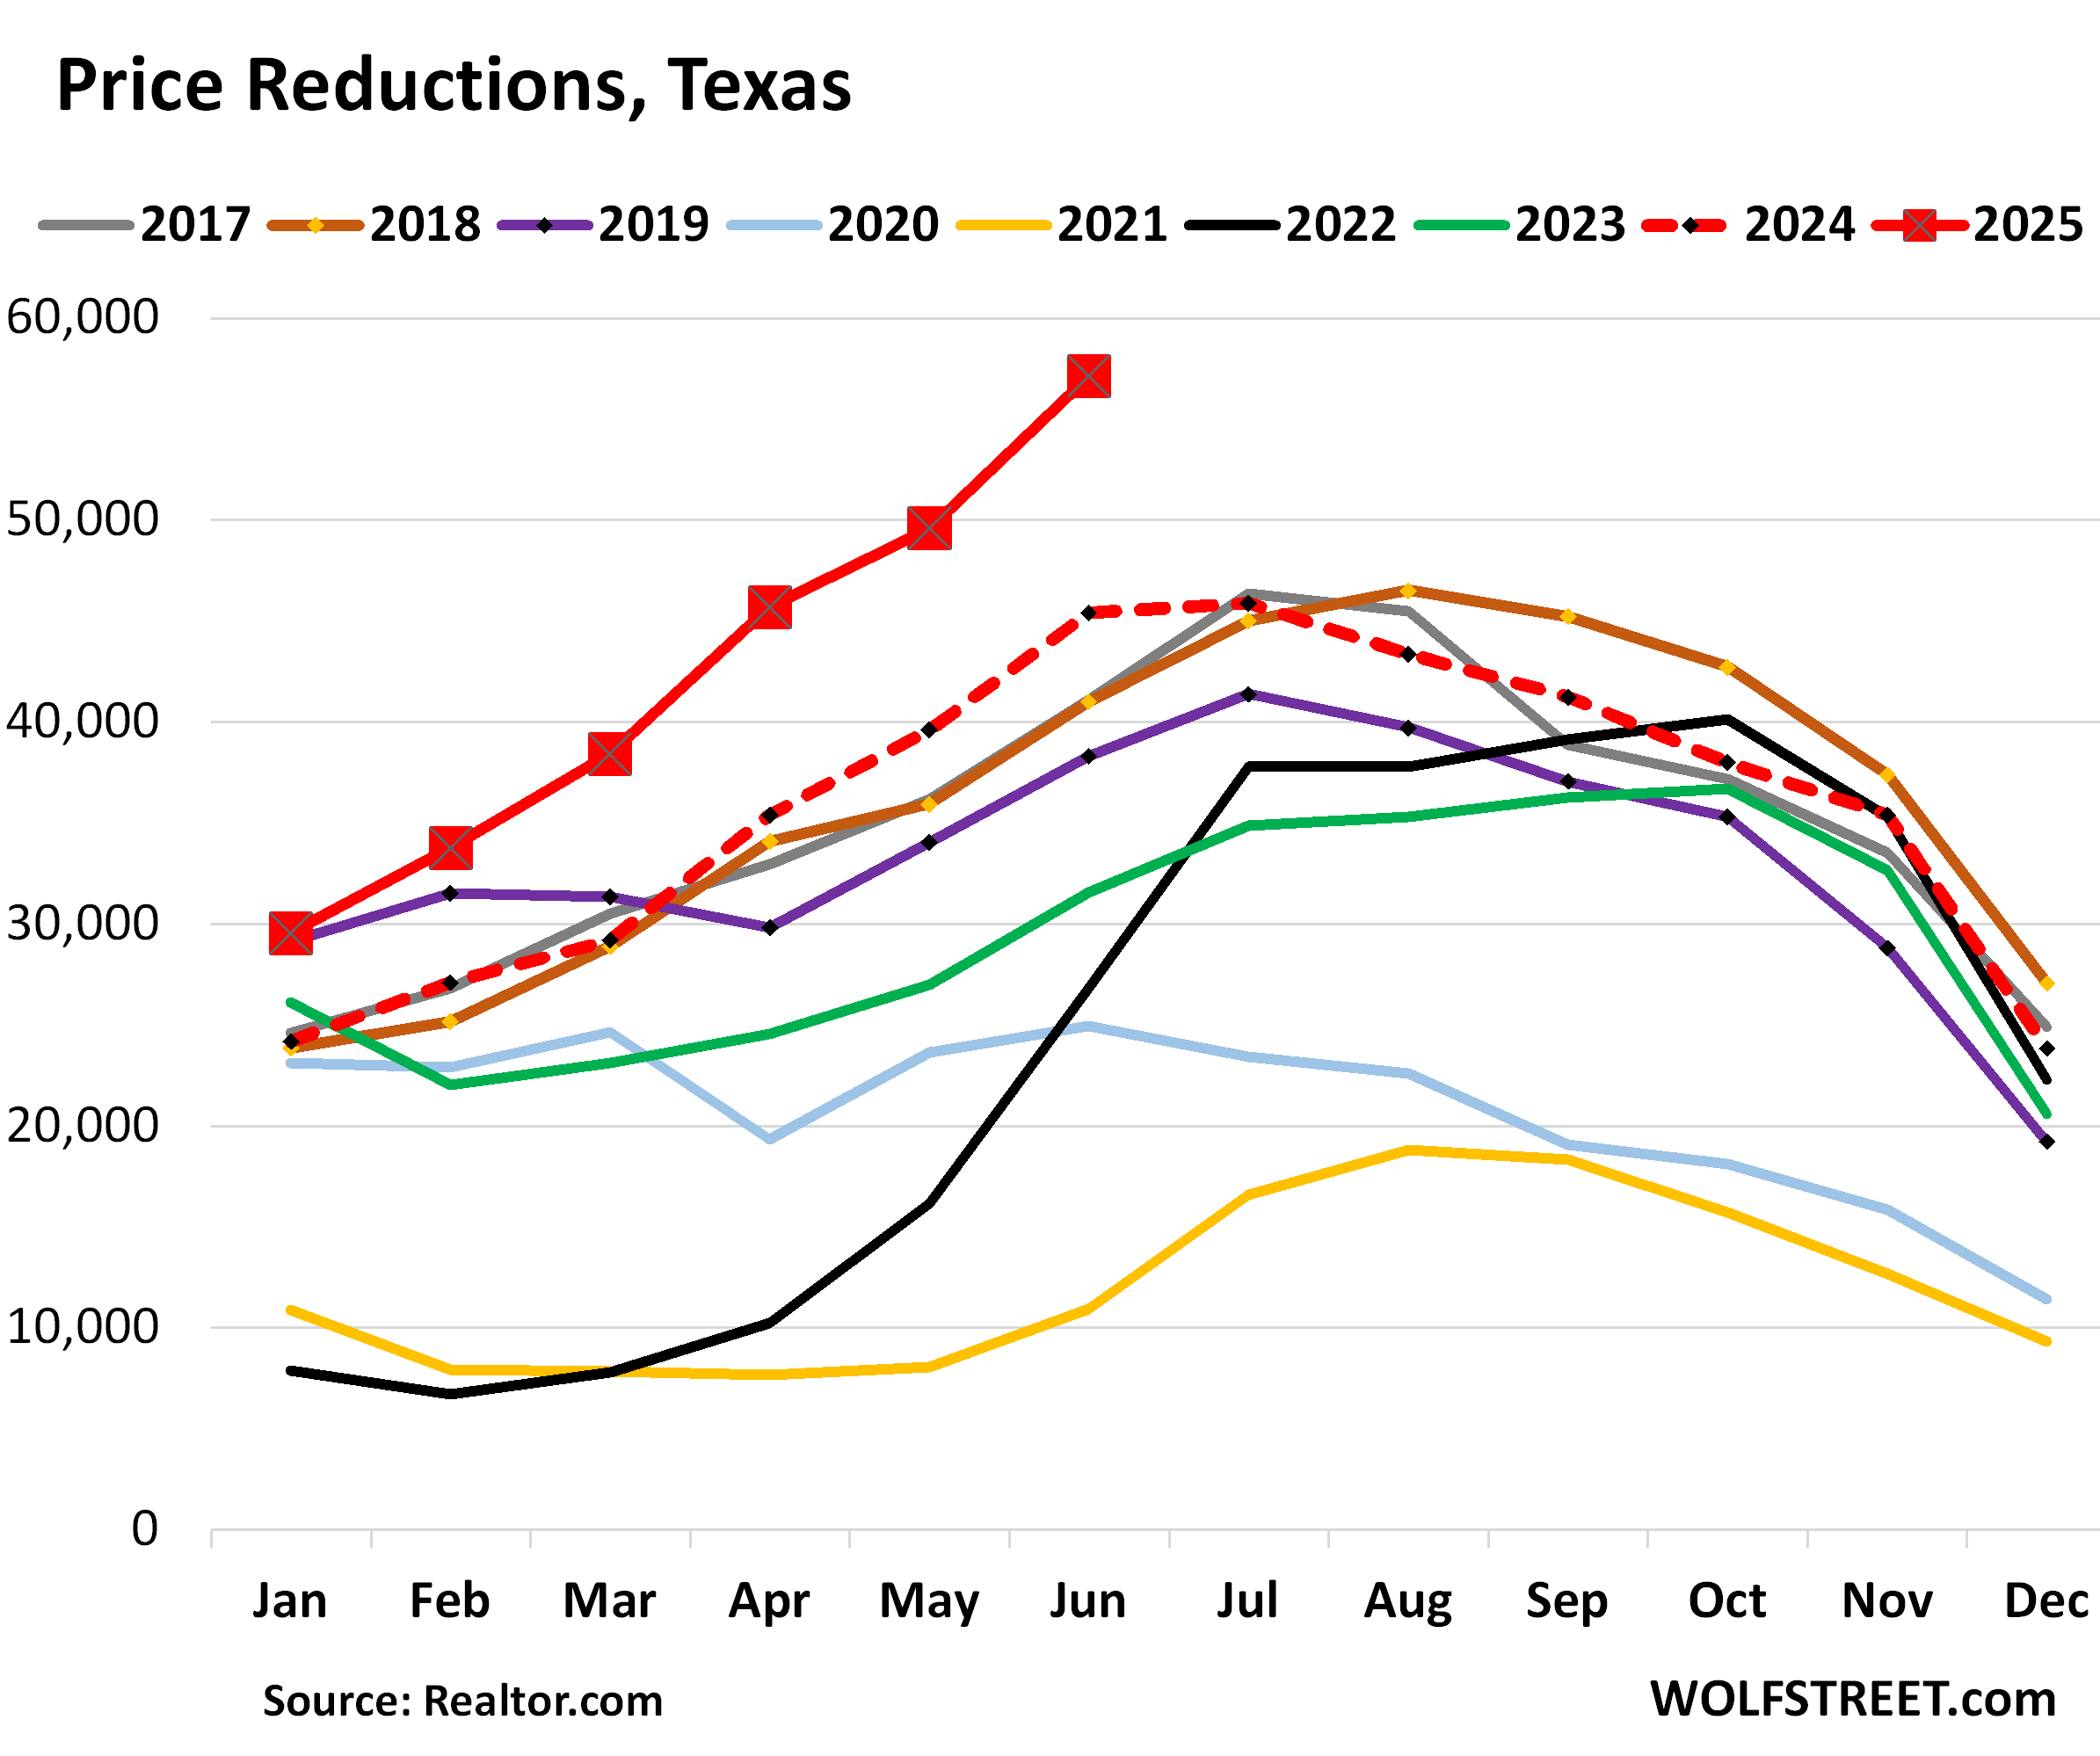
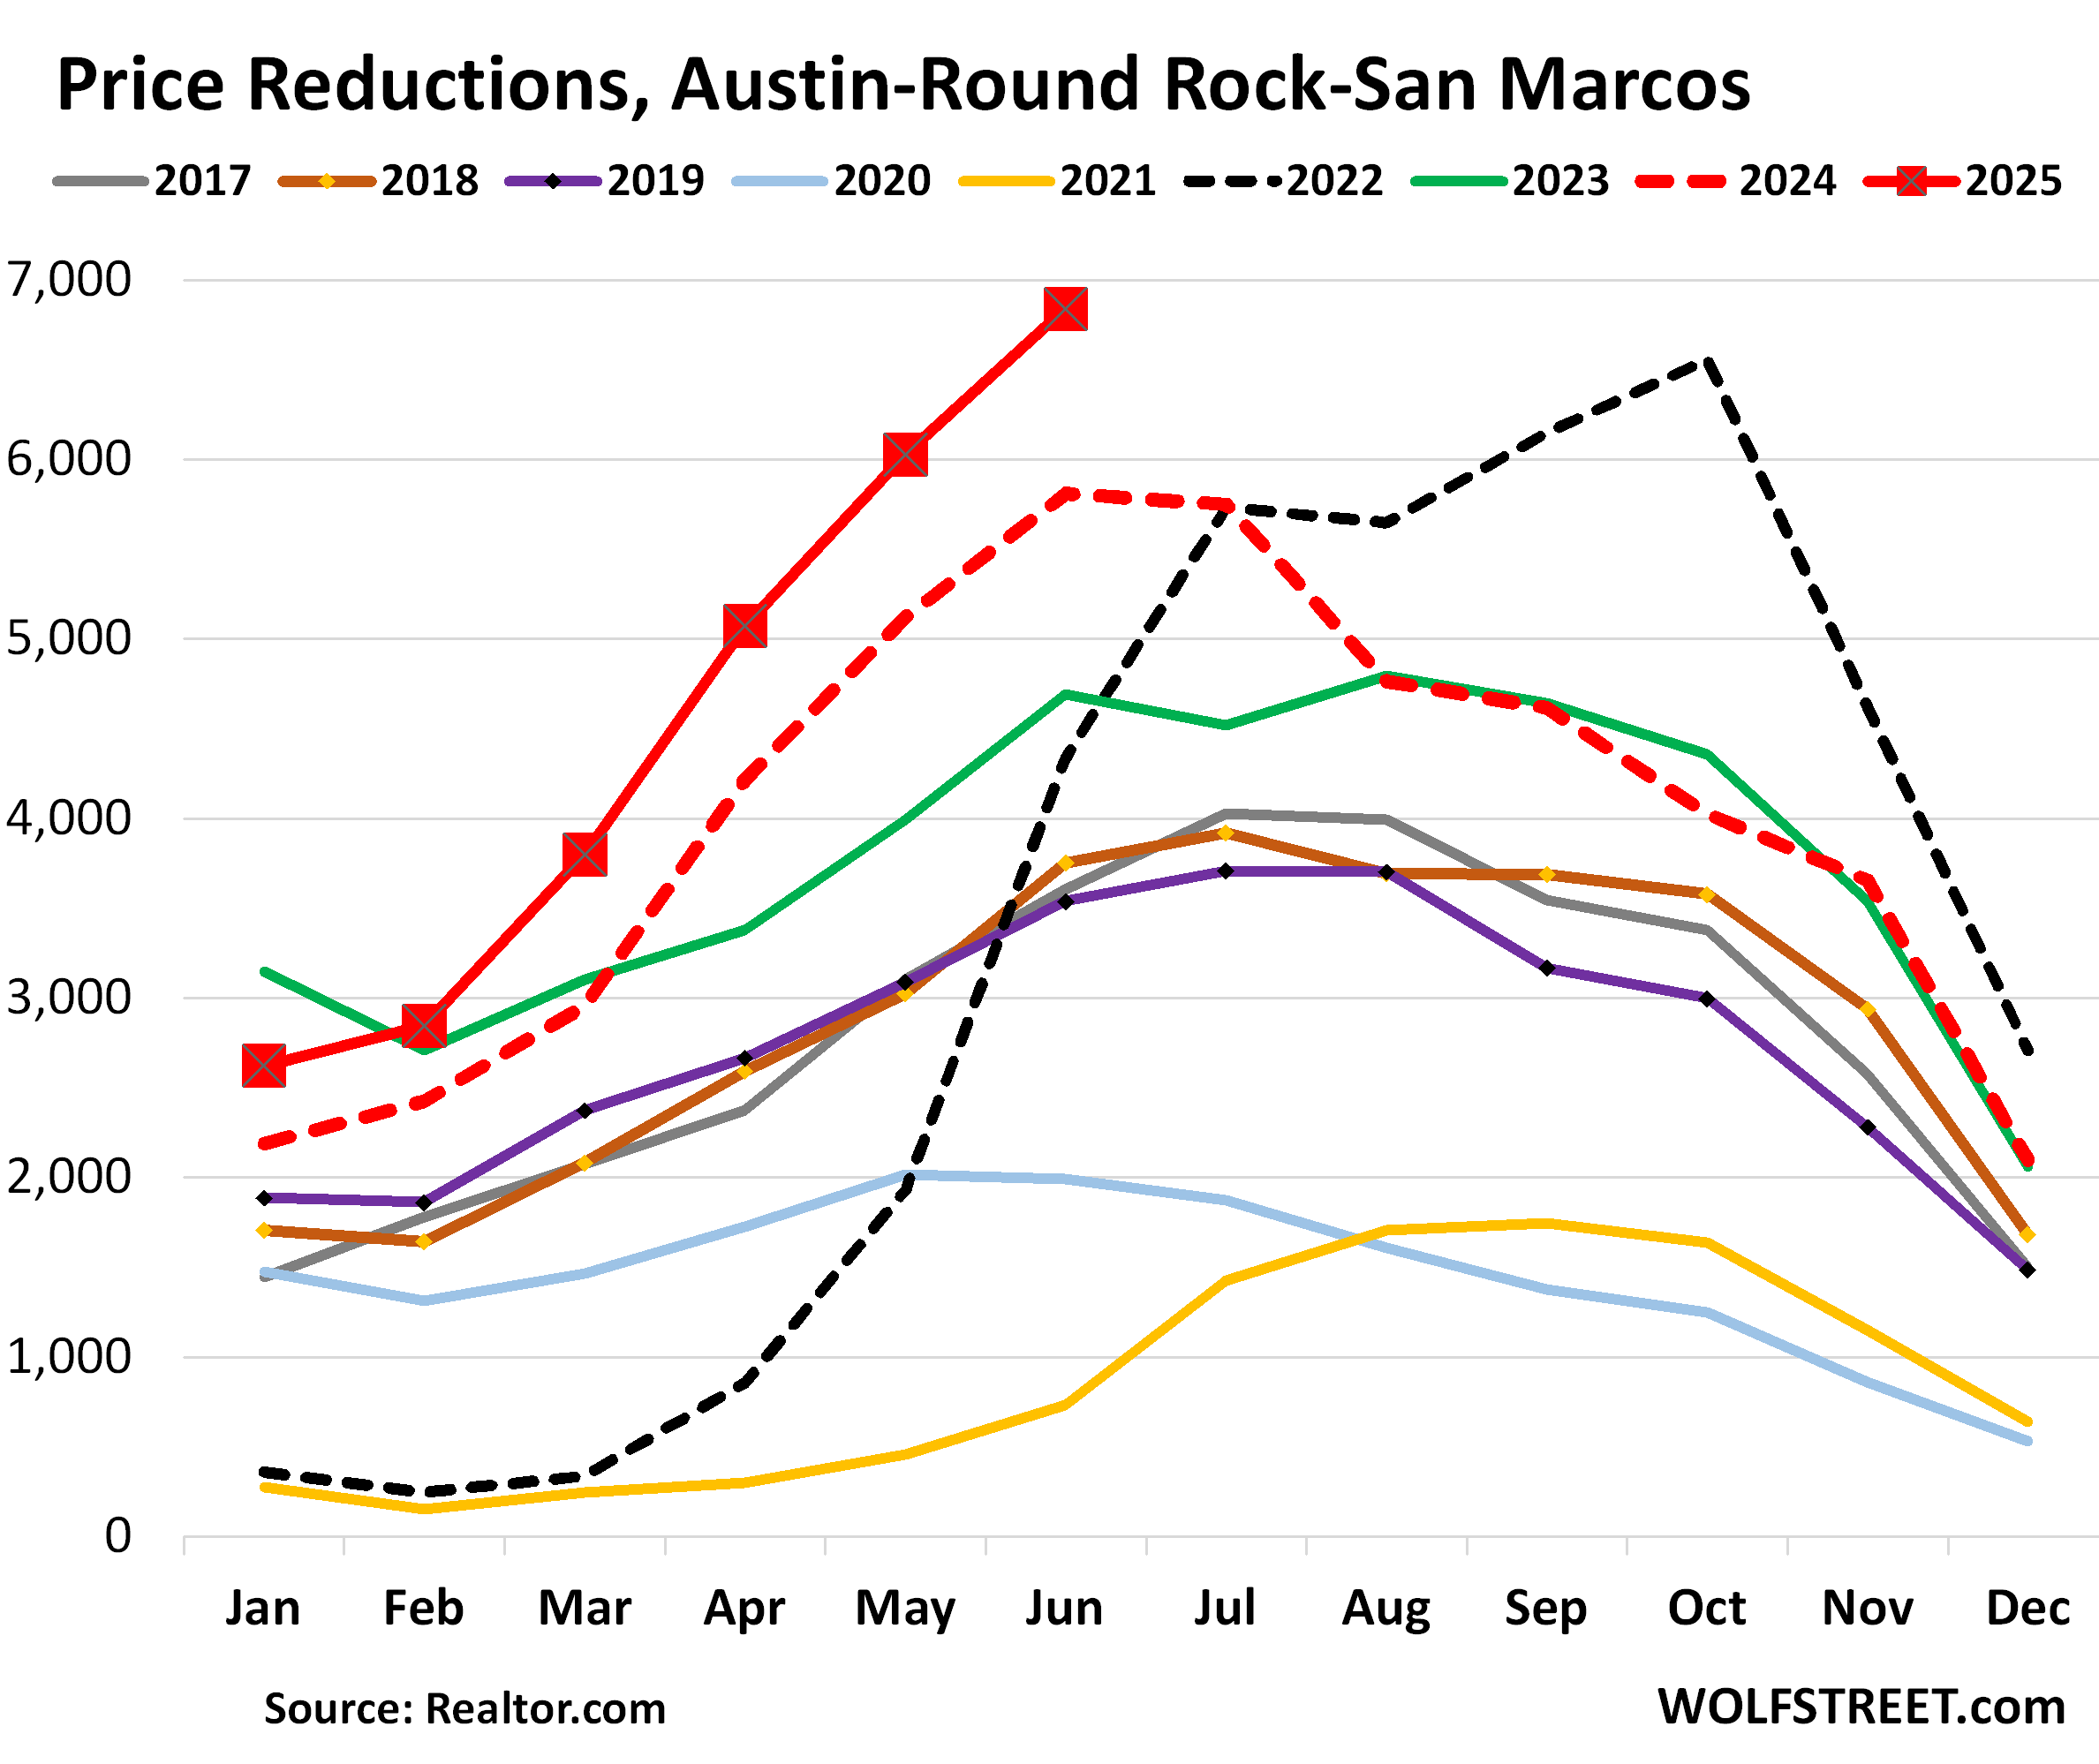
The price cutting has started in a serious way in Texas, after the mindboggling price explosion. The number of homes on the market with “reduced” listing prices jumped by 26% from a year ago, to the highest level in the decade-long dataset by realtor.com, and up by 49% from June 2019.
Price cuts, if initial listing prices are too high, and lower prices in general are what it takes in this market where prices had exploded in prior years, and where demand has then fizzled, and where inventory is now blowing out.
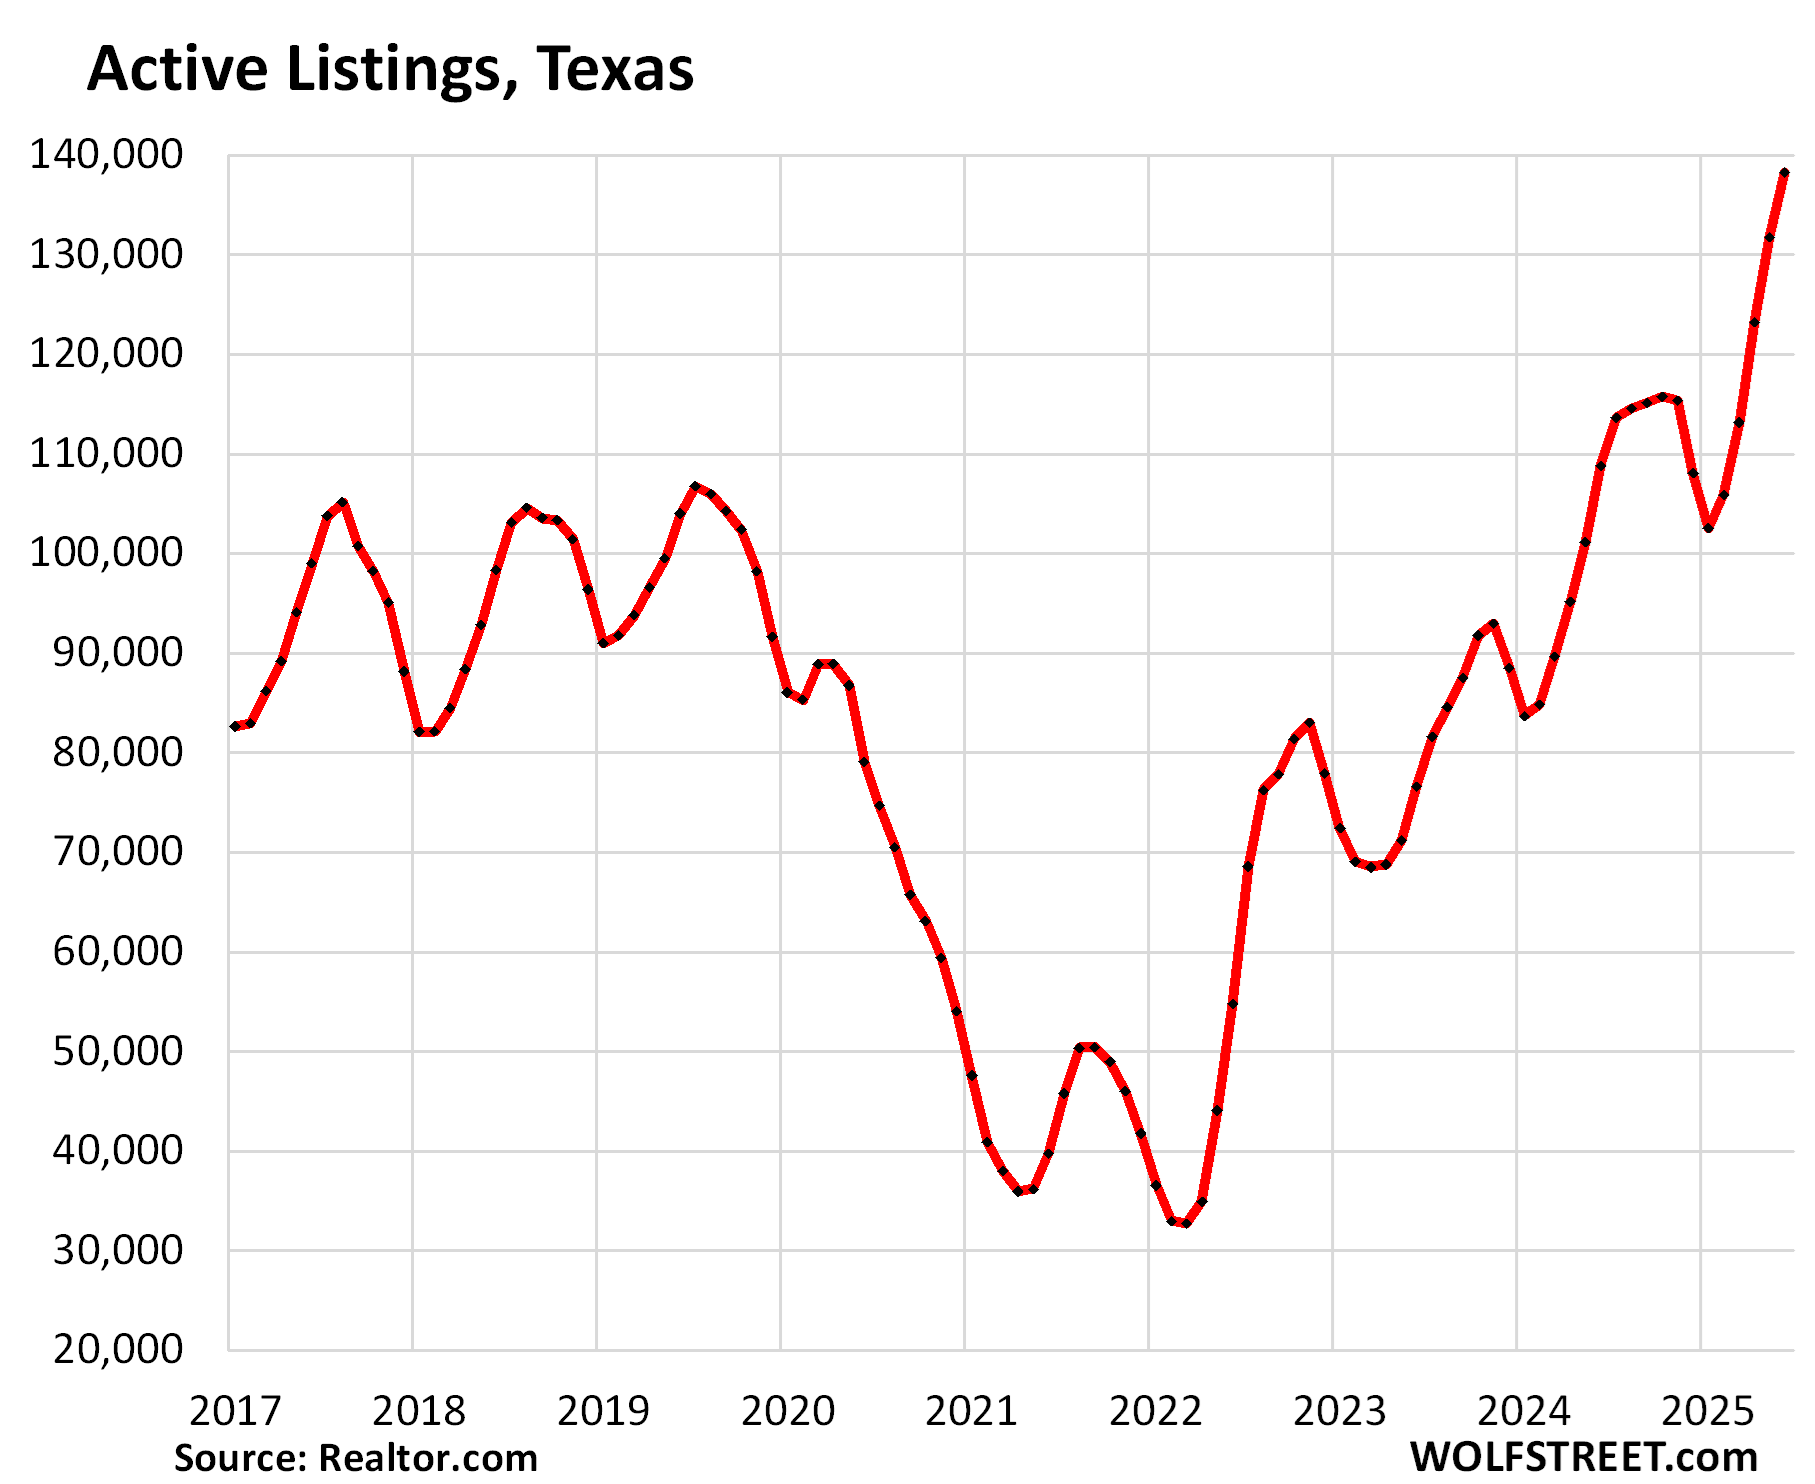
Inventory of homes for sale in Texas jumped by 27% from June 2024, by 33% from June 2019, and by 41% from June 2018, to 138,255 homes, by far the highest in the decade-long dataset from realtor.com.
During the housing frenzy in 2020 through the first half of 2022, inventory plunged to very low levels, as everyone was trying to buy, no matter what the price, while people who’d bought and moved into their new house then didn’t sell their old now vacant house in order to ride the price spike up all the way. That’s what caused the depletion of inventory on the market.
And those vacant homes now piling onto the market, after too-high prices have killed demand, has caused this spike in inventory.
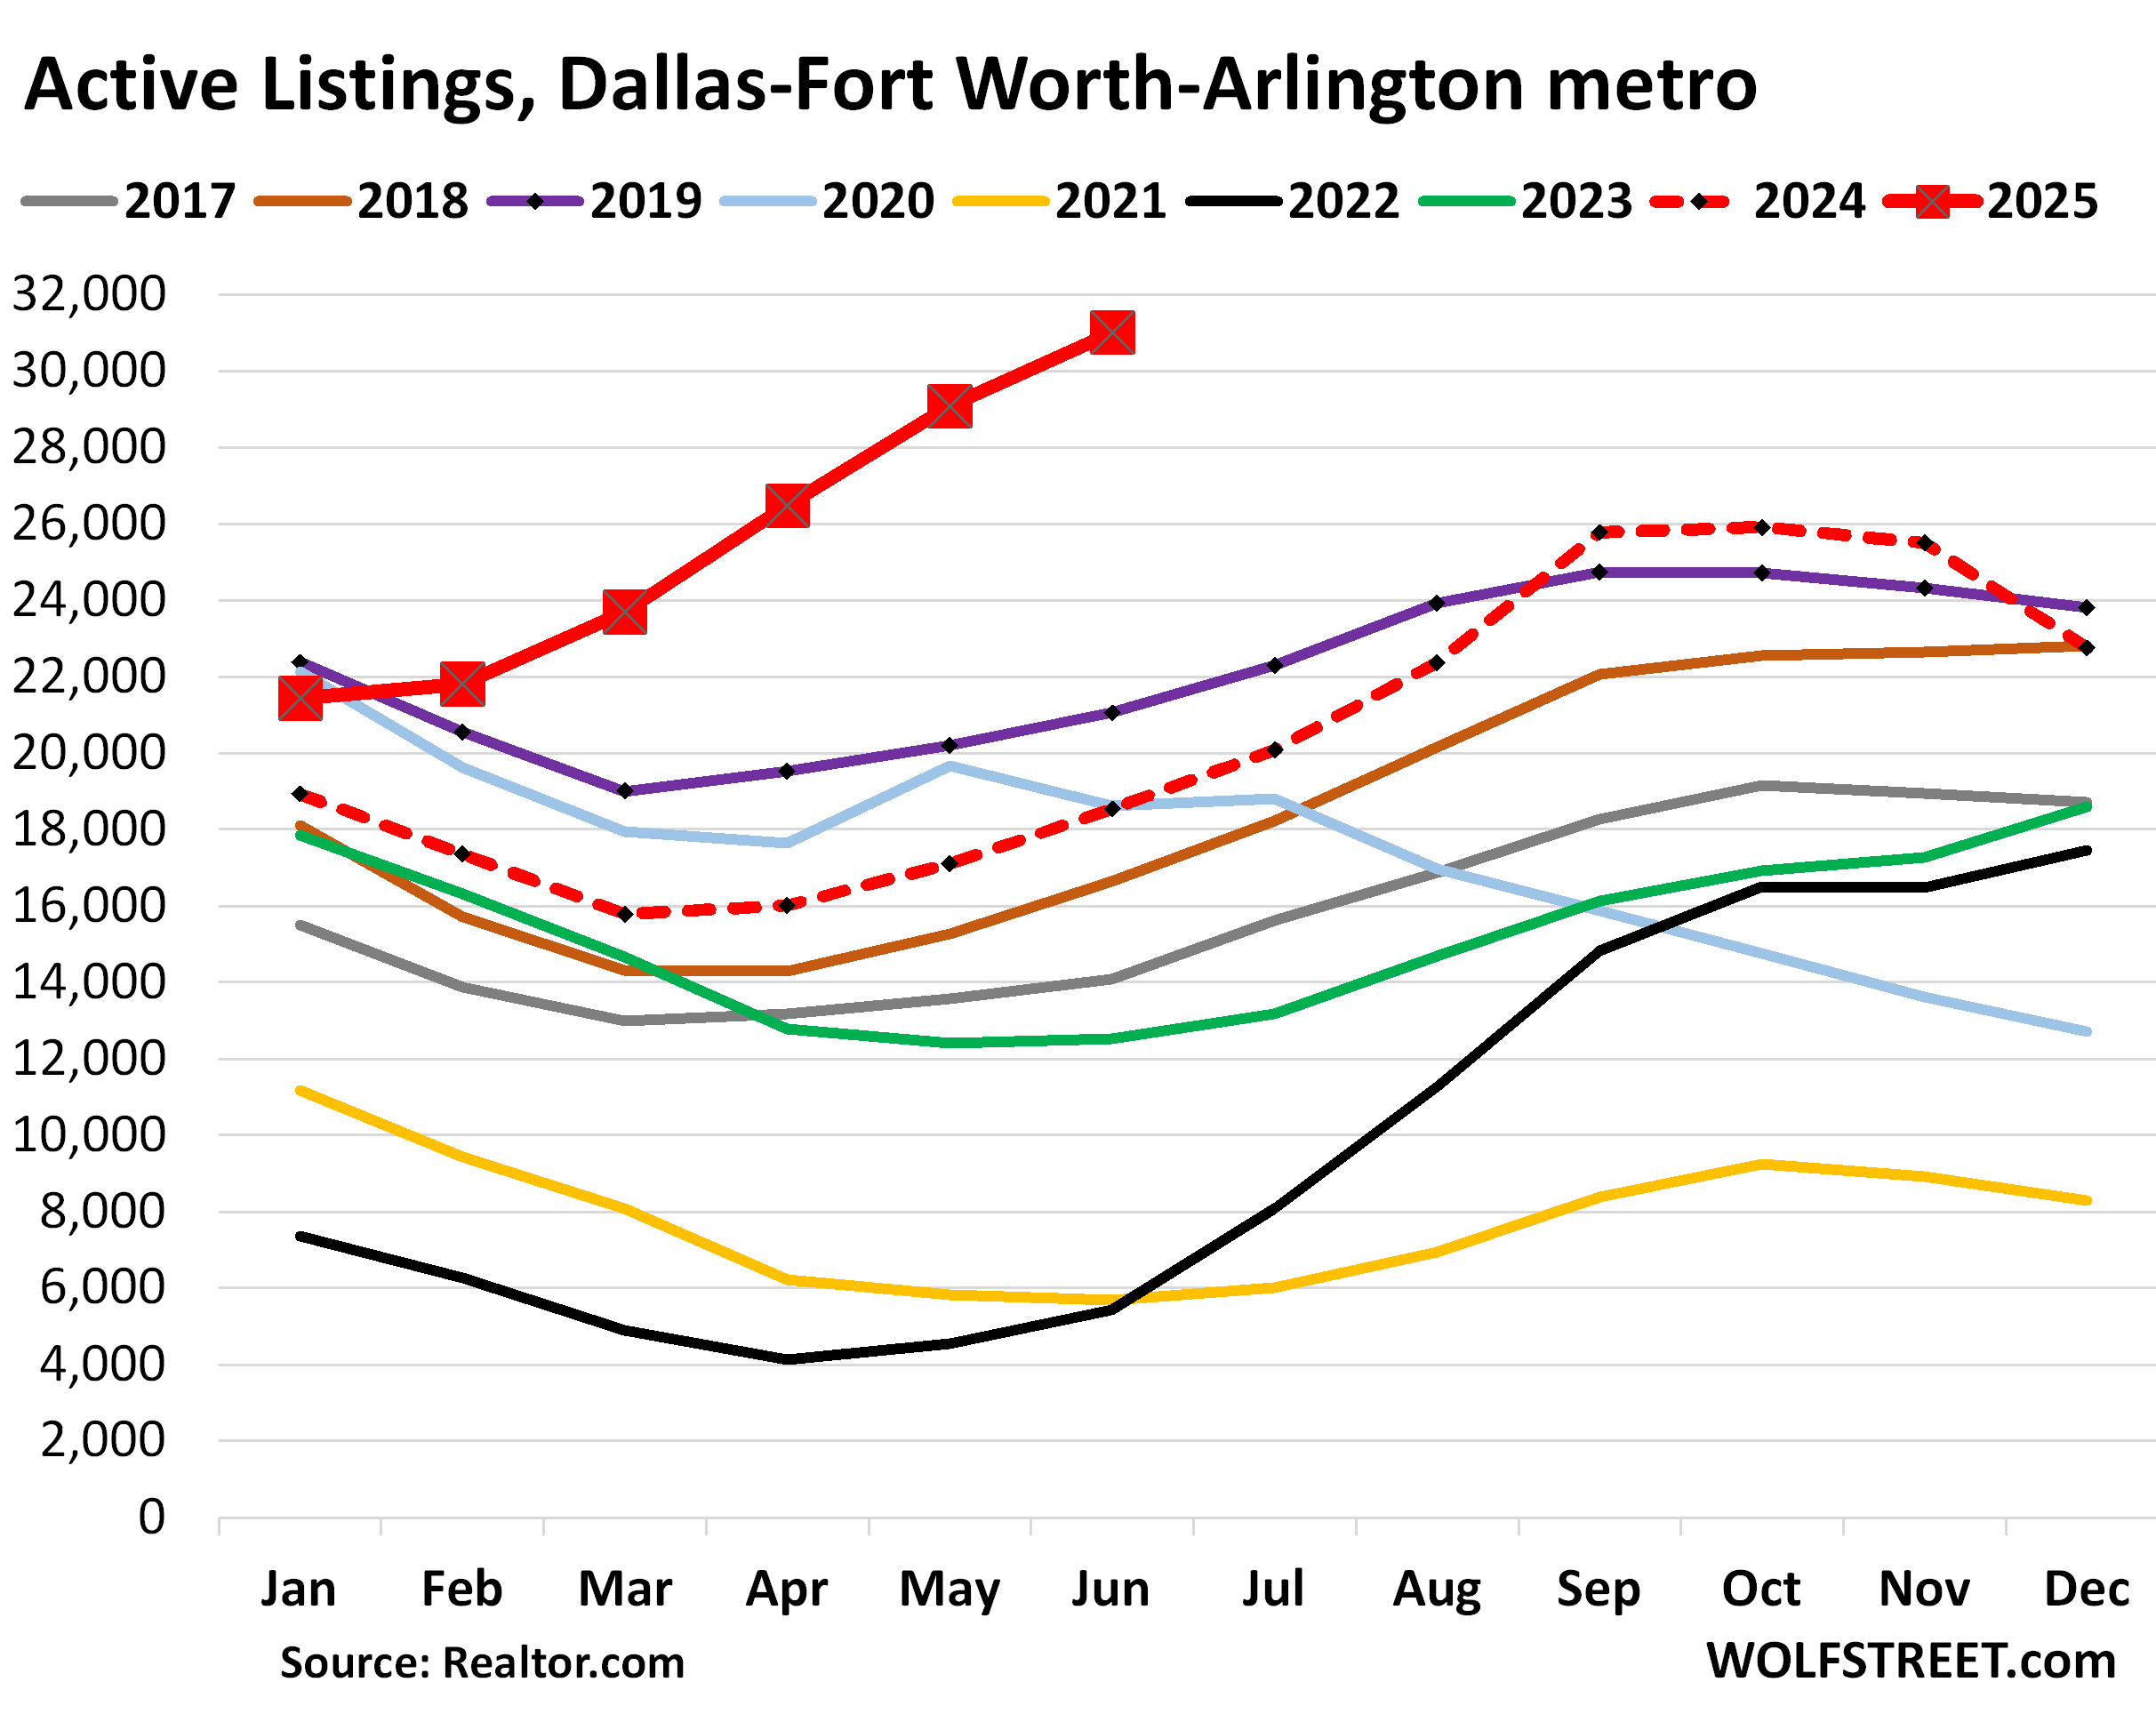
In the Dallas-Fort Worth-Arlington metro, active listings spiked by 67% year-over-year, to 30,998 homes, by far the highest in at least the decade of the data by realtor.com.
Compared to 2019, active listings are up by 47%, compared to 2018 by 86%, and compared to 2017 by 120%!
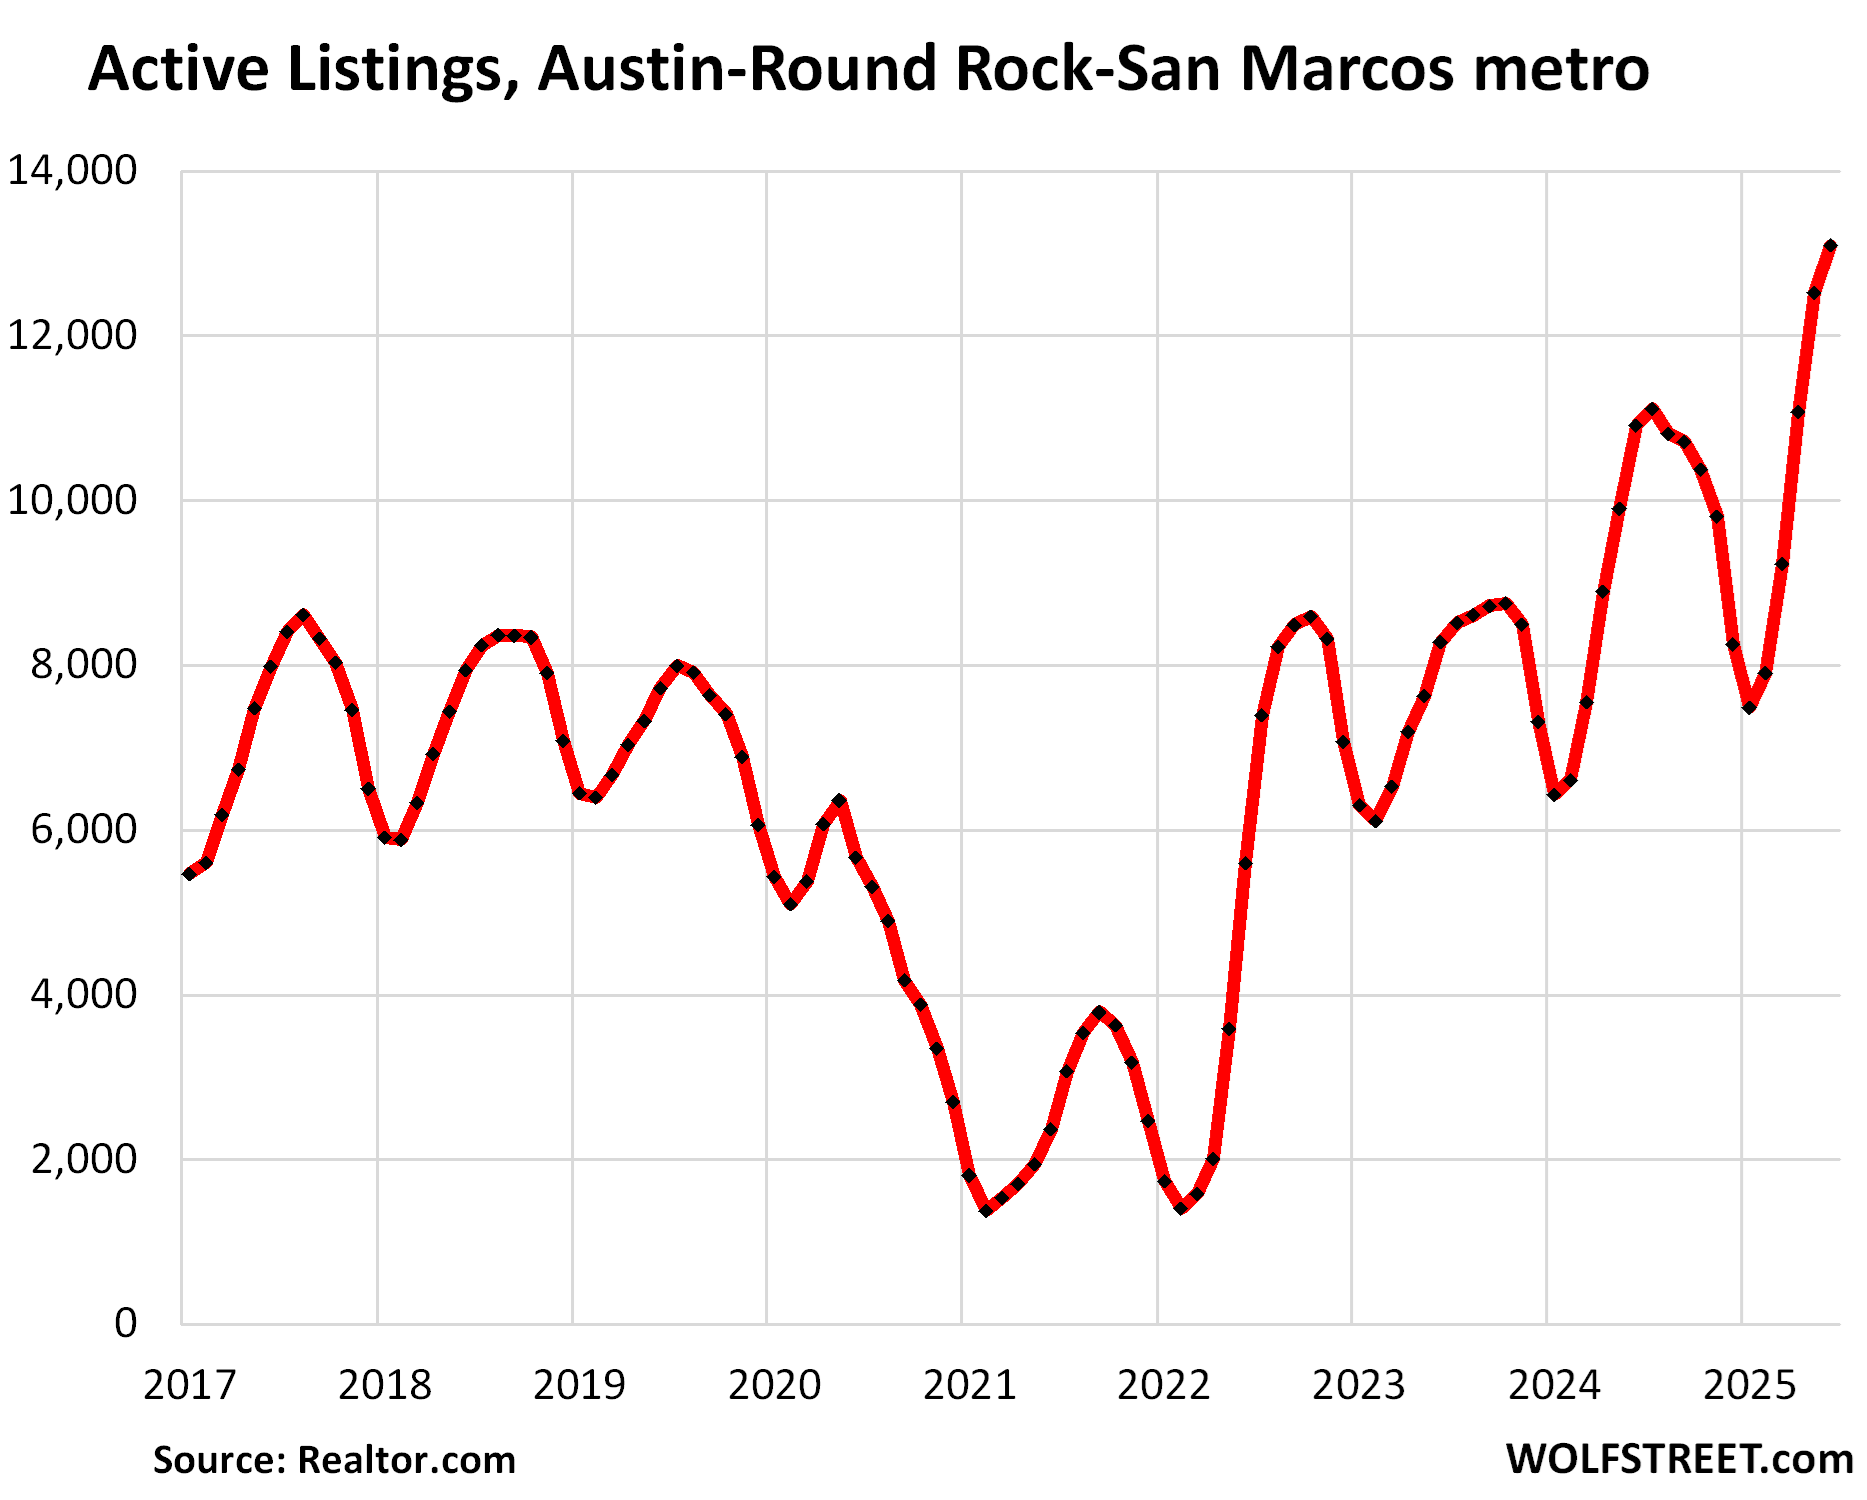
In the Austin-Round Rock-San Marcos metro, active listings jumped by 20% from the already hugely bloated levels in June 2024, to 13,105 homes, the highest in the decade of data by realtor.com. Compared to 2019, inventory was up by 70%!
And the price cutting is getting serious, highest in at least the decade of the data by realtor.com:
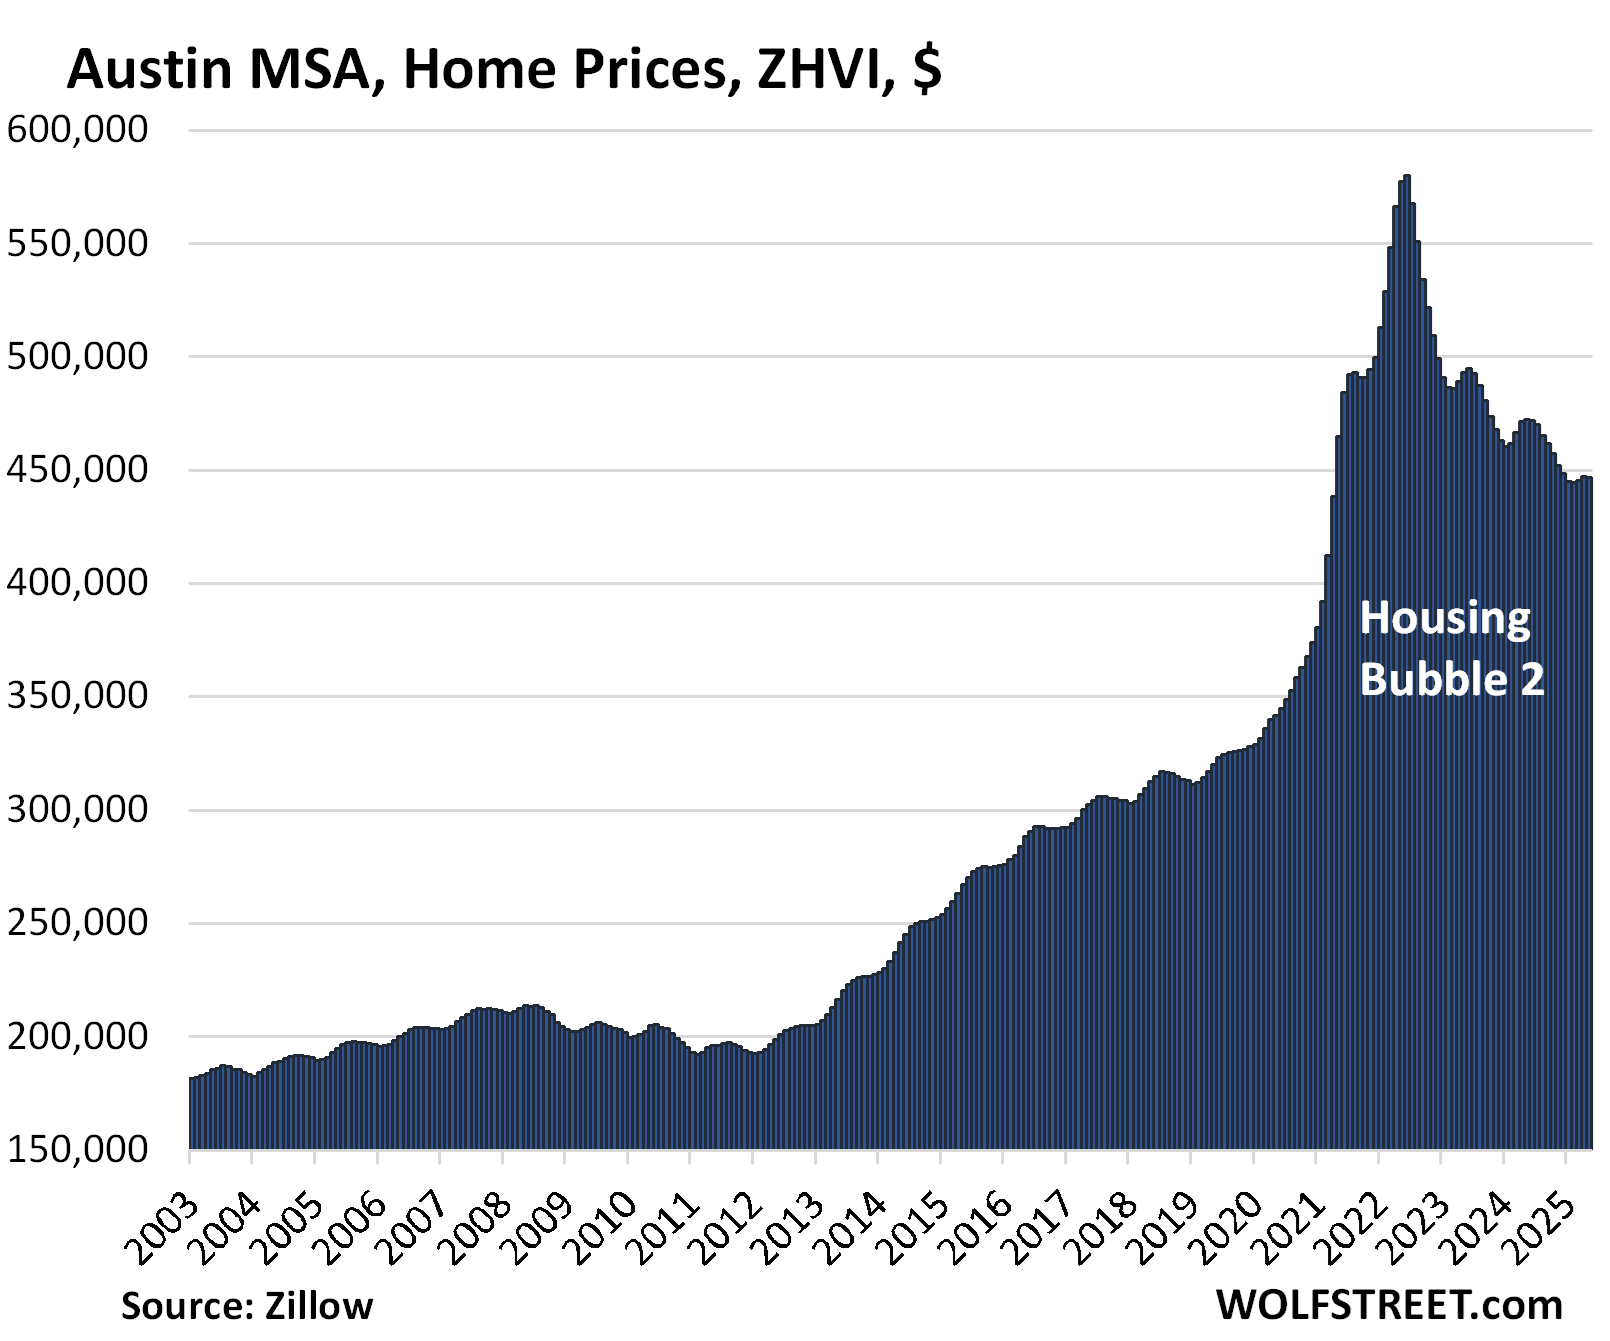
The Austin metro is ahead of other big metros in Texas and around the country: transaction prices, after exploding, have dropped already by 23% from the peak in June 2022 through May.
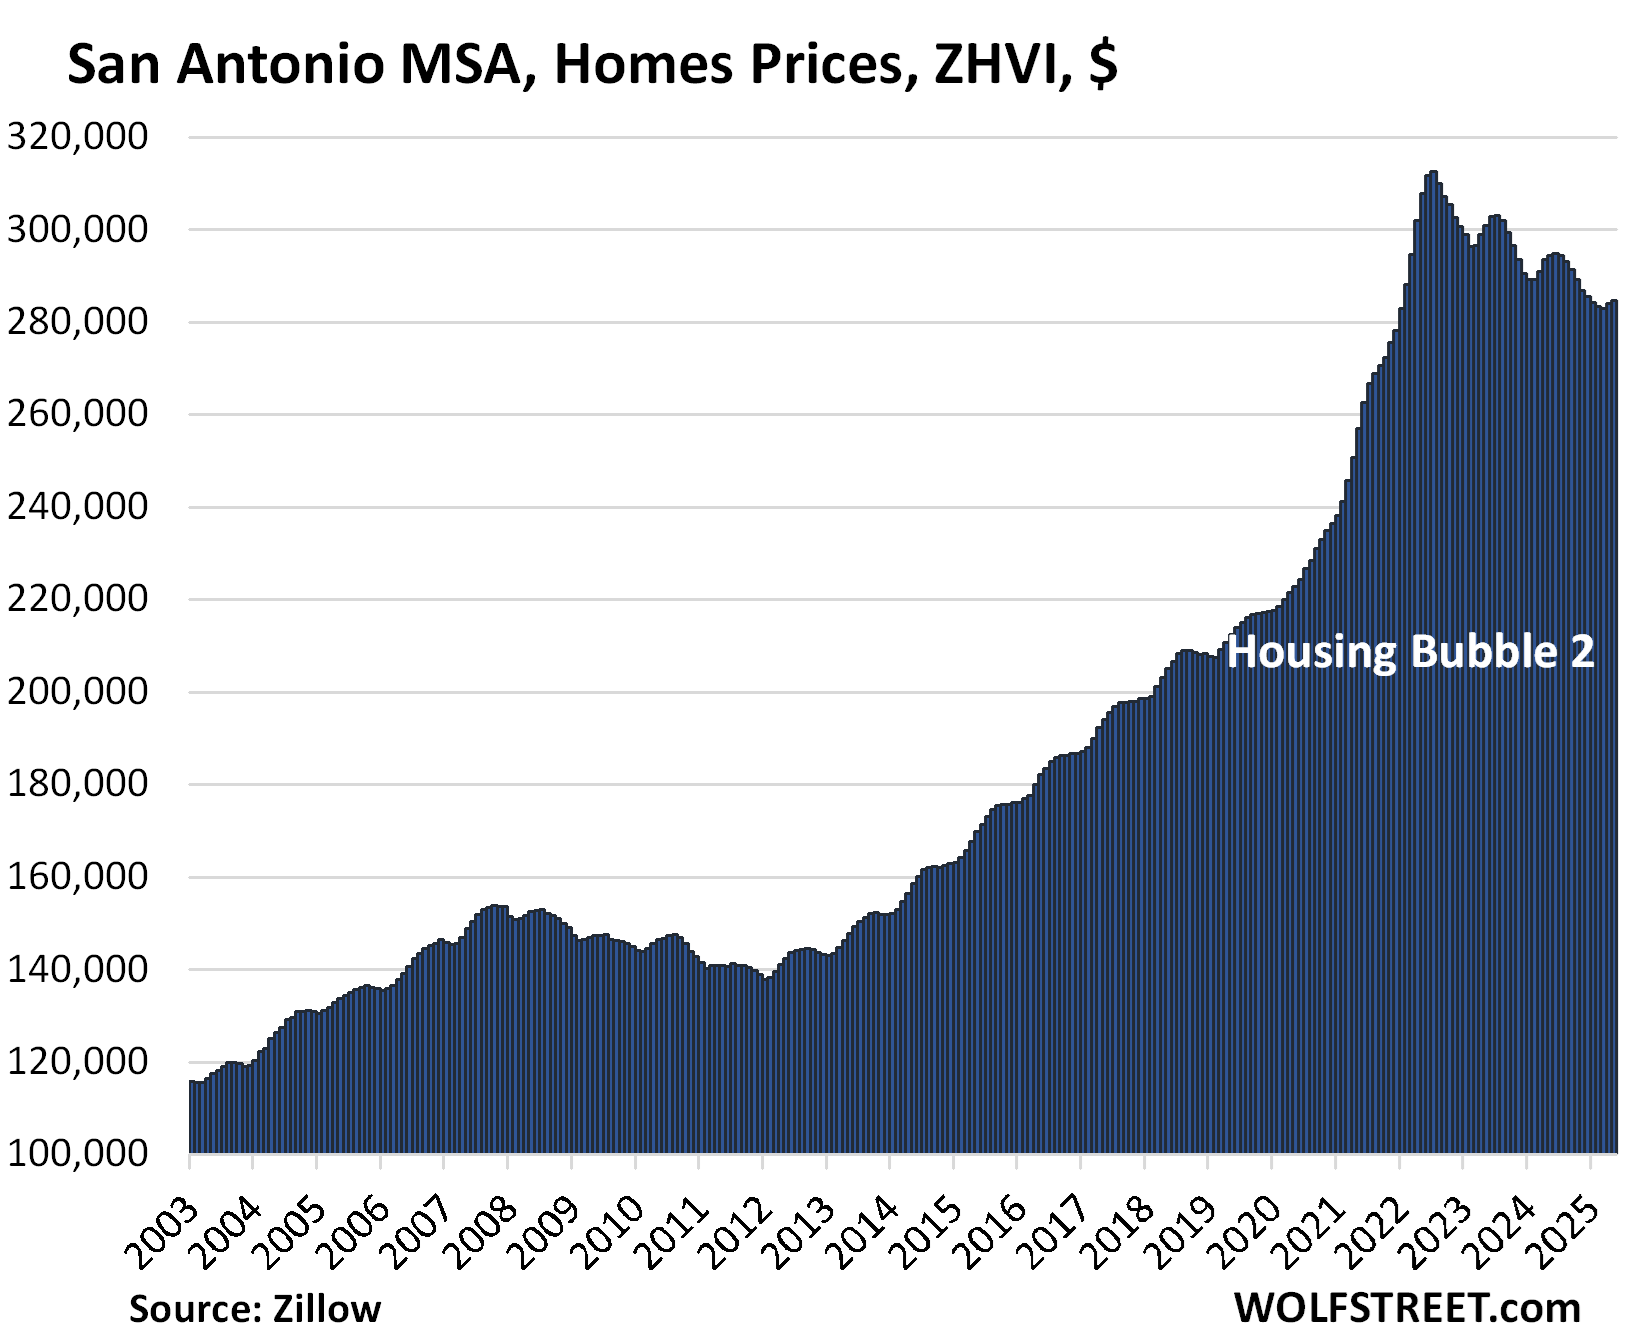
Housing price charts should never-ever look like this. That kind of price explosion as it occurred during the free-money era documents pure housing insanity triggered at the time by the government’s reckless fiscal policies and the Fed’s reckless interest rate repression through near-0% policy rates and massive QE even as inflation had begun to rage.
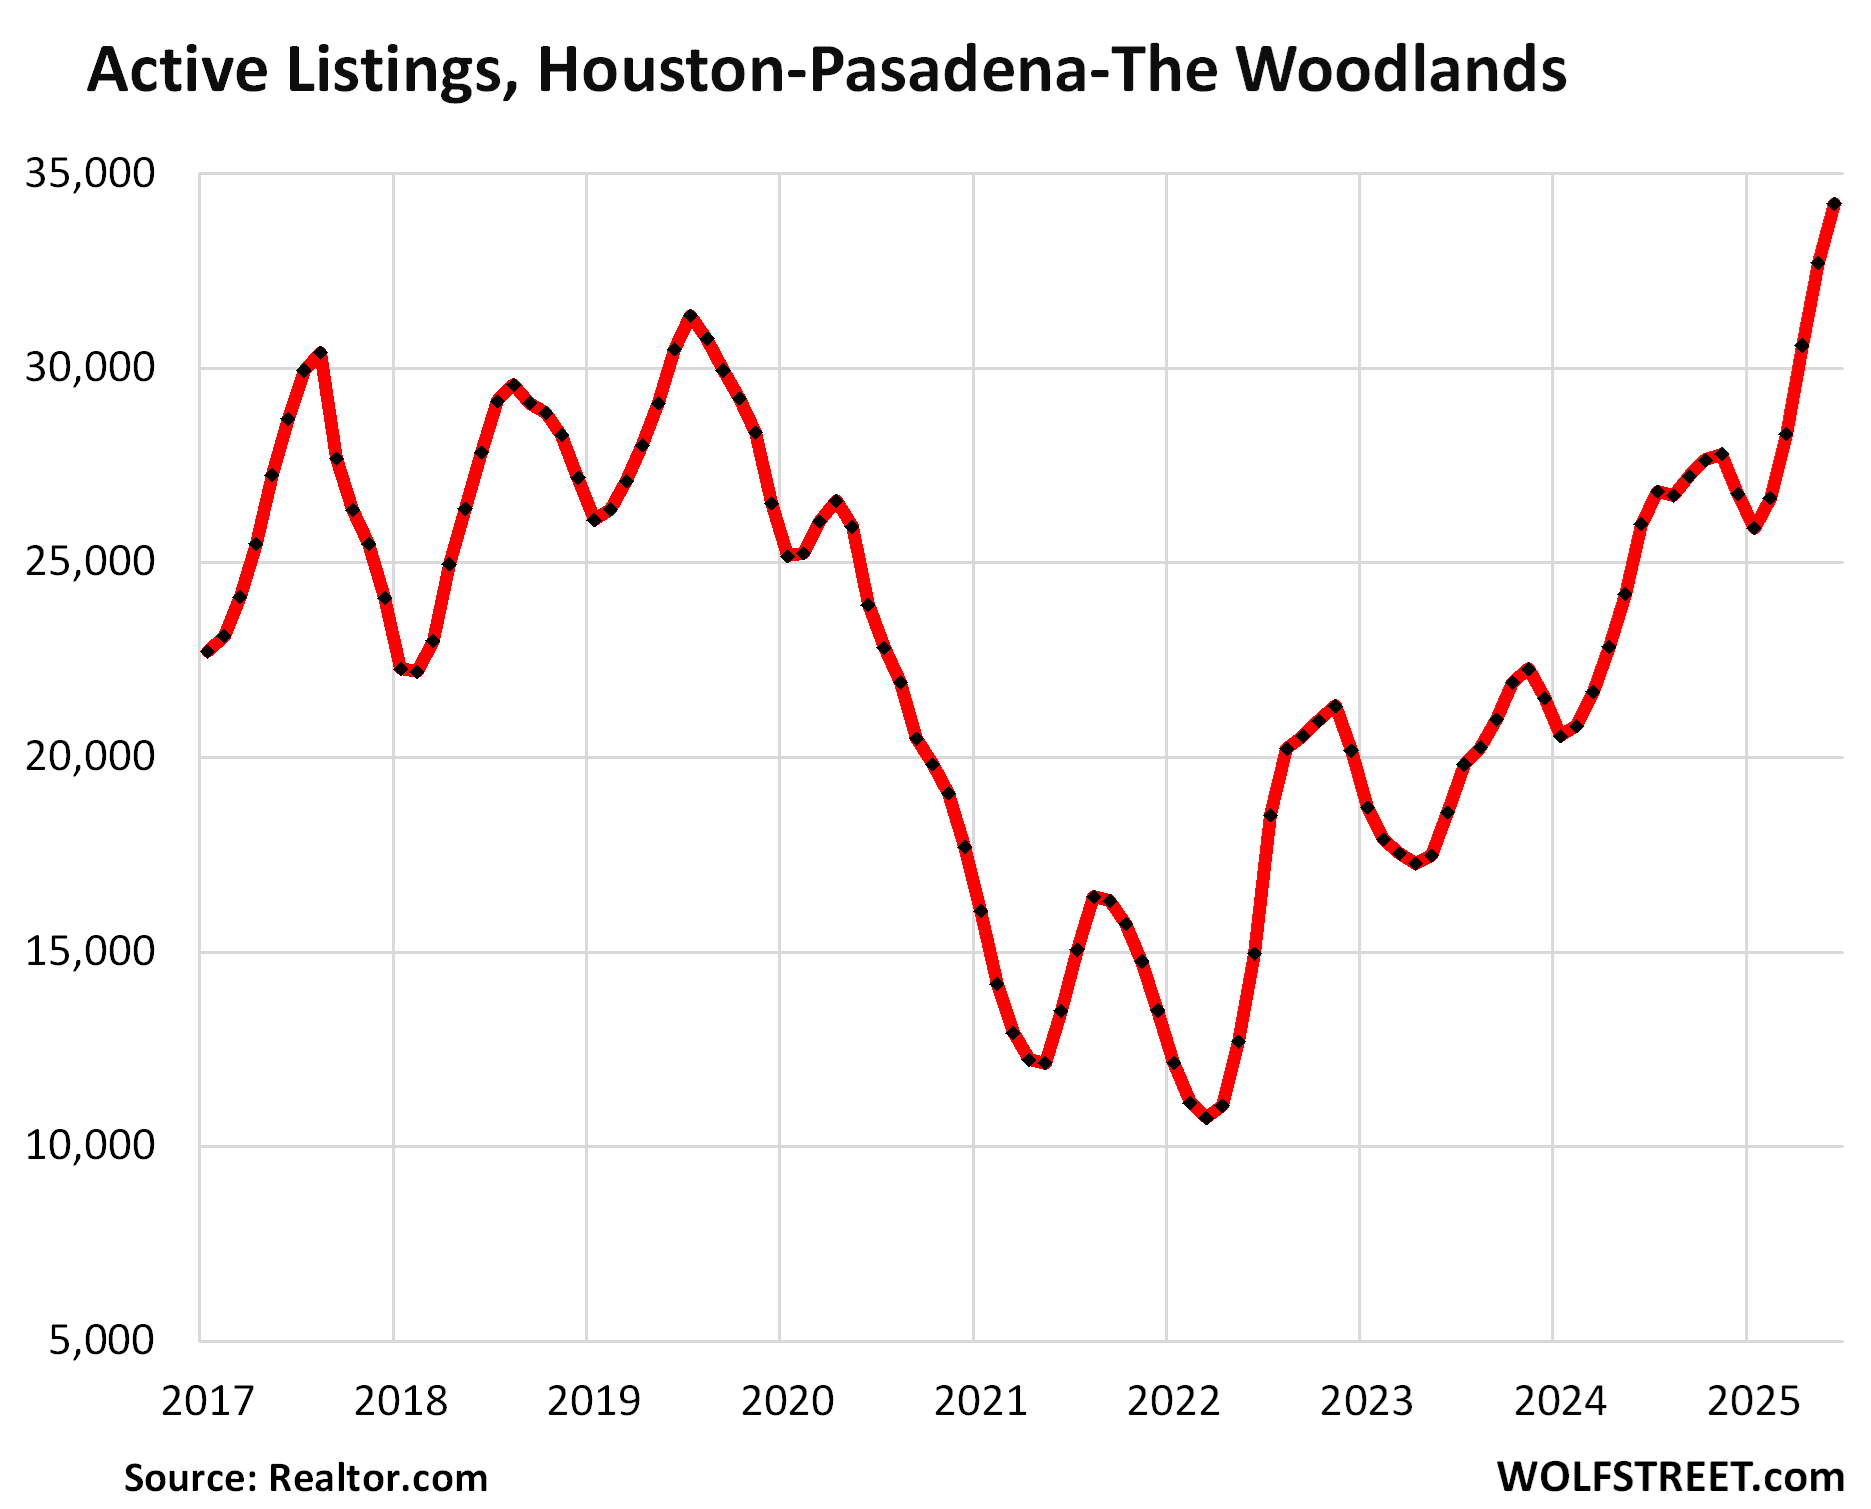
In the Houston-Pasadena-The Woodlands metro, active listings jumped by 32% year-over-year to 34,226 homes, the highest in the decade of data from realtor.com.
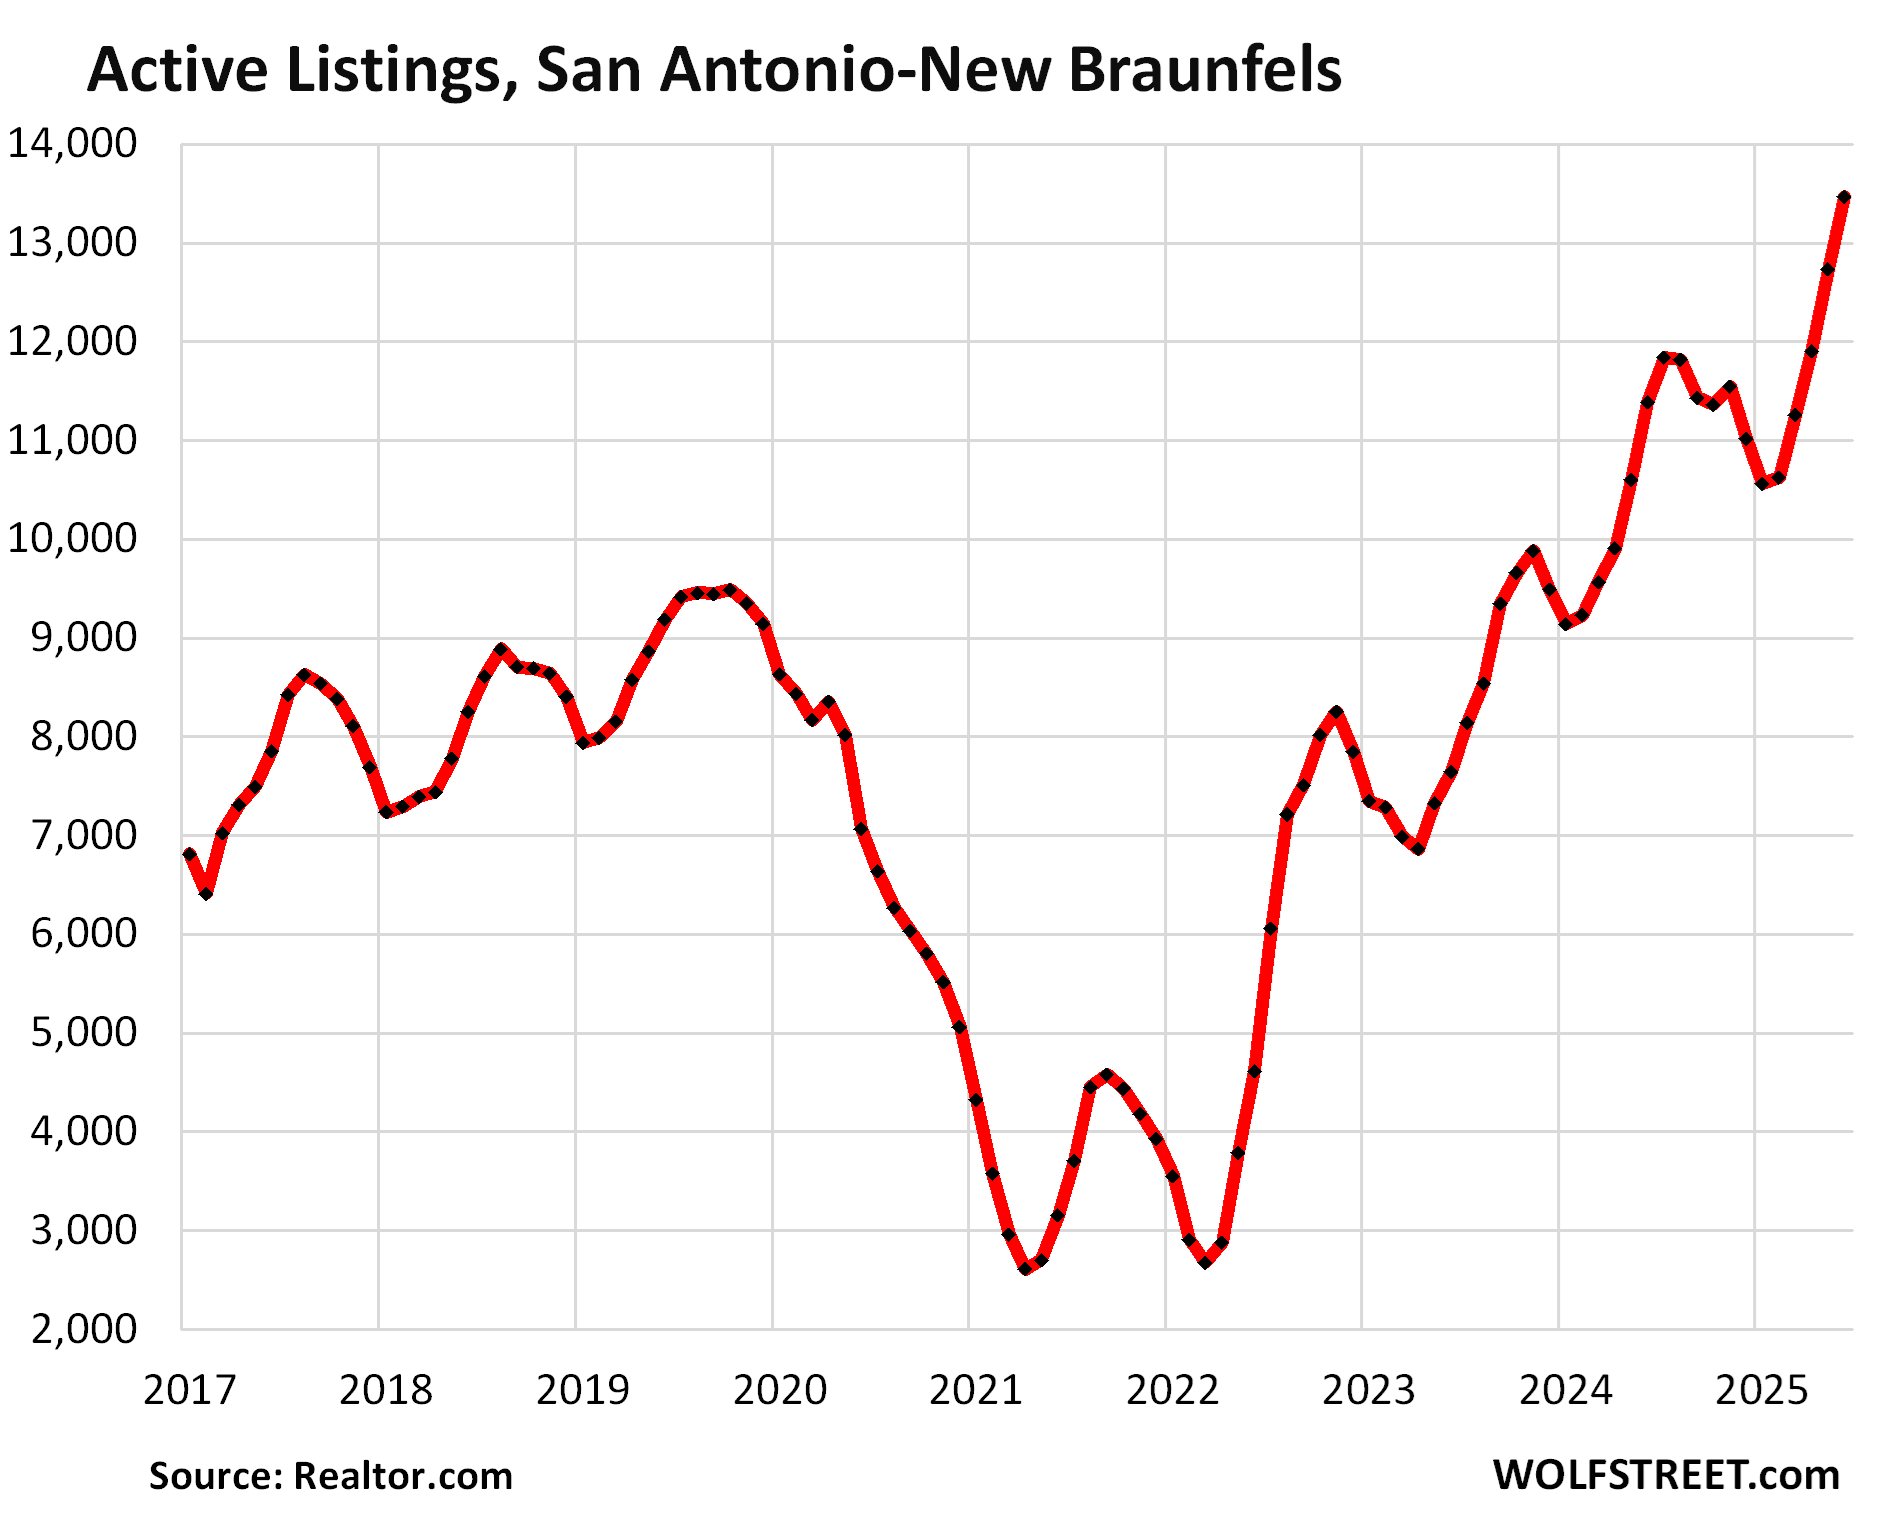
In the San Antonio-New Braunfels metro, active listings jumped by 18% from the already bloated levels a year ago that had already been at the time the highest in the decade of data from realtor.com.
Compared to June 2019, listings are up by 47%, compared to 2018 by 63%, compared to 2017 by 72%.
The decline in home prices has been slower in San Antonio than in Austin. Prices in the San Antonio metro have dropped so far by 9% from the peak in June 2022 through May:
Hangover time. All the government’s free money is gone. Student loans have to be paid back, and they’re accruing interest again, forbearance is over, and arrearages are starting to mess up credit ratings again. Mortgage rates have been back in the historically normal-ish range for three years. Inflation is still out there, ready to dish up another nasty surprise. And what this free money has left behind is a huge mountain of government debt that needs to be financed and refinanced, with more debt getting thrown on top of it every week, and all this is putting upward pressure on long-term interest rates and mortgage rates. Home prices are now way too high and they have destroyed demand, though there is plenty of demand at lower prices.
The distortions in the housing market over these years cannot just vanish overnight without a trace. They will take years to work out along a bumpy road. But it’s good to see these inventories on the market again.
Enjoy reading WOLF STREET and want to support it? You can donate. I appreciate it immensely. Click on the mug to find out how:

![]()
Re: Hangover time
What blows my mind, after all this stupid pandemic circus excess — is the background noise about home builders ramping up new construction — and sweeping away all these overhanging, problematic post-pandemic conditions.
The new construction Kool-aid guzzling and cheerleading zealotry may have worked out ok in the midst of pandemic chaos, but I don’t think builders are gonna find as many people chasing unaffordable unicorn dream homes — especially with existing inventory exploding weekly.
Maybe, there’s a trend, for people to want newer homes, versus 50 year old boxes, but I still can’t fathom there’s a huge supply of buyers lining up to pay top dollar… for either product.
I think the hangover is just starting.
More inventory is exactly what this overpriced market needs. We need homes for sale out the wazoo for years to come. Bring on the inventory, build baby build. Single-family, multi-family … all of it.
What does it take to understand how many homes we actually need. What combination of population growth projections and other factors should we look at to know what an ideal number of homes need to be built in the next 5 years in a given region?
Thank you Wolf 👍.
Really help to put things into perspective.
I wonder what LA, Orange County & San Diego will look like by the end of 2025.
What ALWAYS ticks me OFF about these housing price charts (nothing against the author!) is this: although there have been SOME price reductions, they are a very small fraction of what’s needed to return to normalcy and affordability. Texas home prices may be cheap compared to California prices, but how many working class Texans can afford to buy a house currently? Nationwide, there is a severe affordability crisis. High property taxes in Texas don’t help the situation there.
Many people forget the level of housing market devastation during the last housing bust. Overpaying for homes leads to affordability crises for many families as time goes on.
Money overpaid is savings delayed!
The price reductions matter only in that they show a state of mind. What really matters are selling prices. I post those a lot, chart after chart, including two in this article, one for Austin, where selling prices have dropped by 23%.
RTGDFA not just the headline
Back in 1991, I bought a house near San Antonio for $30,000. Nor was this unusual at that time. Almost anyone working could afford to buy a house and rents were comparably low. You hardly ever saw anyone who was homeless. That was a golden era never to be repeated again.
History does not repeat itself…
But it sure does rhyme!
The more this makes the news for the “cheaper” markets, the greater the probability buyers strike in the more expensive coastal areas.
My kid might be able to get a house in the PNW in a year (with dads help).