It also wrote down its €1 trillion in gold by €30 billion due to its price decline in euros in Q2.
By Wolf Richter for WOLF STREET.
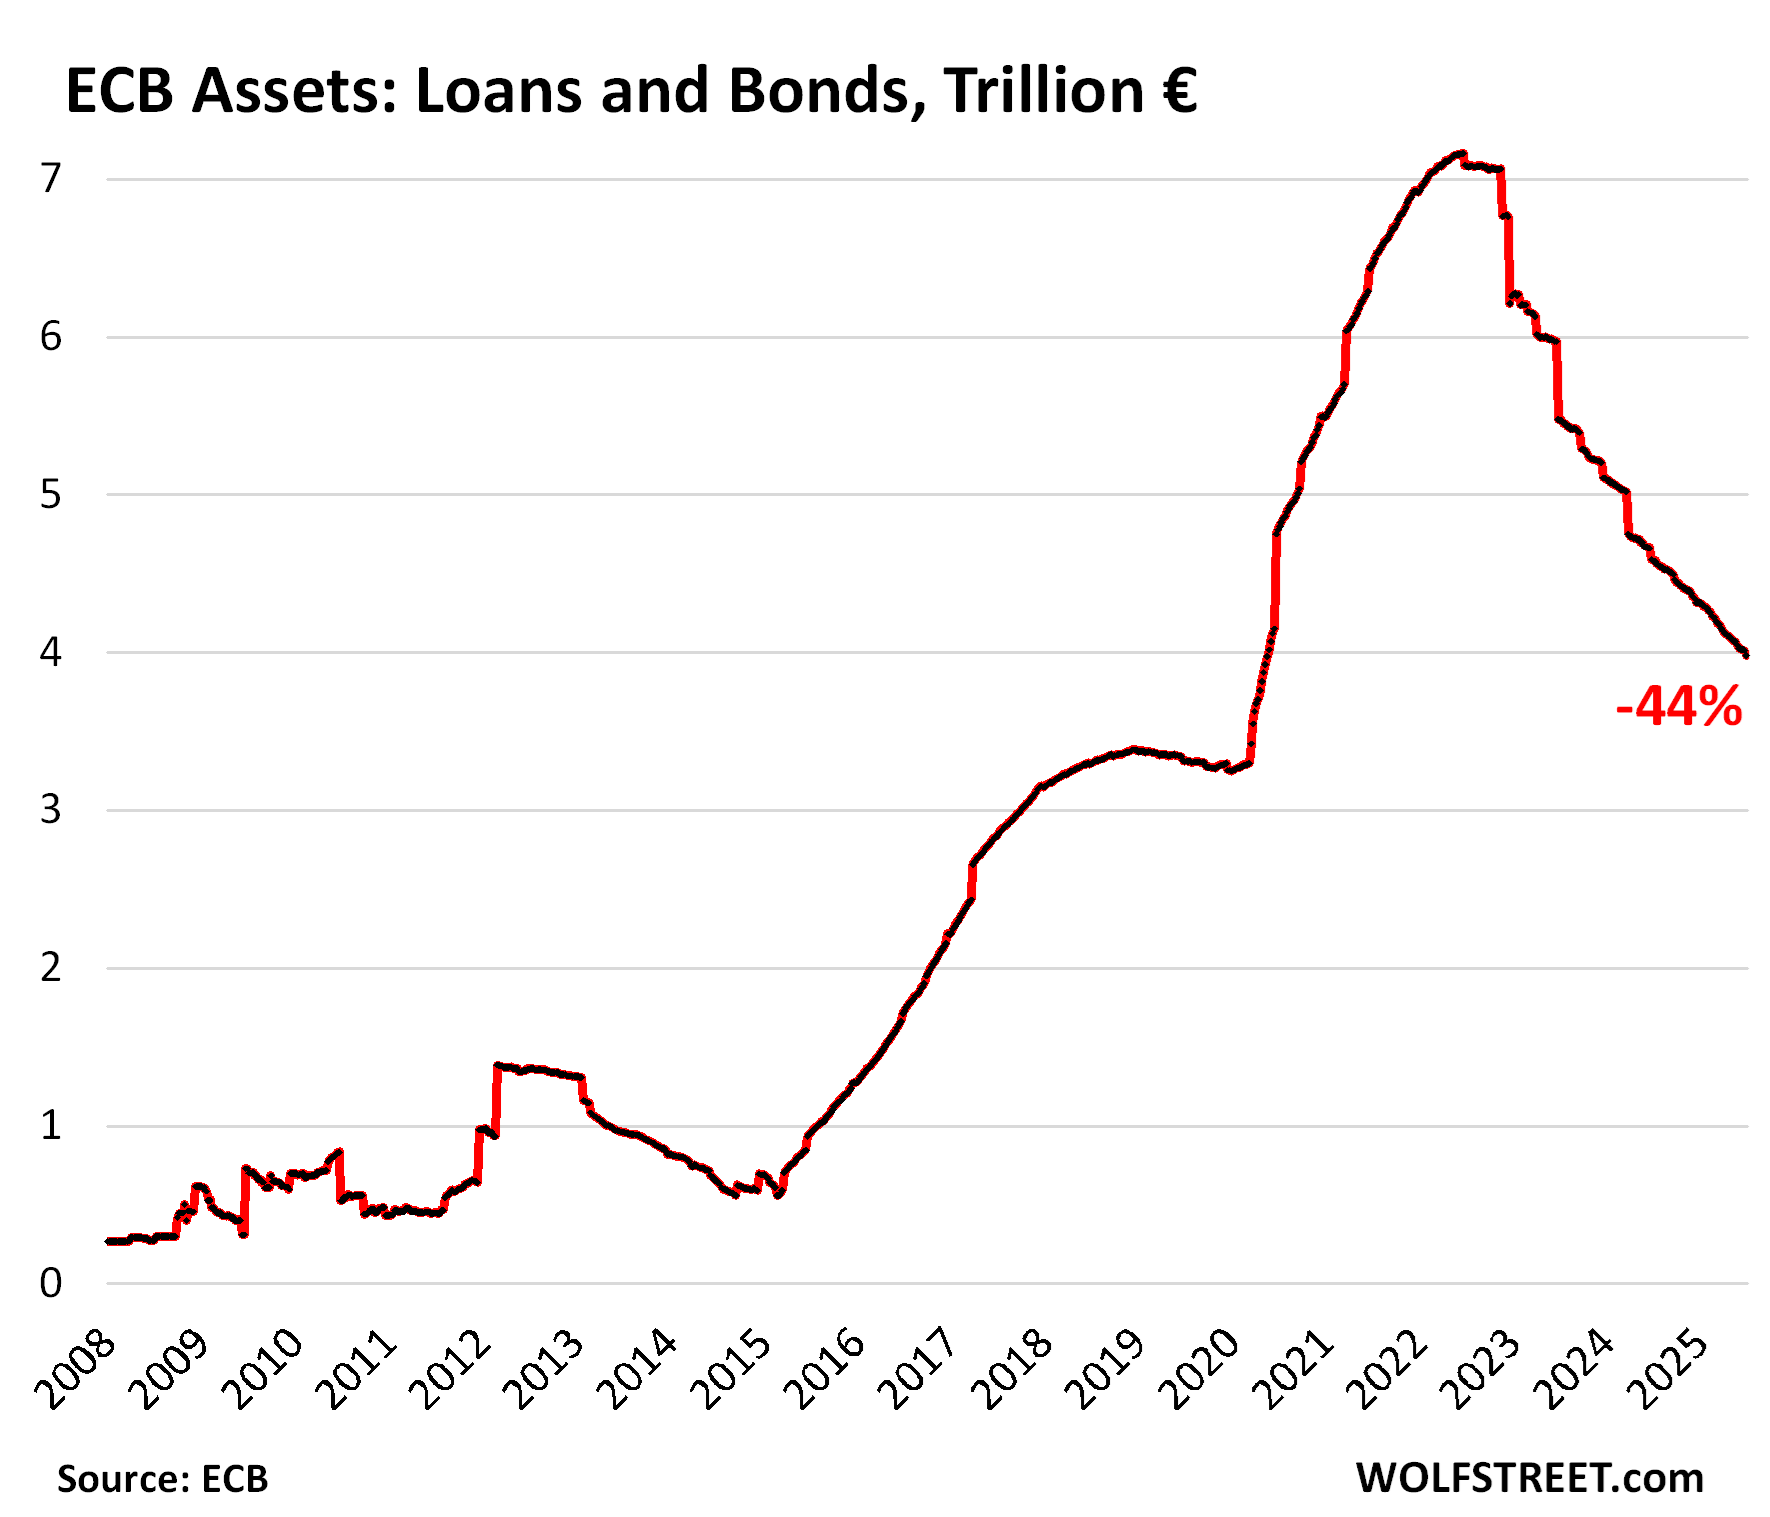
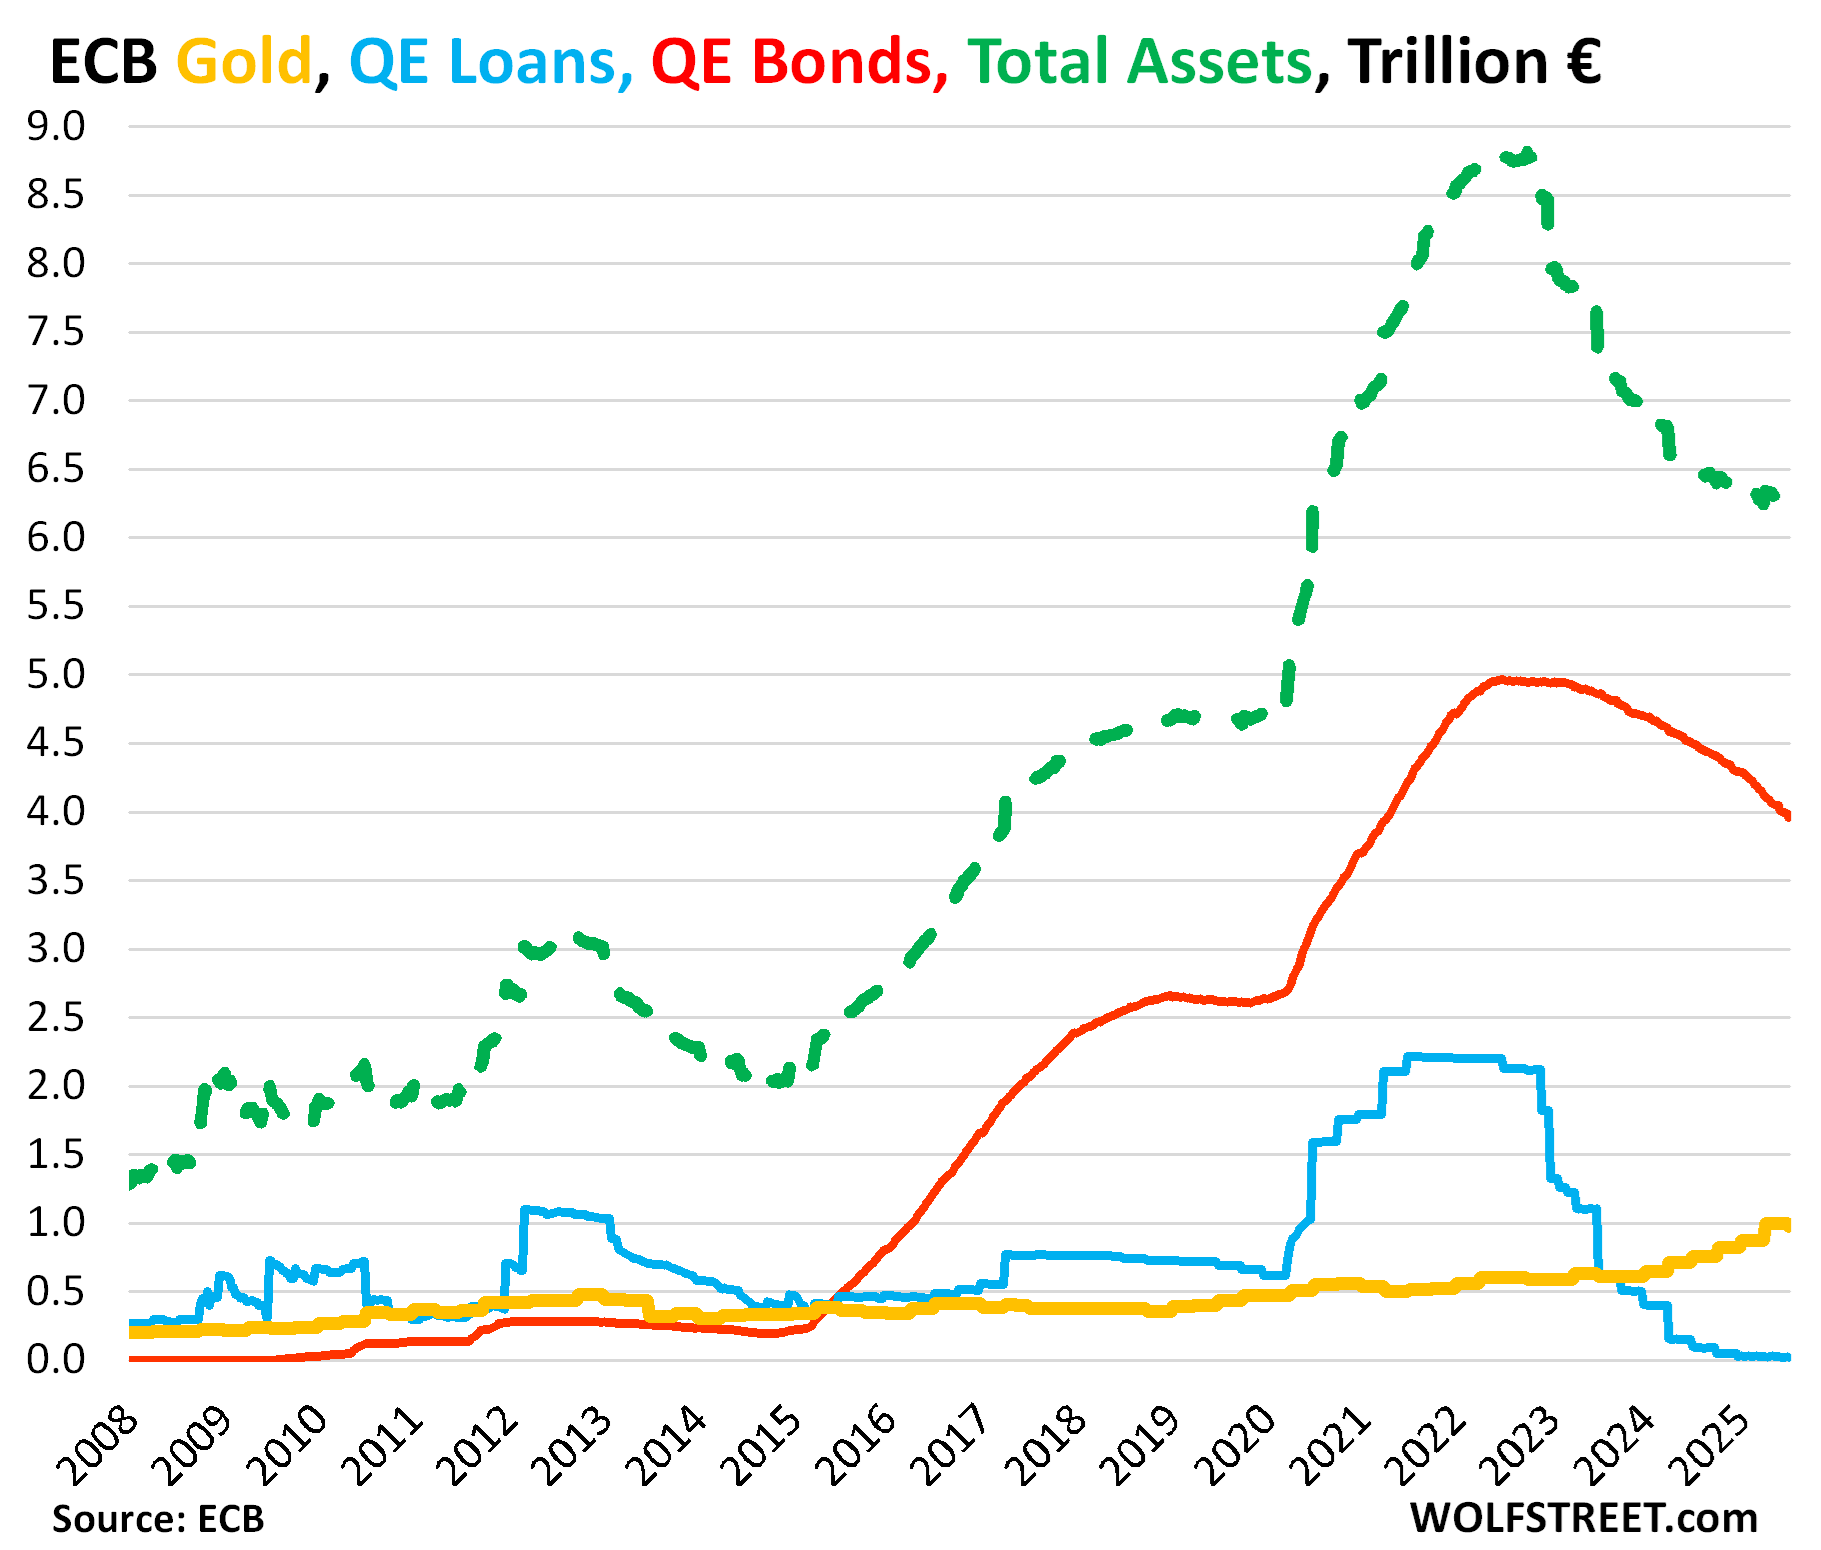
The ECB’s two big QE categories – loans to banks and bonds – declined by €64 billion in June, to €3.98 trillion combined, the lowest since June 2020, according to the ECB’s weekly balance sheet.
Since peak-balance sheet at the end of QE in June 2022, the ECB’s QT programs have shed €3.18 trillion ($3.72 trillion), or 44%, of its loans and bonds combined.
The ECB also has non-QE assets on its balance sheet, including close to €1 trillion in gold, which it adjusts to market value on a quarterly basis. The Q2 adjustment came on the current balance sheet: the first write-down in nearly two years (-€30 billion), after €600 billion in write-ups due to the market price of gold in euros.
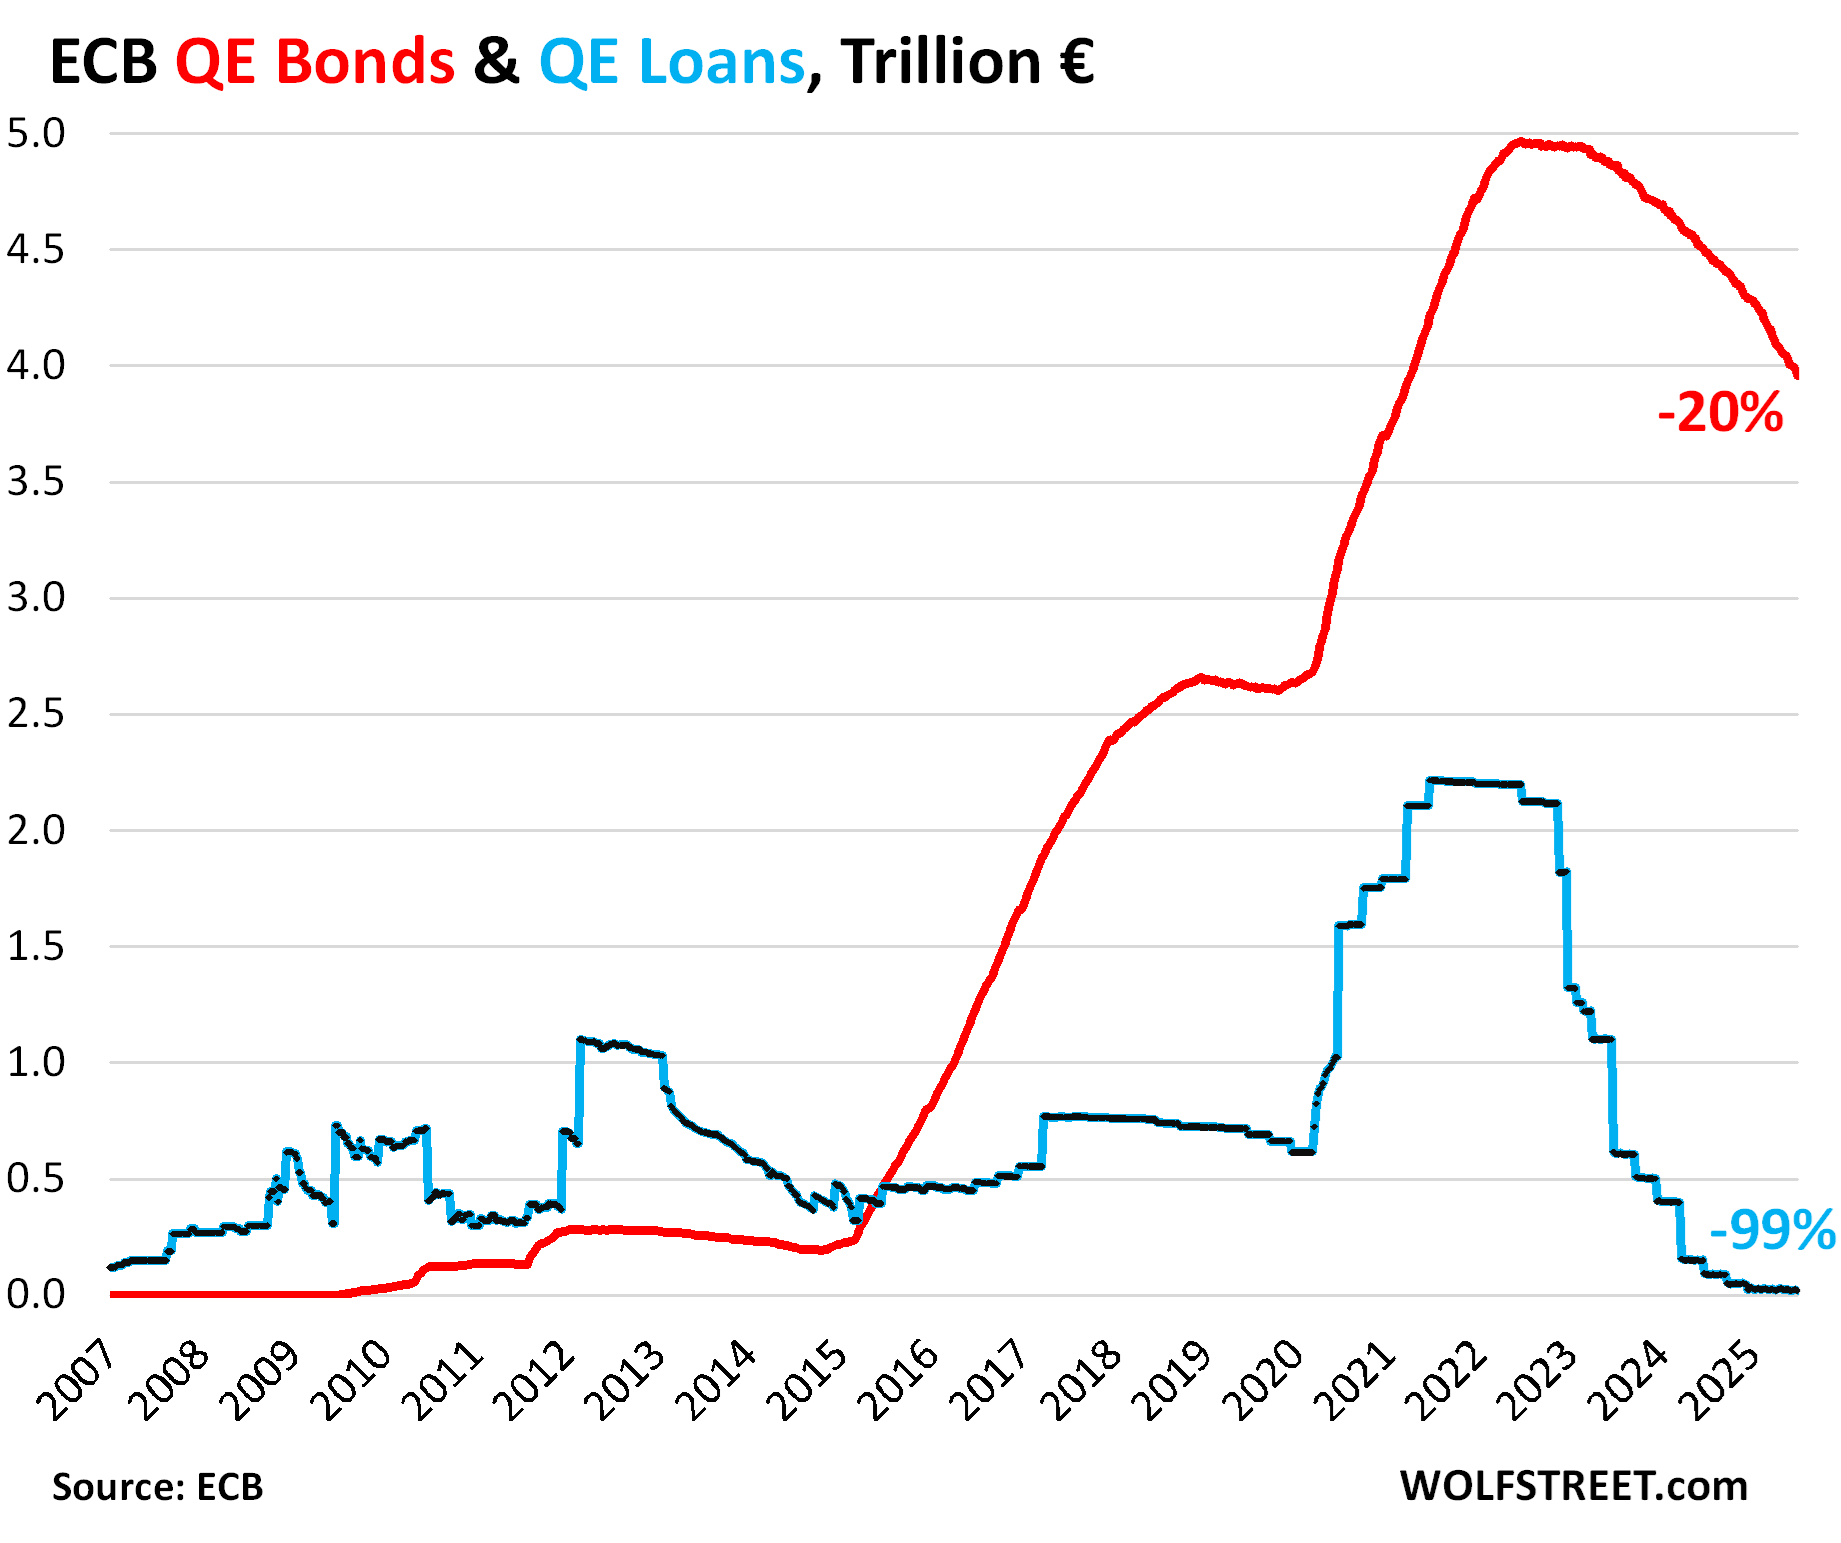
Loans to banks: -€5 billion in June, -€2.18 trillion, or -99% from the peak in June 2021; only €20 billion remain, the lowest in the ECB’s data going back to 1999 (blue in the chart below).
Bonds: -€60 billion in June, -€1.0 trillion, or -20%, since the peak, to €3.96 trillion, the lowest since April 2021. This year, the bond roll-off has averaged €55 billion per month (red in the chart below).
In December 2024, the ECB stepped away from the bond market entirely by removing the last remaining cap on the monthly roll-off. Since then, it has not replaced maturing bonds, and whatever matures comes off the balance sheet. These amounts vary from month to month.
Its bond holdings are mostly government securities but also include some private-sector securities.
Gold holdings written down due to price drop in euros.
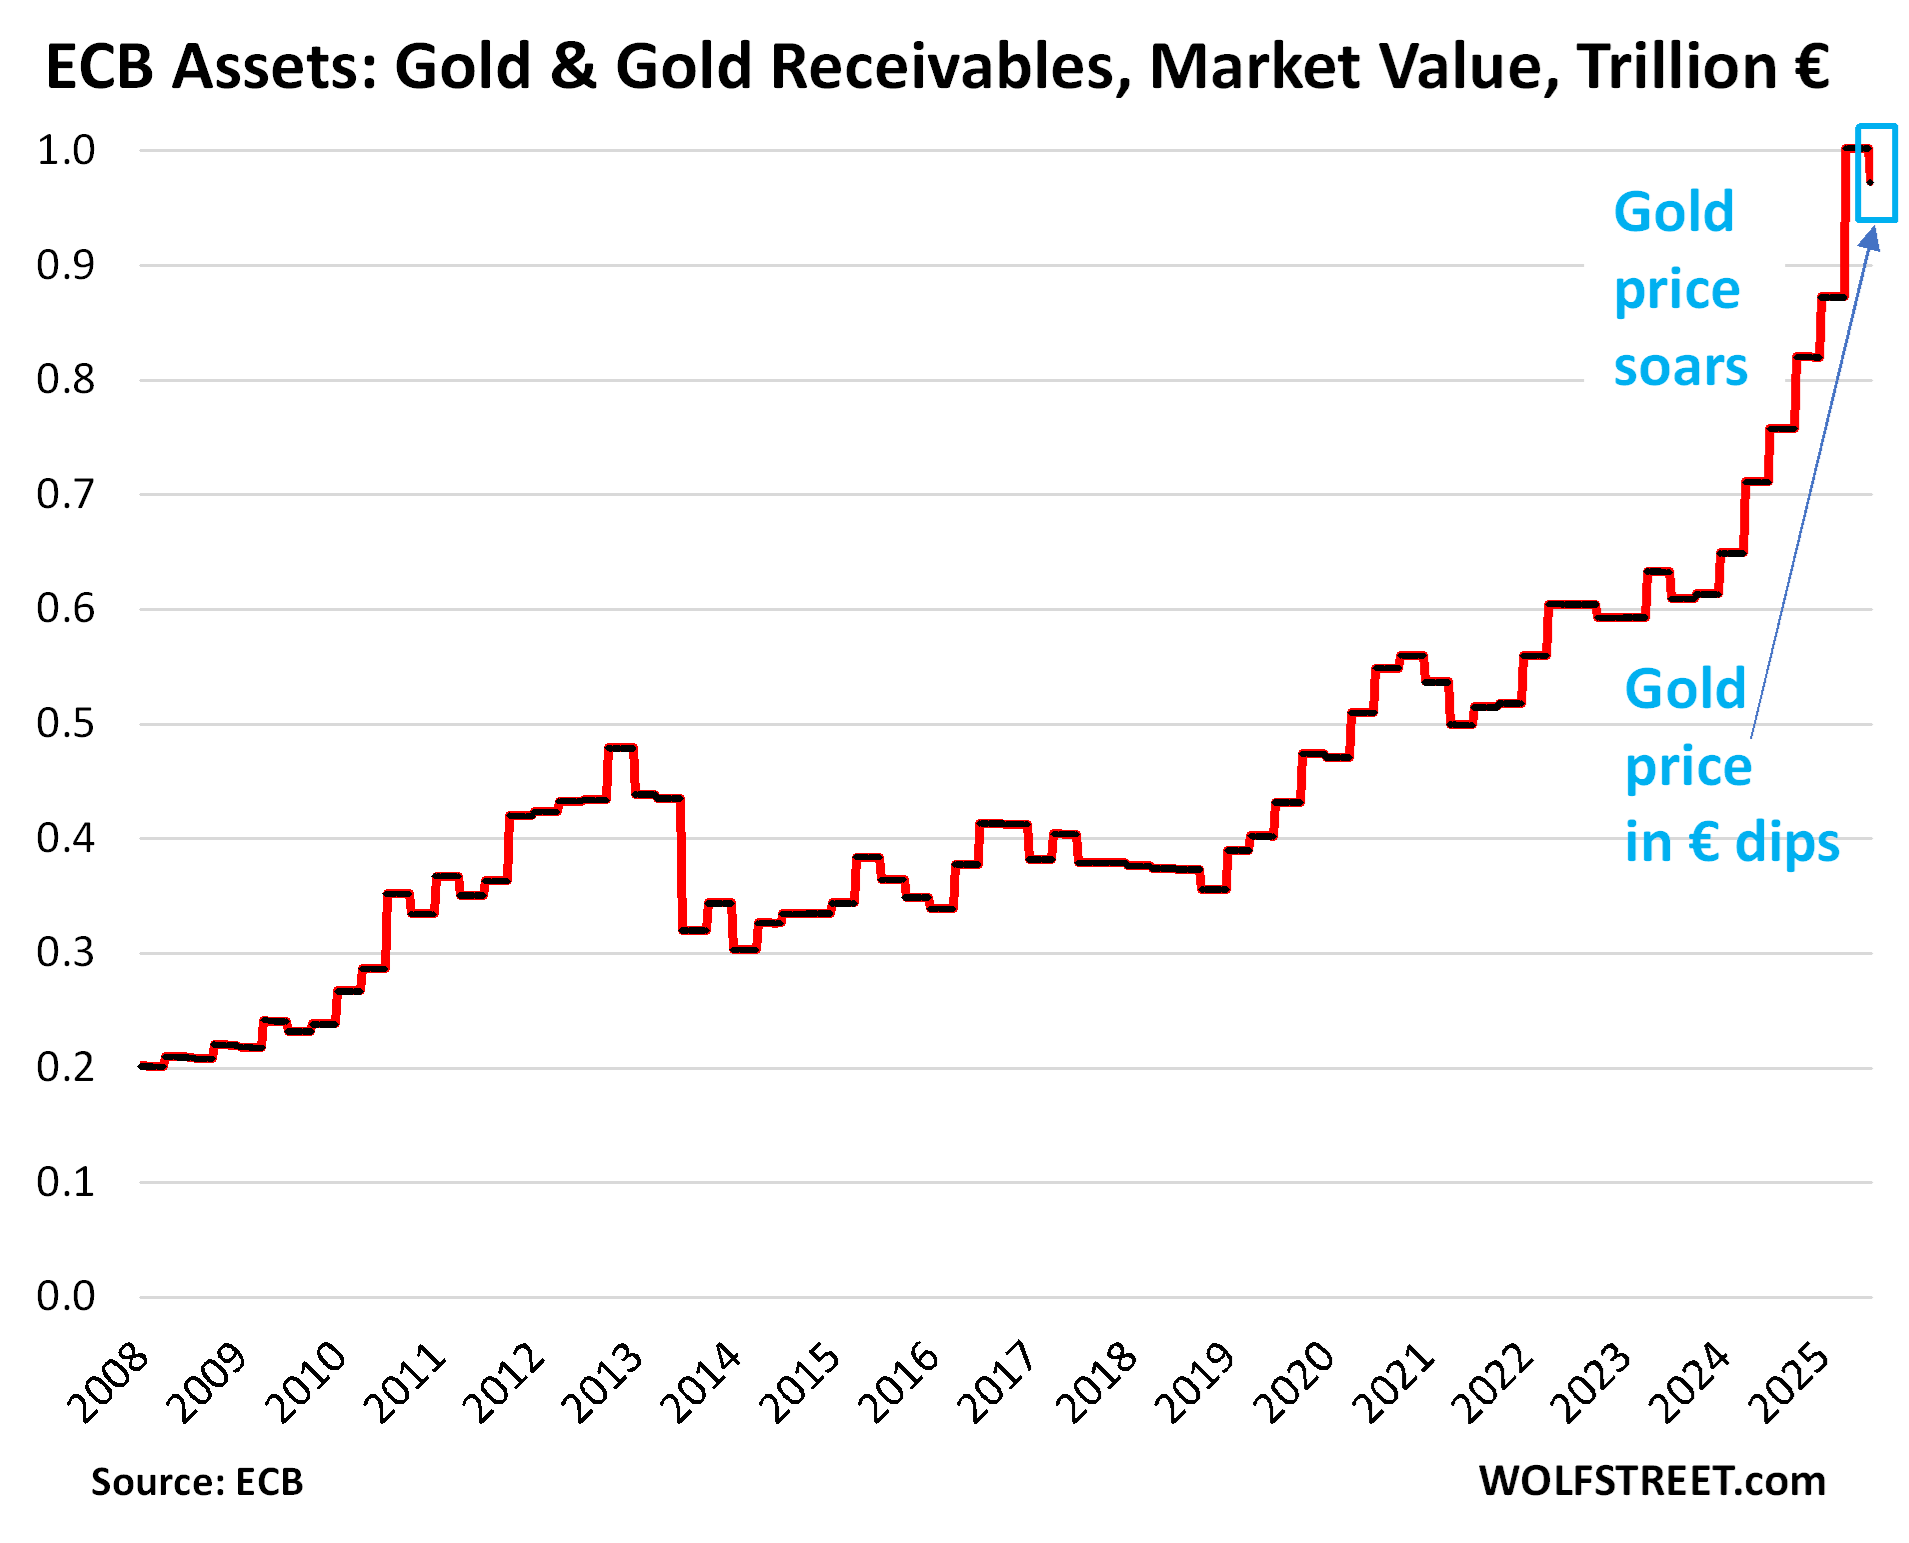
The ECB values its holdings of “gold and gold receivables” at market prices in euros. Every quarter, it adjusts its holdings to market value. Its current weekly balance sheet revealed the Q2 mark-to-market adjustments – this time a downward adjustment.
As the price of gold (priced in euros) started surging in 2019, the ECB wrote up its gold holdings. From mid-2019 through Q1 2025, the ECB wrote up its gold holdings by 149% or by €600 billion, to €1.0 trillion.
But in Q2, the price of gold in euros fell, and the ECB wrote down its holdings by €30 billion, on the current weekly balance sheet.
Mark-to-market adjustments of its gold holdings are just paper adjustments at the end of the quarter and do not involve purchases or sales or money printing or QE or QT.
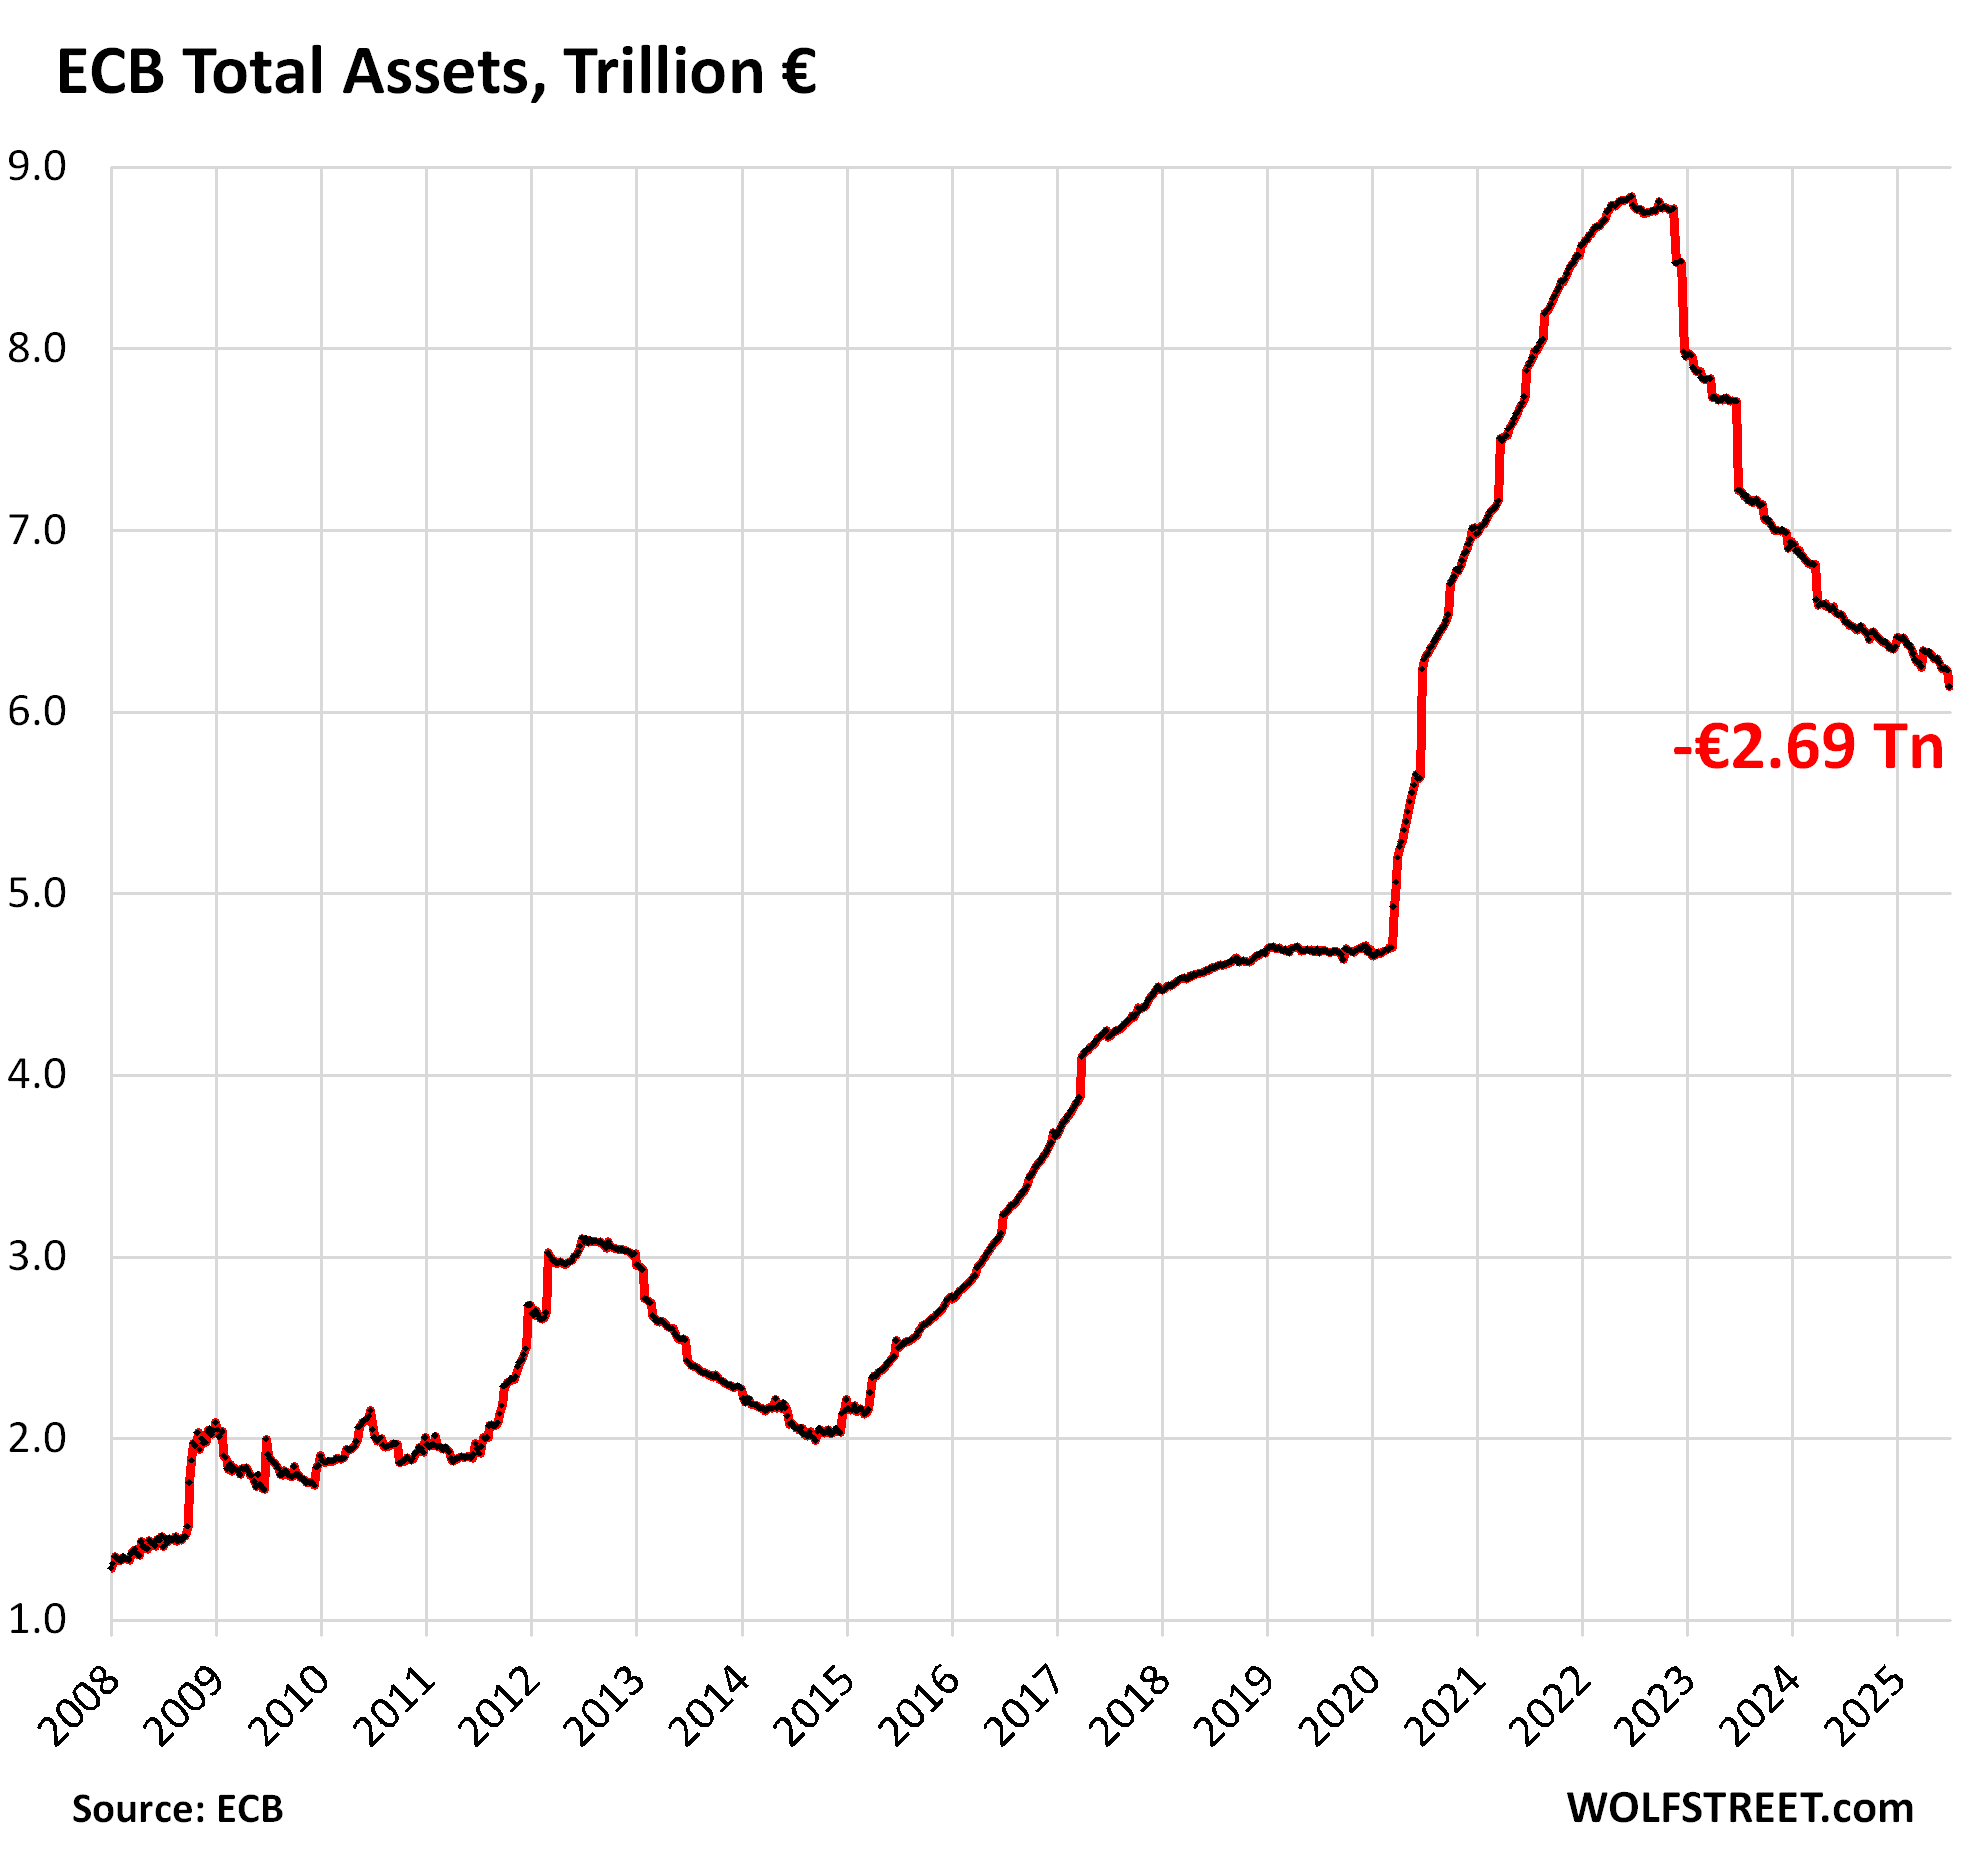
These mark-to-market adjustments of its gold holdings are why total assets have declined by less than the QT assets since the beginning of QT. Total assets declined by $2.69 trillion ($3.15 trillion), or 30%, to $6.14 trillion, the lowest since June 2020.
Conversely, in June, the €30 billion write-down of gold at the end of Q2 increased the drop of the ECB’s total assets to €101 billion.
The chart below shows the ECB’s holdings of gold (yellow), loans (blue), bonds (red), and total assets (dotted green line):
The ECB is way ahead of the Fed, which has shed $2.31 trillion under its QT program. And the Bank of Japan has accelerated its QT this year, but is two years behind the Fed and the ECB. Smaller central banks, including the Bank of Canada, have also substantially reduced their balance sheets.
Enjoy reading WOLF STREET and want to support it? You can donate. I appreciate it immensely. Click on the mug to find out how:

![]()
I wonder where the ECB’s gold is being stored? Is it at the central banks of the member countries or are they still letting The Federal Reserve still hold some?
Inquiring minds and such…
I don’t know about the other member central banks, but about 50% of the Bundesbank’s gold is stored in Frankfurt, the rest in NY (ca. 36%), London, and Paris.
Chuckle… Frankfurt… pretty much as far from the Russian border as you can get and still be in a major German city. Easy access to France and/or Switzerland if the gold needs to be moved in a hurry.
I fail to see the “wisdom” in “holding” a physical asset such as gold in a foreign country (far over seas?). I understand the financial importance of NYC, and the entire world witnessed several bouts of financial warfare in the past half decade.
Sanctions on oligarchs are the obvious one, the money printing (as a result of a health emergency?) is included IMO, not to mention weapons supplies, shipping lanes and various other acts buried on the “second page” headlines.
I guess it’s similar to having a crypto “asset” stored on an “exchange” like FTX or Binance or any other (or valuing crypto at over $3 trillion in general).
Of course, the fearless leader of the USA wouldn’t break alliances over a pithy matter.
At peak central bank balance sheets holdings, what was the total outstanding aggregate combined of all the central banks? I read 27 trillion…so, they juiced asset prices by that amount since that money flows thru business P&L,s mostly, then over 15 years, just in USA added 25 trillion in new official debt…okay. That magic is over as they can’t do it again at this pace…
Funny how printing $10 Trillion equivalent (across Fed and ECB) causes prices in the West to skyrocket, but un-printing $5.2 Trillion equivalent of the funny money doesn’t trigger a proportional reduction in prices.
Look at Wolf’s incredible chart of corporate profit explosion 2021-present for a hint at what might be going on here.
There is an economic reality that prices are “sticky”. Same for wages.
These massive balance sheet increases were coordinated be Fed, EU, and other central banks to stave off deflation, largely.
However, I believe the entire COVID money print was a Fed move to juice inflation. And it worked.
Remember, during COVID, money was put in people’s hands directly. And lots of it. This is very different than QE, where the new money goes to higher economic intermediaries such as banks, who may or may not push this directly into the economy as new money.
The inflationary impulse that the Fed engineered is still playing out, so the big central banks are reigning in alot of this QE money to clamp down on inflation they engineered.
We all realize I hope, that the Powell/Yelen tean successfully raised the general price structure by around 30% over the last few years. This move bought additional room with the debt situation. How much room/time remains to be seen.
Somewhat related to QT going forward, CPI for ECB 2026 estimate at 1.6%, while USA CPI 2026 is estimated at 3.2% — but, the tariff impacts are unknown everywhere, but lots of moving parts with QT, currencies and rates, etc.
This goulash of volatility makes shopping for international diversity very puzzling — but, kinda looking at
International High Dividend Yield ETF stuff — how QT will interact in this, is definitely not clear.
I’m interested in knowing what this means for the M2 global money supply. Some say it is a forward indicator of the price of Bitcoin. Curious to know your thoughts.
M2 was long ago abandoned as an relevant indicator of money supply as it is very poorly defined and far from being any sort of accurate measurement for anything. As to BitCON that is nothing but a preposterous bogus Ponzi Scheme speculative fraud and nothing more.
NBC: Trump says he will hit Canadian imports with a 35% tariff in major escalation of trade war
Canada is one of the United States’ top trading partners, with more than $410 billion of goods crossing into the country last year.
The US has a goods deficit with Canada of $63 billion. For example, these Canada-produced vehicles are currently exported to the United States. Why?
Chrysler 300
Chrysler Pacifica
Dodge Charger
Dodge Challenger
Dodge Grand Caravan
Ford Edge
Ford Flex
Lincoln MKT
Lincoln MKX (Nautilus)
Chevrolet Equinox
Cadillac XTS
GMC Sierra
Honda Civic
Honda CRV
Toyota Corolla
Toyota RAV 4
Lexus RX
Why are they made in Canada, not in the US?
Why?
Apparently deep in the bowels of trade agreements, a motivating dynamic driving the supply chain efficiencies for car production, and stuff, is the cost of health care, added into the final cost of a car sales price.
That’s a multi decade problem, with a higher amount of healthcare benefit costs, ending up as a game changer for manufacturers, who can increase profit margins, by using countries with cheaper labor.
Obviously a complex bunch of layers with unions, currencies, healthcare cost differences and long established trade deals that negotiate all kinds of variables.
“health expenditure accounted for 17.6% of GDP in 2023. Projections indicate this share is expected to reach 20.3% by 2033.”
As to the why, the commie socialist Canadian healthcare system allows them to have a healthy workforce, that can build cars a bit cheaper, which reduces car costs,
Building cars in America with higher healthcare costs spills over into more expensive car prices.
???? It’s a theory.
The “why” was a rhetorical question. We all know why: shooting for big fat profit margins. Labor is a lot cheaper in Canada, Mexico, China, and Korea than in the US. Offshoring production fattens up profit margins. And the tax code further encourages it because it allows US companies to take the profits in other low-tax countries even of products sold in the US. Tariffs are going to change the math — and if companies still import, well then, they’ll finally pay some corporate taxes in the US.
Why US counts only “goods” deficits?
If you look on services as well (software, e.g. Microsoft), there won’t be a deficit.
Do you think other countries will add additional tarrifs on US services as a response?
1. Services exports are BS. They do very little for the US, unlike manufacturing. A big part of services exports is foreign tourists spending money in the US. That is a very low-level economic activity. In terms of IP sales (Microsoft, Disney, etc.) — they already made those products for US sales, and their overseas sales add nearly no new jobs and no new activity in the US. It just adds profits to these companies.
2. The services surplus that US has is MINUSCULE, compared to the goods deficit, and therefore the overall trade deficit in goods and services is HUGE. So this is the goods and services deficit (“net exports” used in GDP calculation) adjusted for inflation.
Do we assume that huge spike in 2025 so far is attempts to front-run tariffs? I remember, for example, that part of that spike came from gold imports in Q1 (which were so big they broke the Atlanta Fed’s GDPNow tool).
Yes, there was a lot of front-running (but gold imports aren’t counted for this, which is why the GDPNow model, which counted gold imports, broke).
We already know some of the Q2 trade figures, and the deficit has shrunk by a lot, but it’s still a gigantic deficit.
The tariffs are encouraging companies to move production to the US, but it takes time, years, to build or expand factories. This is a long-term project and may not be instantly visible in a big way.
How much new debt has the Treasury issued since the OBBA was signed ?
Thanks
They’re trickling it out slowly, in T-bills, over the next many months. The TGA wasn’t depleted, so there’s cash left to take time. It’s going to be a slow steady stream of new short-term debt, think of the Lower Mississippi River.
This makes sense. I was expecting a big shakeup in the bond market (the 10 year being the one I look at more frequently).
The MOVE index is at a 5- year low. The ICE BoA high yield spread is below 3% (low), the 10- year yield does seem to have an upward tilt, not wanting to be below 4.4%.
The 3-month yield is marked by certain daily spikes. I don’t know enough to understand if these are auction days or what’s going on. It’s currently charting below the 10-year, but has spiked above it.
Note to self: “One Big Beautiful Bill Act” (OBBBA) is a name I had not heard for the Trump so-called Big Beautiful Bill that was signed on 2025-07-04.
Also a bit funny if one called Trump/BBB just BBB, because that acronym was also used for the Biden-era “Build Back Better” bill, call it Biden/BBB?
The problem with OBBBA as an acronym, is that it sounds a little too much like Obama-something.
Pls fix typo in headline: $3.98 Trillion should be EURO.
Good lordy, I though I’d read that headline a million times. Thanks