Austin, Oakland, New Orleans, San Francisco, Washington D.C., Denver, Portland, Phoenix, Fort Worth, San Antonio.
By Wolf Richter for WOLF STREET.
There are different housing market dynamics among big cities in terms of mid-tier single-family homes: Some big cities have been showing price declines for some time, and in 10 of them, the price declines have turned more serious, seasonally adjusted, after the gigantic price explosion over the prior few years. But other big cities show continued price increases; or flat prices around the high; or the first declines after big surges.
Five of these big cities had double-digit price declines from their peaks in mid-2022 through May, two of which over 20%, seasonally adjusted. Other cities had similar price declines of mid-tier single-family homes, such as Birmingham, AL (-14%). But the cities are too small to qualify for this big-city list. Five more big cities had price declines of around 8% to 9% from their peaks in mid-2022 through May:
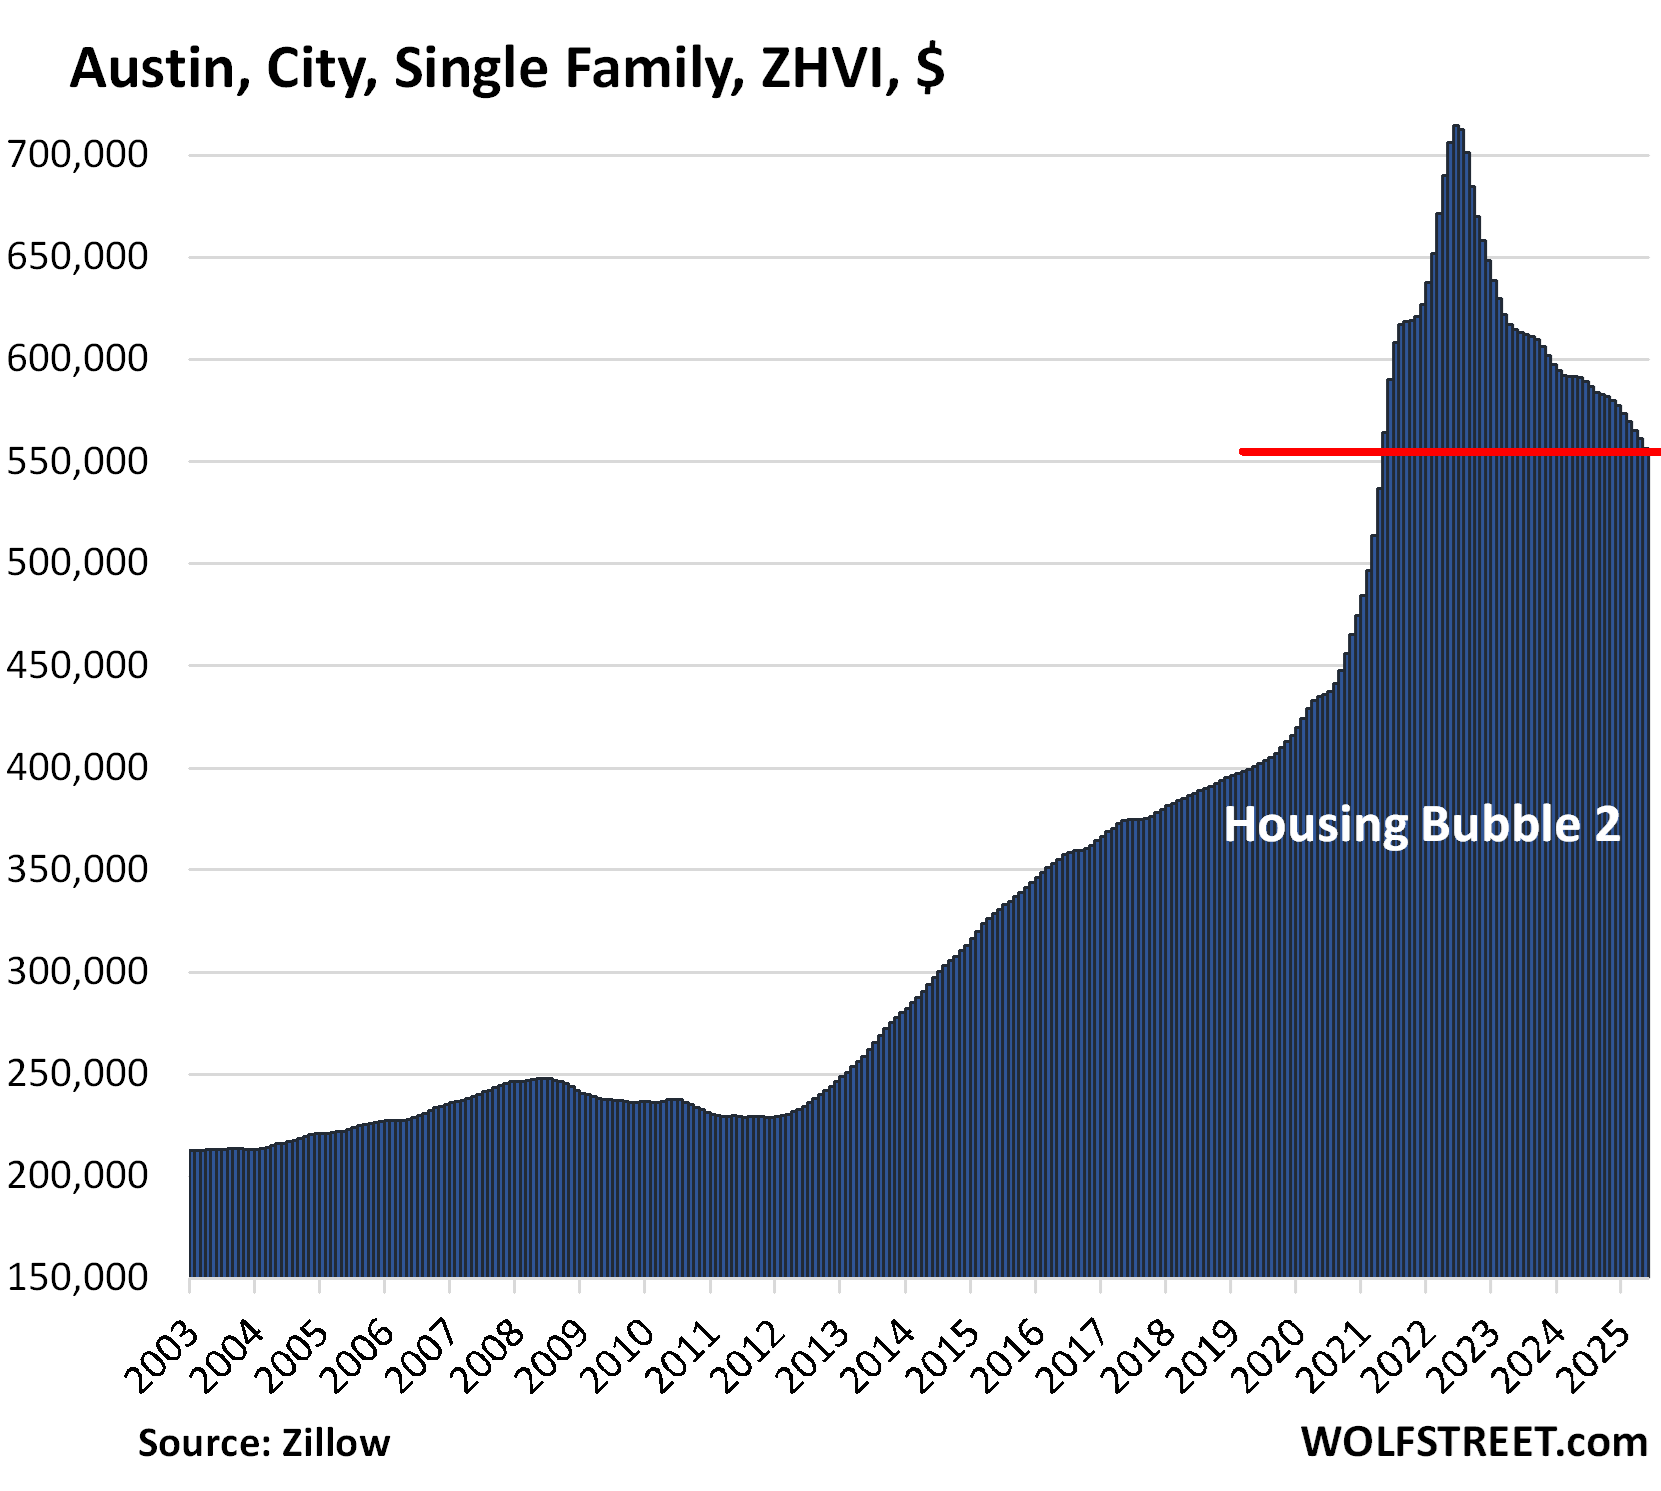
- Austin: -22.1%
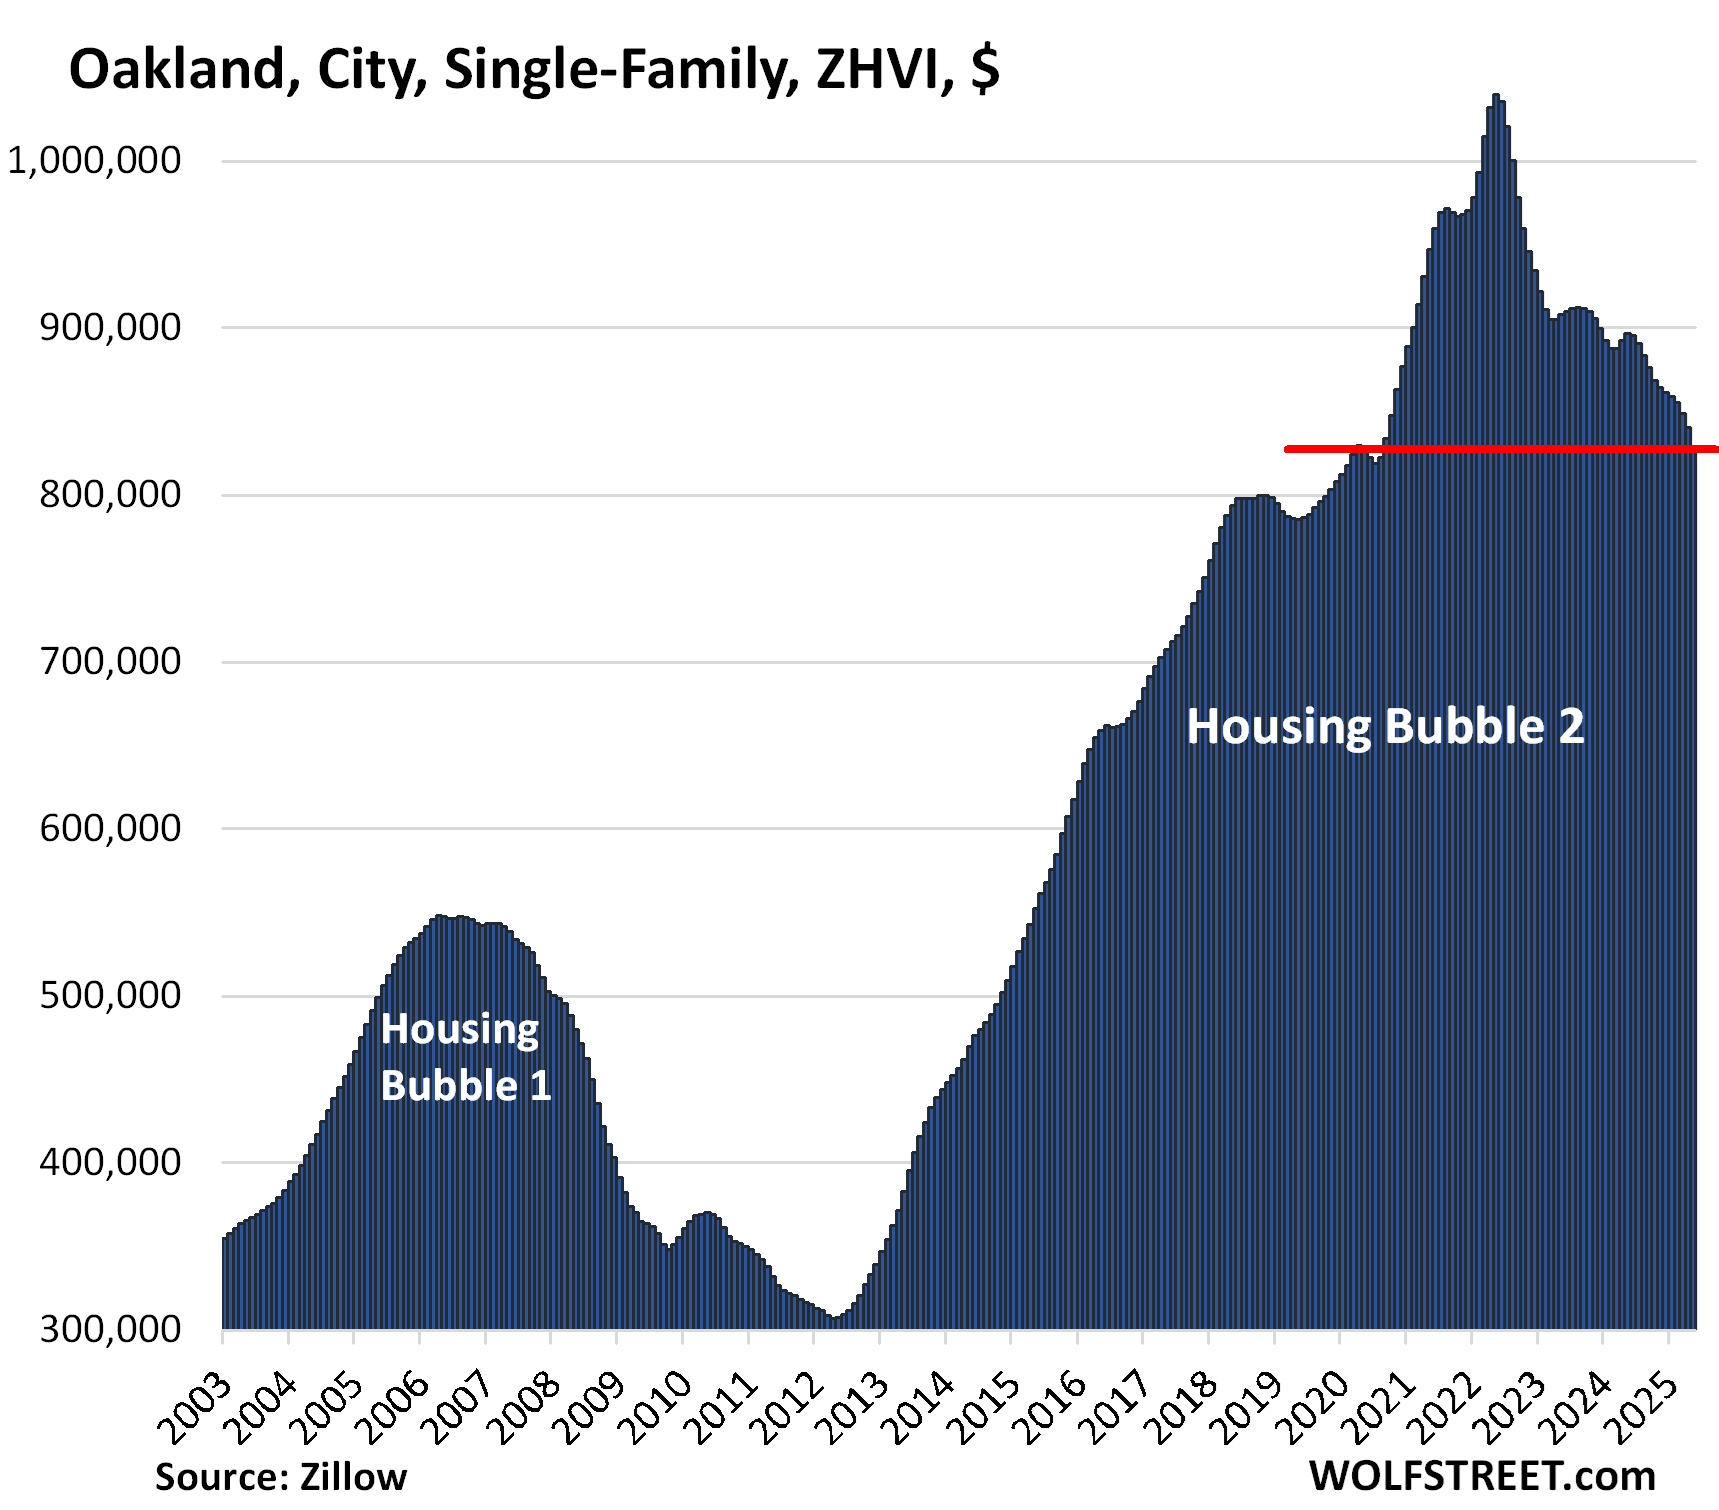
- Oakland: -20.3%
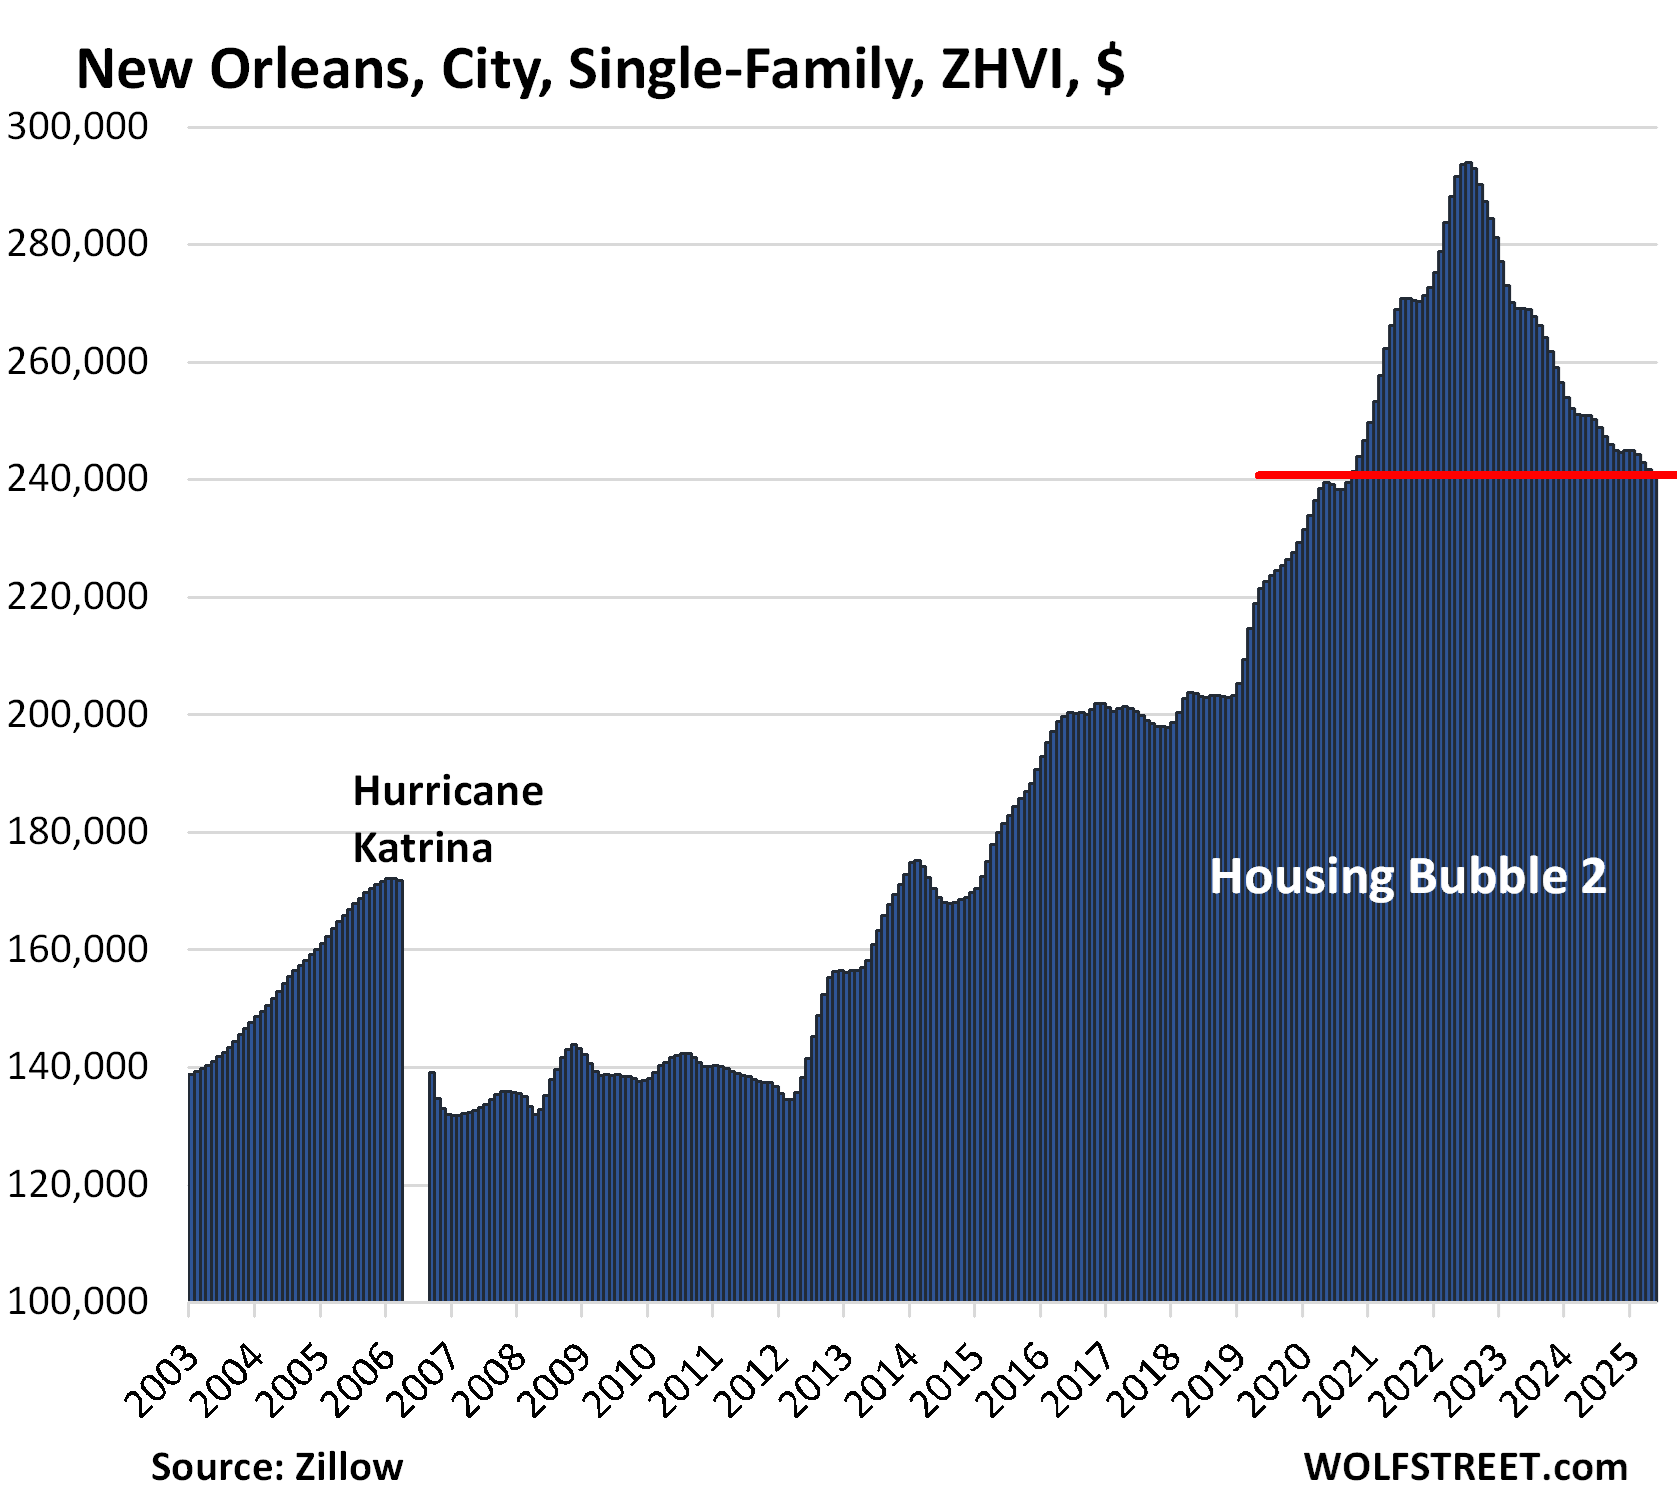
- New Orleans: -18.1%
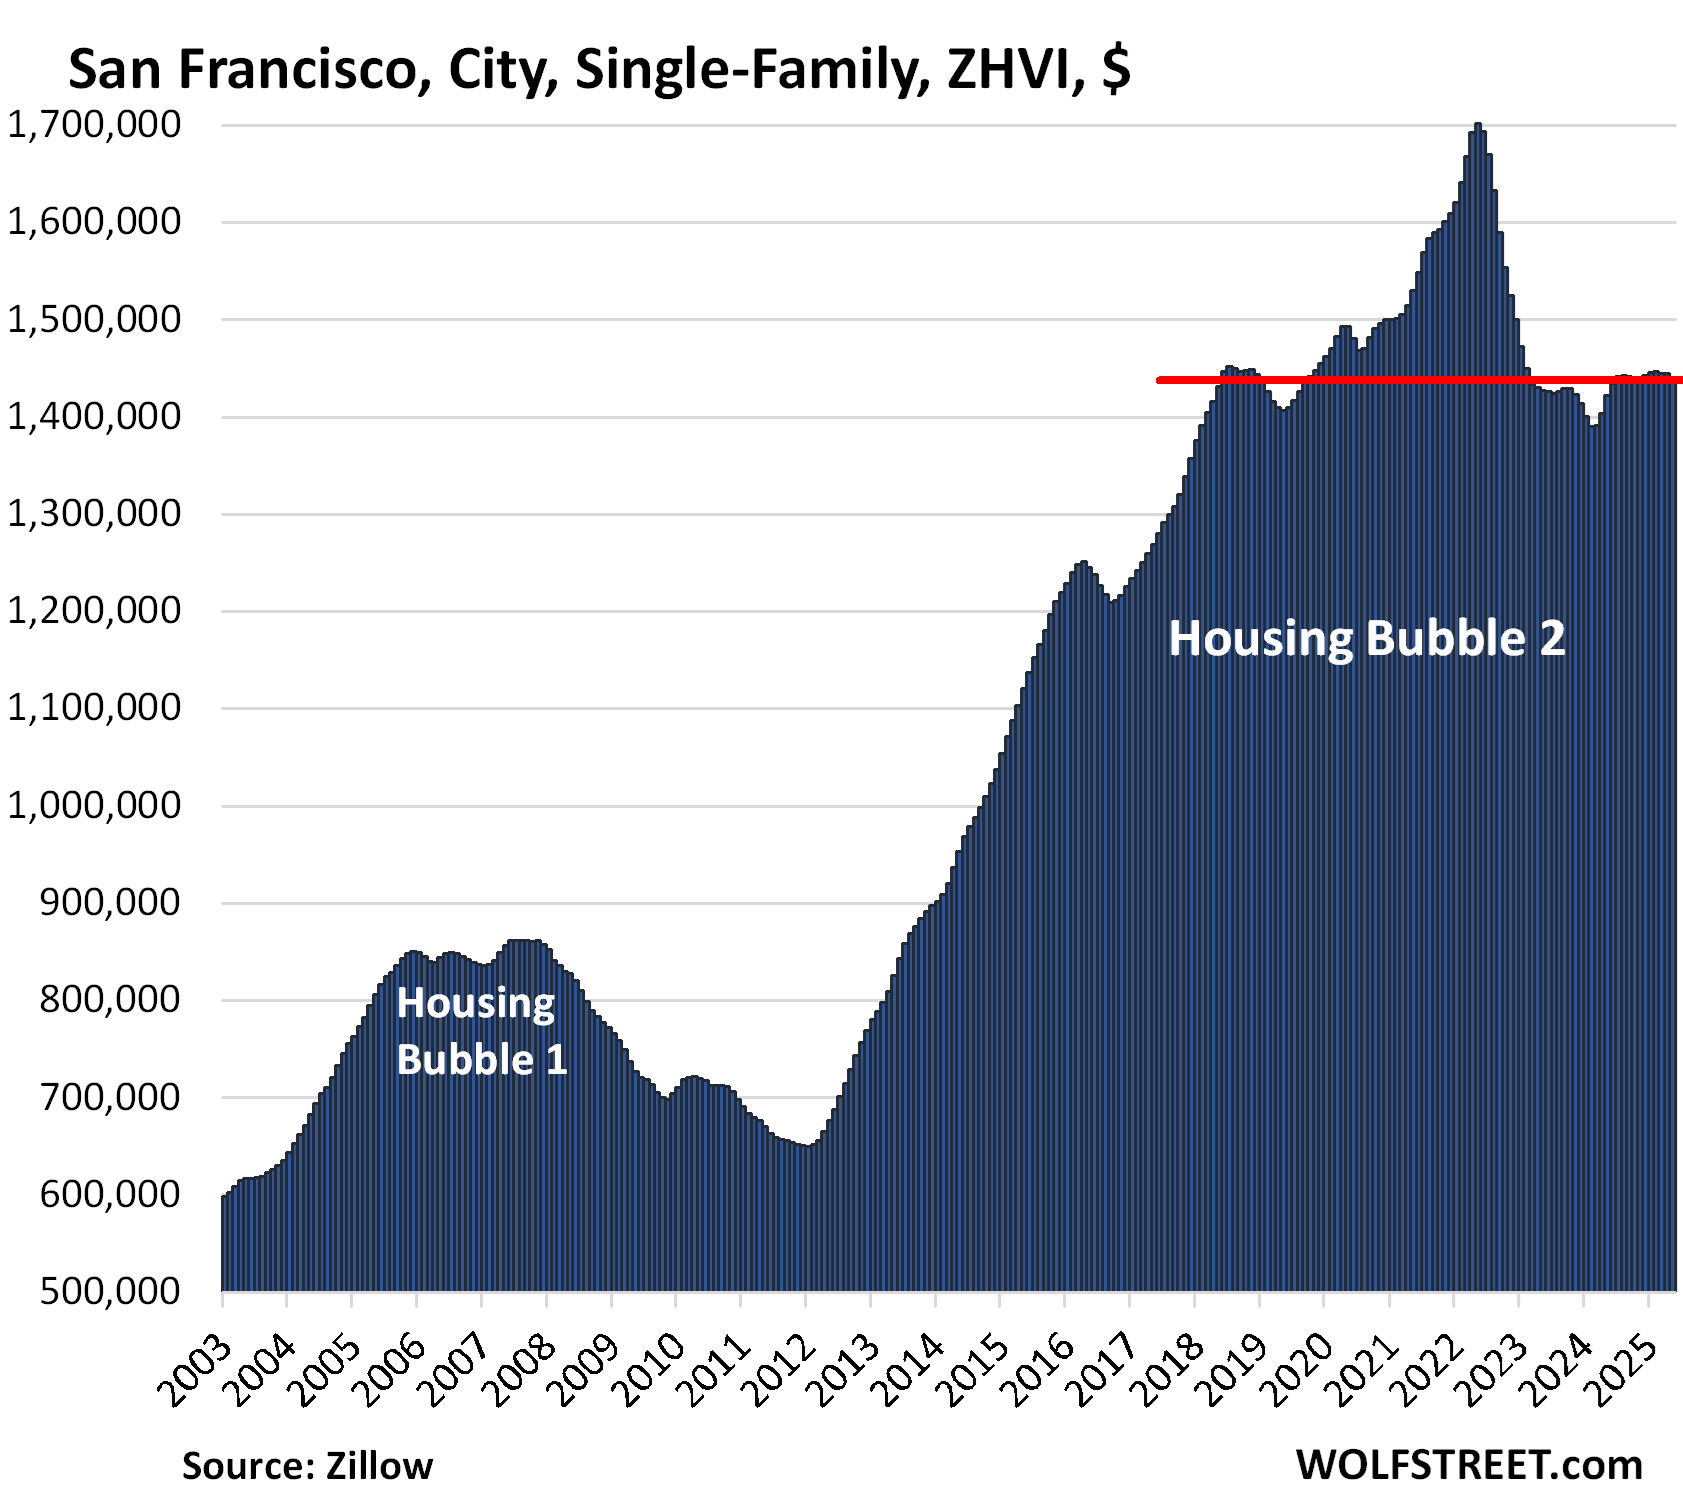
- San Francisco: -15.3%
- Washington DC: -10.8%
- Denver: -9.0%
- Portland: -8.9%
- Phoenix: -8.8%
- Fort Worth: -7.7%
- San Antonio: -7.6%
Prices in all of these 10 big cities in May fell month-to-month and year-over-year.
Single-family home prices are not sliding down the slippery slope as fast as condo prices have been sliding, which I discussed a few days ago: The Condo Bust Is Here: Prices Dropped Already 10% to 23% in 20 Bigger Cities, Unravel the Most Splendid Condo Bubble Ever.
These prices here are seasonally adjusted three-month moving averages of “mid-tier” single-family homes in “cities” – not in metros, or Metropolitan Statistical Areas. The values are from the Zillow Home Value Index (ZHVI), which is based on millions of data points in Zillow’s “Database of All Homes,” including from public records (tax data), MLS, brokerages, local Realtor Associations, real-estate agents, and households across the US. It includes pricing data for off-market deals and for-sale-by-owner deals. These are not median prices.
The 10 Big Cities with the biggest price declines.
In the little tables for each city below, note the sharp month-to-month drops – a sign that the declines are heating up (the drops are not seasonal because the index is seasonally adjusted).
The metrics in each table from left to right: price decline from the peak, change from prior month (MoM), change year-over-year (YoY), and increase since January 2000.
| Austin, City, Single-Family Home Prices | |||
| From Jun 2022 peak | MoM | YoY | Since 2000 |
| -22.1% | -0.8% | -5.9% | 172% |
Prices in the city of Austin are back where they’d first been in May 2021. They exploded on the way up but are much slower-moving on the way back down.
In the two years from mid-2020 through mid-2022, prices in the city of Austin had exploded by 64%, which was nuts. This price explosion in Austin and across the US shows that something went seriously wrong with the Fed’s monetary policies at the time, and we know what: Buying trillions of dollars of Treasury securities and mortgage-backed securities and leaving short-term policy interest rates at near zero for way too long. But now the Fed is doing the opposite: it shed $2.3 trillion in securities so far via its QT program and has been sticking to its 4%-plus policy rates.
| Oakland, City, Single-Family Home Prices | |||
| From May 2022 peak | MoM | YoY | Since 2000 |
| -20.3% | -1.4% | -7.6% | 297% |
Note the month-to-month drop of -1.4%, seasonally adjusted, which is substantial. Prices are back where they’d first been in March 2020. In the decade between mid-2012 and the peak in May 2022, prices had exploded by 236%, which was nuts.
| New Orleans, City, Single-Family Home Prices | |||
| From Jun 2022 peak | MoM | YoY | Since 2007 |
| -18.1% | -0.4% | -4.1% | 109% |
Prices are back where they’d first been in September 2020.
| San Francisco, City, Single-Family Home Prices | |||
| From May 2022 peak | MoM | YoY | Since 2000 |
| -15.3% | -0.3% | 1.2% | 236% |
Prices have returned to where they had been over six years ago in mid-2018. Over the decade through mid-2022, prices had shot up by 146%.
During the two years of mid-2020 through mid-2022, prices had surged by “only” 14% as the price explosion of 127% in the prior eighth years had already exhausted the market, and major companies had started to leave because out-of-whack housing costs were driving up their payroll expenses.
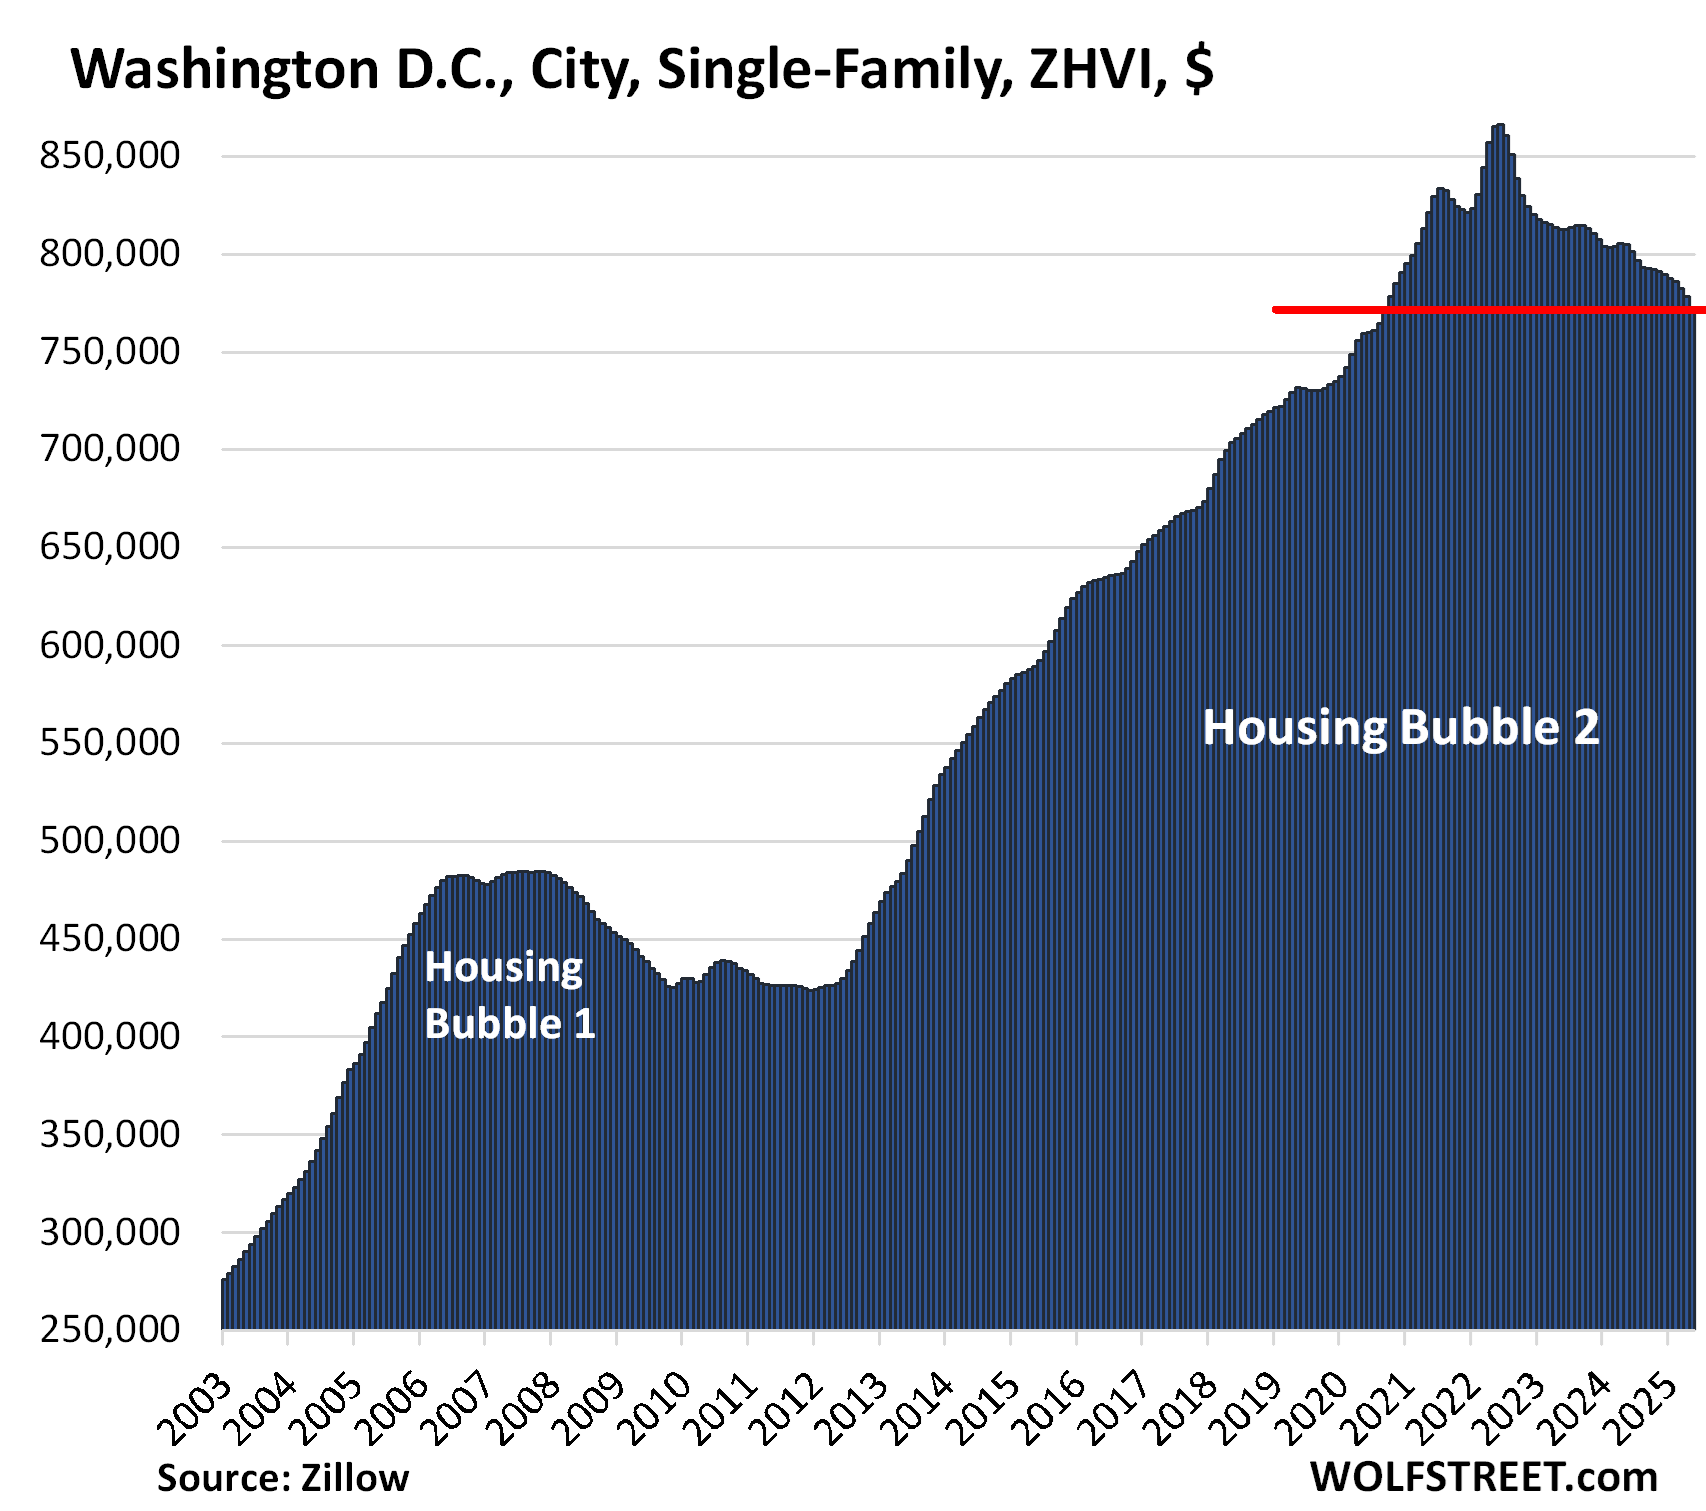
| Washington D.C., Single-Family Home Prices | |||
| From Jun 2022 | MoM | YoY | Since 2000 |
| -10.8% | -0.7% | -4.1% | 279% |
Prices are back to September 2020 levels.
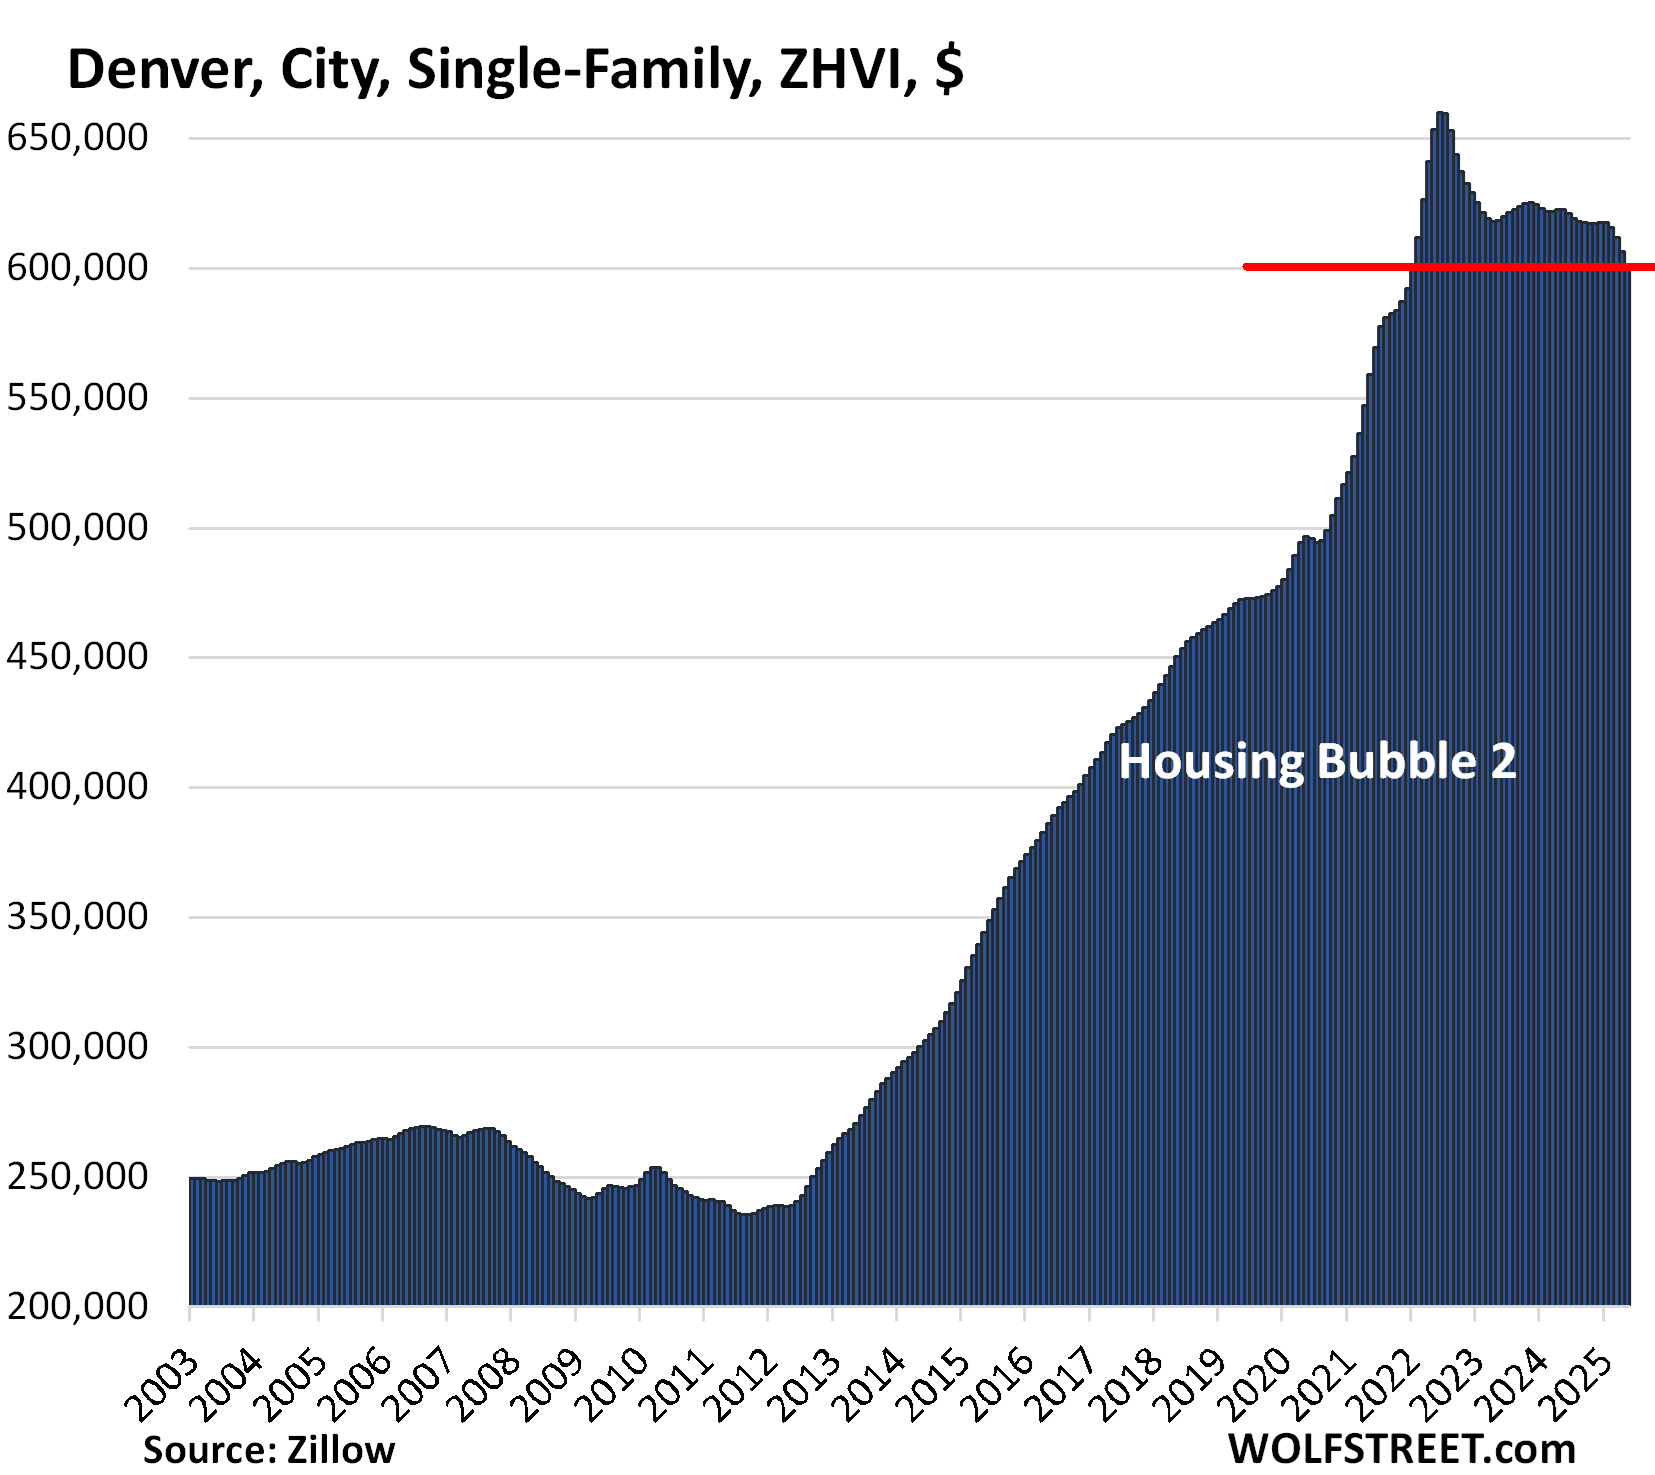
| Denver, City, Single-Family Home Prices | |||
| From Jun 2022 peak | MoM | YoY | Since 2000 |
| -9.0% | -0.9% | -3.5% | 218% |
Prices have returned to January 2022 levels. In the decade through mid-2022, prices had spiked by 174%.
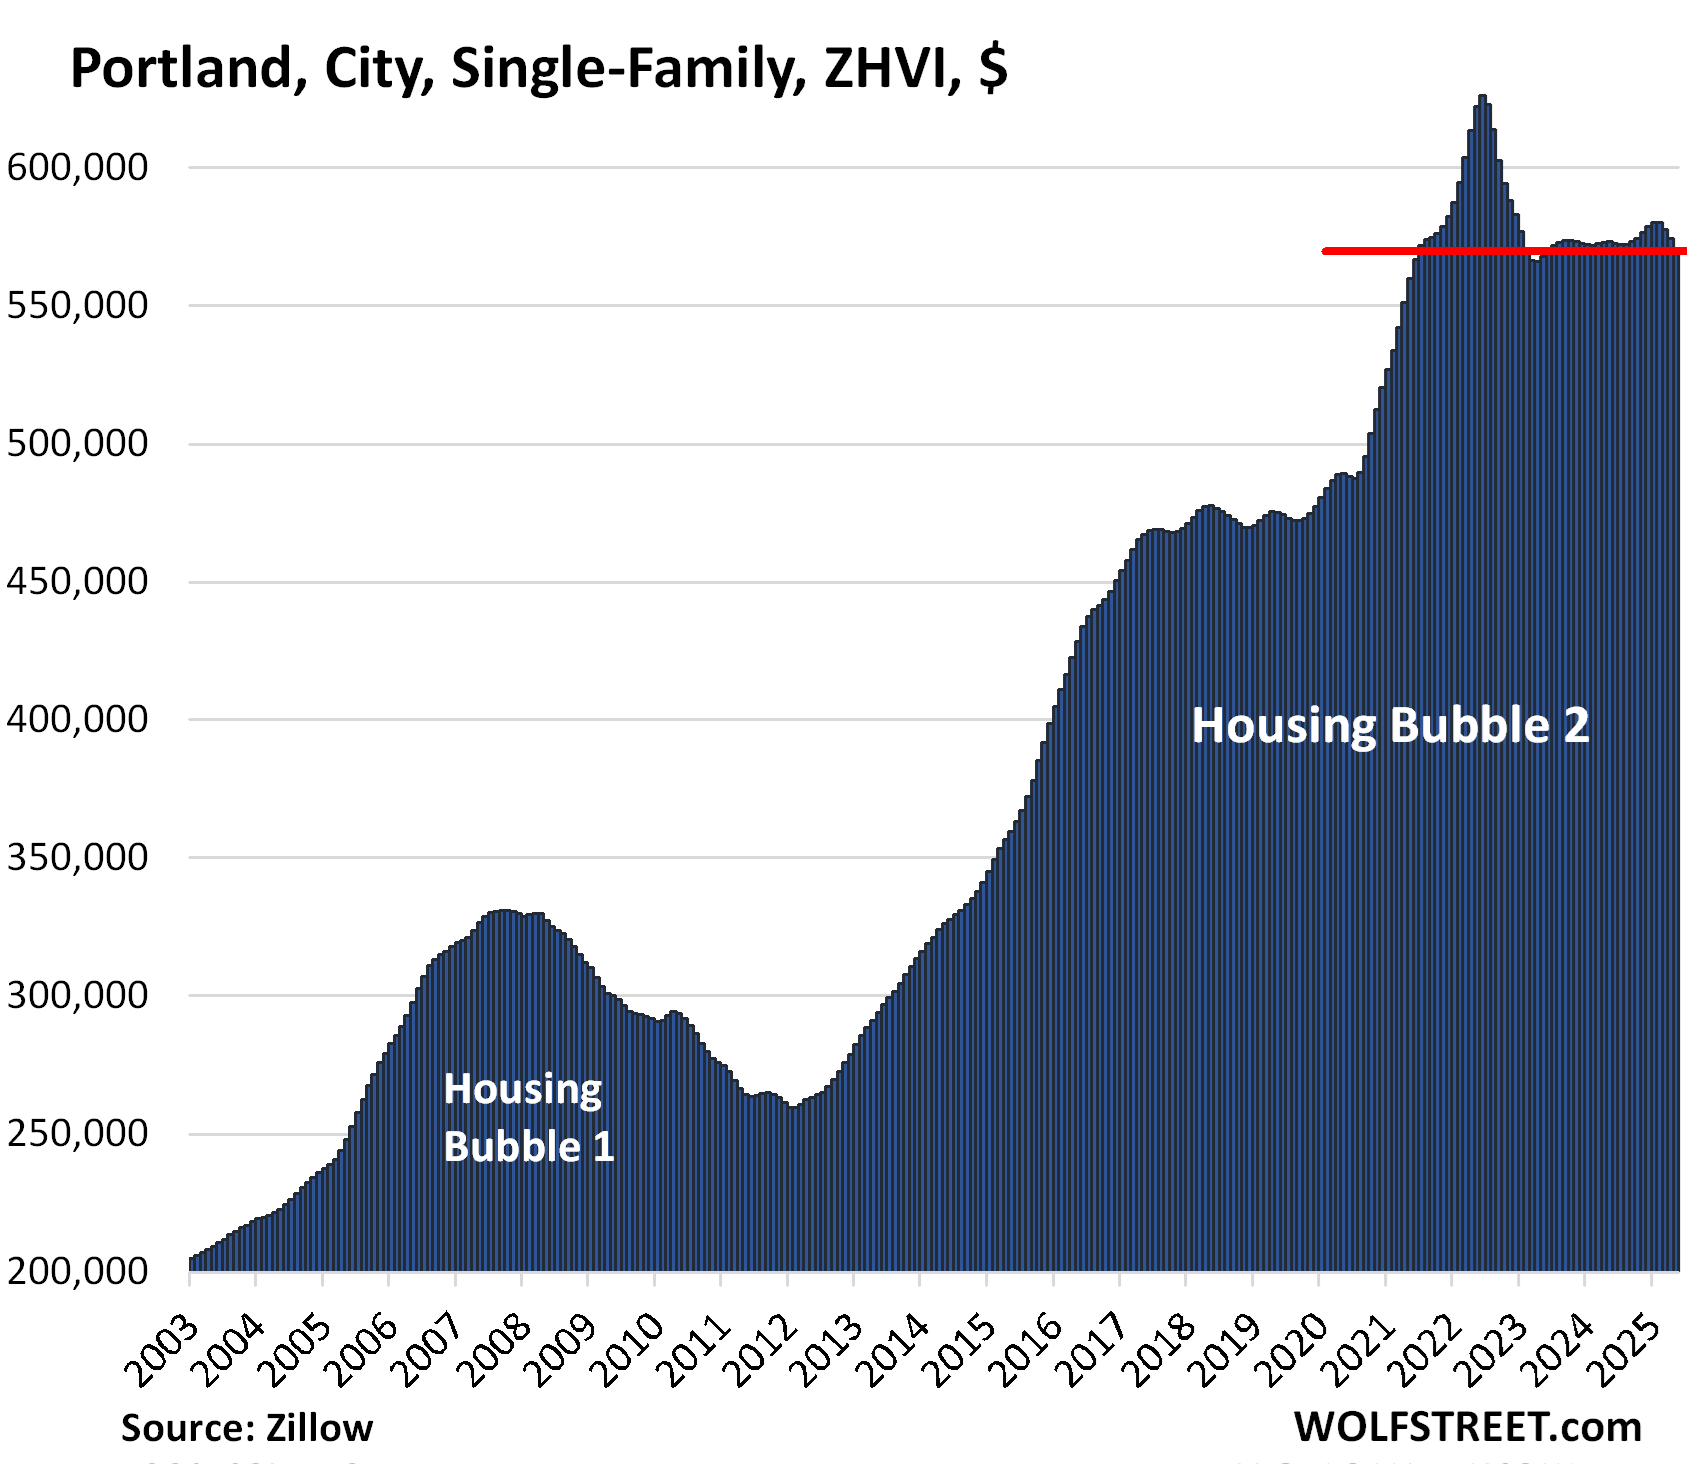
| Portland, City, Single-Family Home Prices | |||
| From May 2022 peak | MoM | YoY | Since 2000 |
| -8.9% | -0.7% | -0.5% | 225% |
Prices have fallen below July 2021 levels.
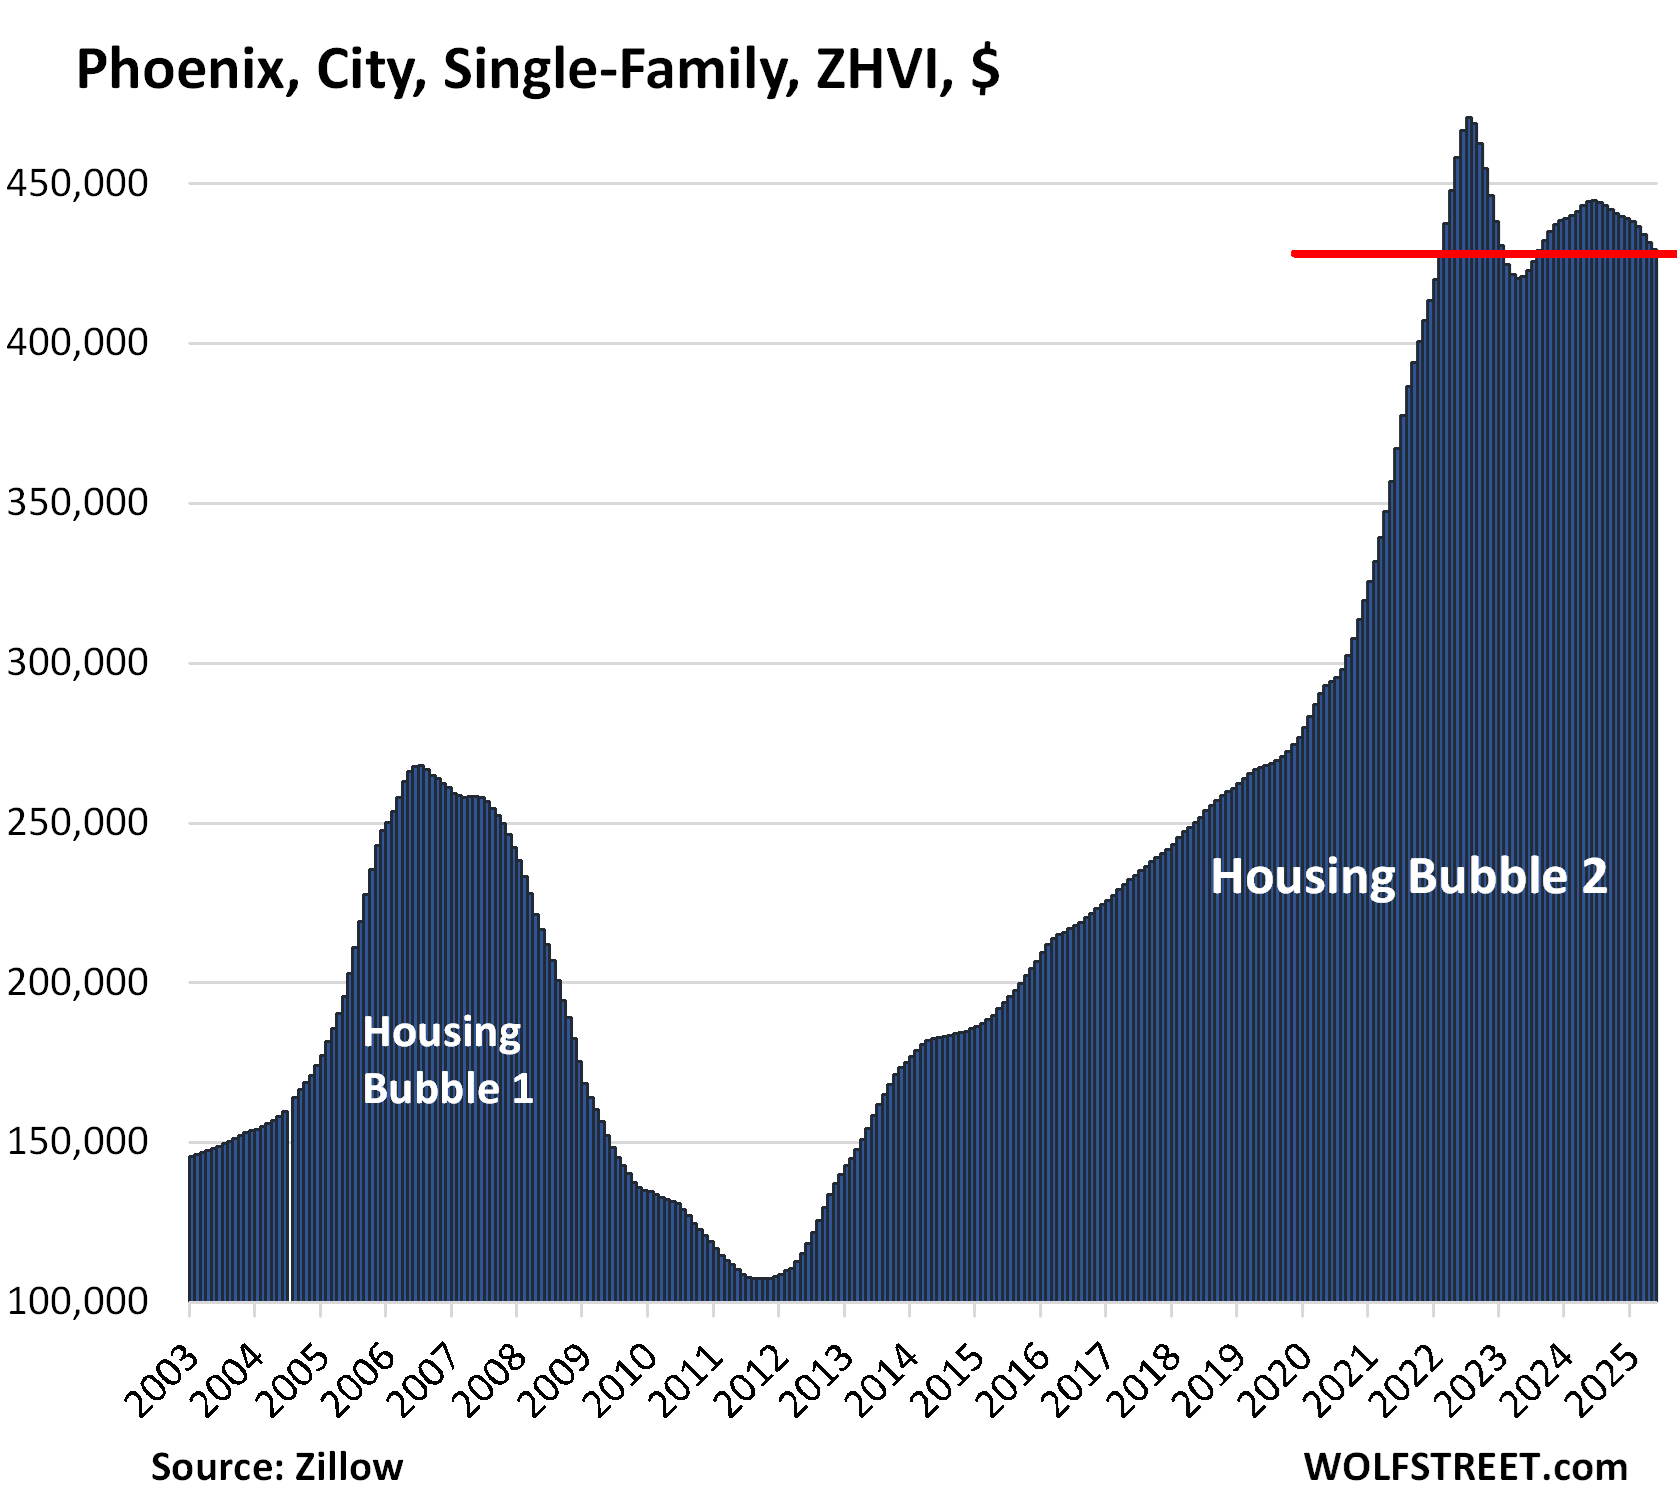
| Phoenix, City, Single-Family Home Prices | |||
| From Jul 2022 peak | MoM | YoY | Since 2000 |
| -8.8% | -0.5% | -3.4% | 254% |
In a little over two years, between April 2020 and the peak in July 2022, prices of mid-tier single-family homes had spiked by 62%. In the 10 years through mid-2022, prices had exploded by 339%.
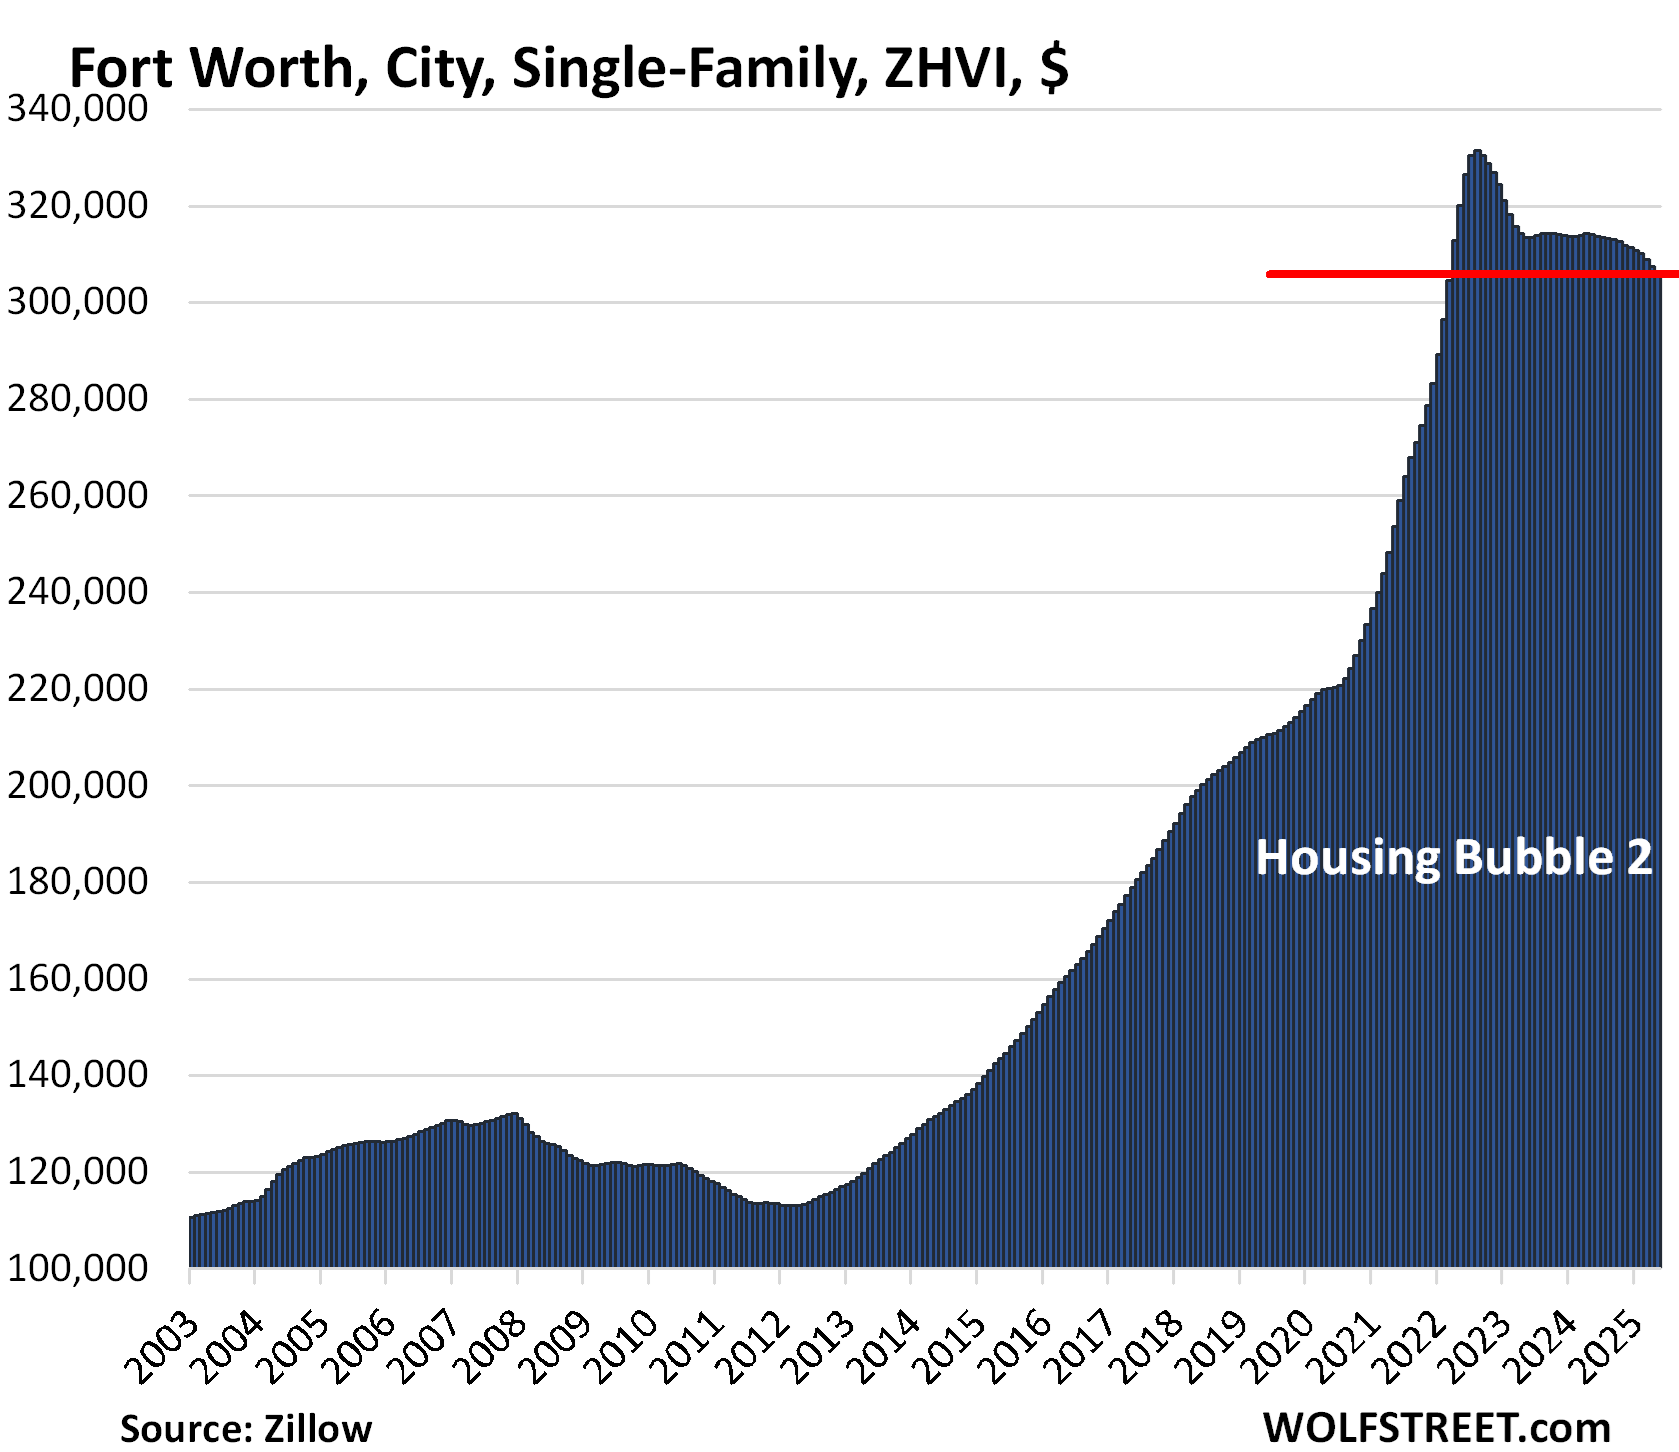
| Fort Worth, City, Single-Family Home Prices | |||
| From Aug 2022 peak | MoM | YoY | Since 2000 |
| -7.7% | -0.5% | -2.6% | 194% |
Prices have backtracked to March 2022 so far. In the 10 years through August 2022, prices had spiked by 187%.
The cities in Texas didn’t experience much of a Housing Bubble 1, and Housing Bust 1 was therefore relatively mild. But this changed with Housing Bubble 2.
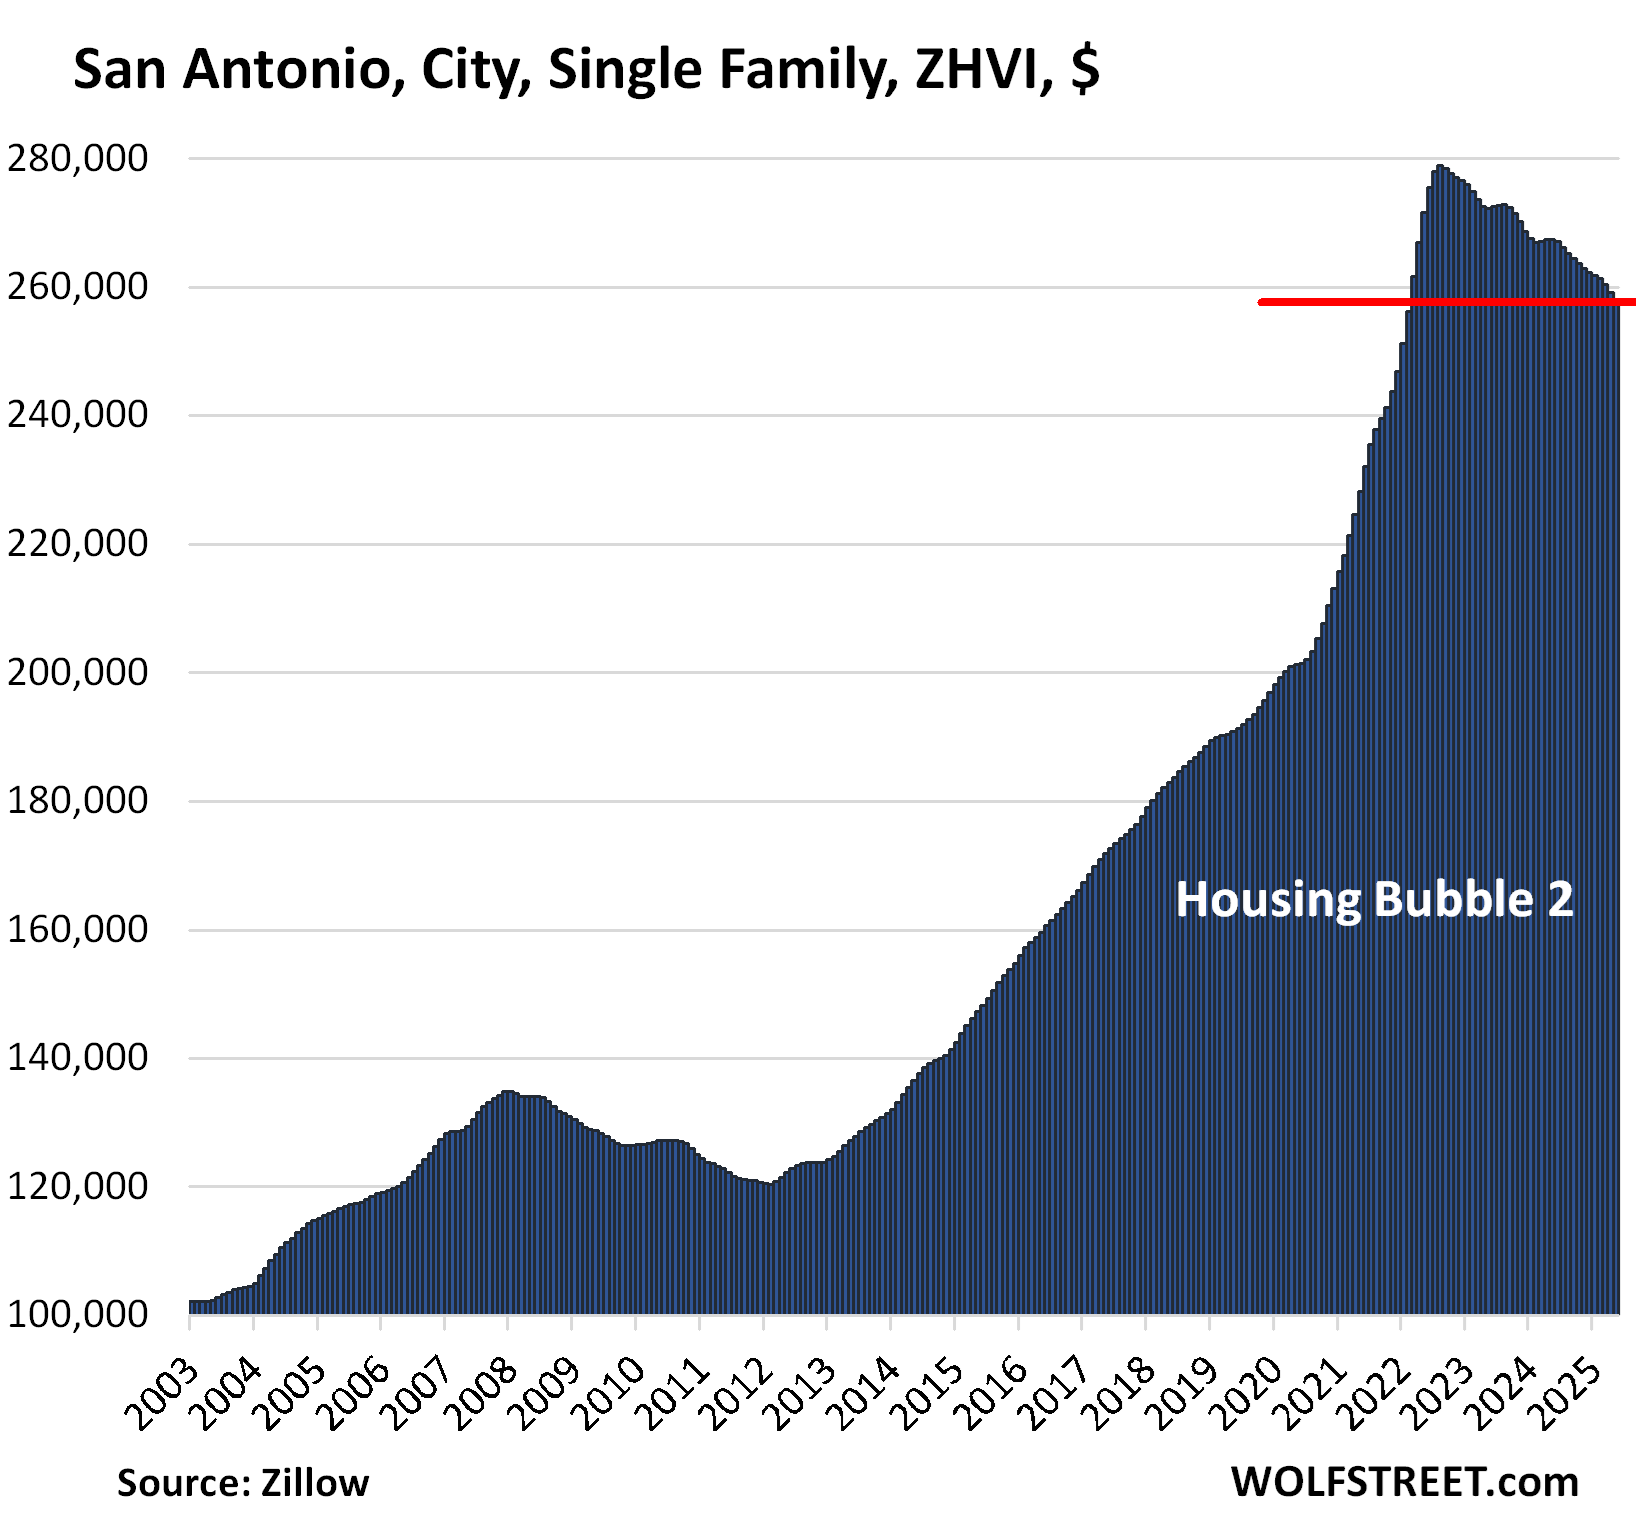
| San Antonio, City, Single-Family Home Prices | |||
| From Jul 2022 peak | MoM | YoY | Since 2000 |
| -7.6% | -0.5% | -3.6% | 154% |
Prices have returned to February 2022 levels. In the decade through mid-2022, prices had shot up by 126%.
Enjoy reading WOLF STREET and want to support it? You can donate. I appreciate it immensely. Click on the mug to find out how:

![]()
Even with price decreases the prices are still incredibly high. Add closing costs into the price and it still takes a lot of money to go to settlement.
Good thing the crash has only begun. We are inning 4 of this game. Enjoy!
Nah Dave, only in the ”warm up” phase, SO FAR…
Been through many of these in the last 8 decades with dad and both granddads in the RE biz continuing for ever to discuss what they did right and wrong since the ’20s — the 1920s.
Basic rule of thumb is, ya win some and ya lose some, and ya hope the wins overcome the losses.
These days, with the VAST propaganda efforts along with the SO much better communications, ya gotta listen/read carefully the Wolfster’s HARD COLD FACTS,,, and ignore pretty much all the rest.
Good Luck and God Bless,
The Fed fomented the last bubble & crash, and of course fomented this bubble and impending crash.
Personally the one thing I have yet to wrap my head around is what will be their response to try and salvage “the wealth effect” of housing yet again.
There is nothing a central banker in a debt driven economy fears more than deflation. If you look back at a chart from 2009, money growth went negative for a tiny blip, and the destruction was massive.
As people here should know prices will need to come down further in order to create demand to clear the market.
Does anyone have any realistic guess as to what kind of pricing we will see when the housing markets nationally hit bottom? 2012 pricing? Before?
Wolf has previously noted that CRE fell 70% in some areas, could this be the case with residential real estate too?
It’s impossible to say with any kind of accuracy but housing is sitting at about double it’s long term trend as per case shiller index. That doesn’t necessarily mean anything but it’s an anchor at least. I’m not sure what the “it might drop a few percent but no more” crowd is using as an anchor on the other hand.
If CRE includes office there were other issues there that don’t apply here. A 70% drop seems beyond unlikely.
I’d love to see 2012 pricing myself but I’m not holding my breath and even in an absolute best case scenario if your expectation is that it returns to trend (as it did in 2012) you’d still want to adjust upwards for inflation.
Most opinions on this really are just guessing though and I wouldn’t put too much stock into any predictions.
It depends whether the market sets the price or the interest rate policy.
Any cut in rates will be matched by an increase in prices.
LOL. Fed already cut by 100 basis points, and mortgage rates spiked, and housing supply spiked, while sales remained at collapsed levels and deteriorated further, and prices are skedaddling downhill in many markets. I cannot wait for the next 100 basis points in cuts.
Any realistic guesses as to how much prices have to drop nationally in order to create enough demand for the market to balance?
90%
Hi Jack,
Realistic? Hardly, but when in doubt why not try the ‘wet-finger-in-the-wind’ gauge.
How much has the underlying average per capita income/GDP grown in comparison to the housing prices?
House prices including in Southern California used to and should cost around 2 to 3 times average wages, and are likely to return to that level as all of the mindless speculation comes crashing down. A house now selling for $1 million – if you can find one – should be selling for absolutely no more than about $90,000 these days.
You are dreaming SCBD!
Just as was my cousin who purchased a 3 and 1 rancher in SoCal for $2500 right after WW2, when he thought he could do it again in the 1960s…
Mom’s frequent reply to me when I wished for similar was, ”If wishes were horses, every beggar would ride.”
Good Luck and God Bless,
@SoCalBeachDude there have been times when some “fixer uppers” sold for al low as 2x average wages, but for most 1925-1975 the LA and SF area median home prices were closer to 3x median median income. With rare exceptions the ratio has been over 4x in CA metro areas for the past 50 years (and over 8x in “nicer areas” for the past 25 years. Google AI says: “The median household income in Los Angeles County, California is $87,760” so the “meidian home price” “should” be (if things revert to the mean) ~$375,000. Google AI also found that “The median home price in Los Angeles County is currently around $930,000, according to Redfin.”
If wages and interest rate stay static, then you’d need home prices to crash 20-25% to get back to affordability (no more than 30% of gross income spent on your mortgage)
This figure assumes 20% down payment and includes taxes and insurance.
According to Atlanta Fed home affordability index – if you’re making median wage and buy a median priced home, then nearly half your gross income will be spent on your house. So well over your half your take home pay.
Being house poor is a bad way to go through life.
Well wages aren’t static, so another 4 years of income growth with static home prices. Like the ‘90’s, brings it in line again
Huge swing and a miss. 4 years of 2% or less real wage growth YoY will NOT make houses affordable again.
lol @ comparing today’s unaffordable housing to the 90s
Prices need to come down big time !
Dude. You said yourself that 20% drop was needed. You get the equivalent price/income if prices are flat and incomes go up 20%, which is what we’re on pace to do.
Maybe being “House Free” is the way to go?
Realistically, when renting vs owning gets more inline. People will probably will buy for $2K more than renting. They aren’t buying for $8K more than renting.
The National Association of Realtors should cheer the price declines instead of opposing them. Sales volume will increase a lot once prices fall enough to motivate sellers and attract buyers. That will more than make up for smaller commission sizes.
@ Bagehot’s Ghost,
Agreed, at least from a common-sense standpoint. However, many member realtors would probably object to such a statement because their agents frequently talk up residential real estate as a “good investment.” Hard to reconcile that point with a formal NAR statement that prices are falling in some areas.
A positive “spin statement” on falling prices from the NAR would also produce an immediate follow up question from prospective buyers: how do you know they won’t fall further? That sensible question is what is keeping many people out of the market today.
Decreasing residential RE prices also resurrect an ugly specter: the possibility of “going underwater” on one’s mortgage loan. The NAR itself acknowledges the real estate market is cyclical. As Wolf has noted, it is a slow cycle. But all it takes is one poorly timed RE investment to put an unfortunate owner in the “house is not worth as much as the mortgage loan in today’s market” position. Not pleasant to be forced to cut the bank a check for 20K just for the privilege of selling one’s home.
And yes, I’ve heard the old “it depends on how long you plan to live in the property” argument. A fine contention provided you can do one thing with 100% accuracy: predict the future. Unplanned sales happen all the time from people who originally planned to live in the property for a long period.
As has been repeatedly noted on this forum, there are many reasons for unplanned and unexpected RE sales: illness, job loss, job transfer, divorce, death in the family, etc.
I give the “depends on how long you plan to live there” point the same level of credibility (none) I give to the “marry the house and date the rate” crap. That point also depends on predicting the future accurately. Can’t be done, but that doesn’t stop the agents from using it.
No matter the market conditions, agents ALWAYS have a “why buying today is a great idea” spin. That is part of their job. Buyer beware.
I kind of know what you’re saying, but if anyone is worried about going “underwater” they are very uninformed. To expect huge price increases over a short period of time to historically low affordability levels to stay or even keep going up is very unrealistic.
It’s a reasonable concern if someone goes underwater, since it means any change in their life circumstances – moving for a new job, perhaps – will put them deeply into the red.
You are correct though that expecting any asset prices to keep going up forever is a bad bet. When people start going on about an asset going up forever with no downsides it should warrant selling en-masse. It’s the most reliable indicator of a bubble. Real estate definitely fits that description.
Lol, there’s daily delusion in Canadian RE reddit subs. Don’t discount the HODL copium. It’s how they stay sane(or insane) depending on one’s POV.
Realtor propaganda works best on buyers. Harder to push sellers to drop their price or accept a “lowball “ offer.
Realtors know phrases like “marry the house, date the rate” work well on buyers emotions.
Don’t fall for their propaganda! Home you live in isn’t that great of an investment. It’s a place to raise your family and make memories
2nd place still gets to hang the NL or AL pennant in a drafty corner of the stadium.
Just saying
With regards to Austin, for people moving into town from 2020 on, where were most coming from?
My guess is a combination of California and New York, but I don’t have any data to back it up.
It’s California followed by Florida and Colorado.
LA, Dallas, SF, SLC and Seattle are the top 5, according to redfin
With the US at war again, only this time more bigly, one wonders how it will affect the housing market. My guess is it will have a chilling effect as people will react to economic and political uncertainty by staying put and not being as willing to risk making investments.
hmm…likely another nothing burger for the residential housing market, unless it turns into some kind of world ending “Don’t look up” type of event. If that does happen, I am sure, RE industry will somehow drum up some narratives why it’s a good time to buy.
All I can say is, if the housing market crashes while stocks and crypto keep going up, it’s going to cause absolute chaos. The torches and pitchforks will be coming out from coast to coast. I’m sure it’s one of the things keeping Jerome up at night. It will be the end of America as we know it
I moved to Austin area in 2021. This article is right on. The price drop confirms what is obvious. Austin is fast becoming a real dump; a bad deal from every angle. The only good news is price drop and corresponding business and home owner flight now taking place, proves the market works and buyers aren’t stupid.
Yahoo has a blub that says: BUYING A HOME IN 2025 COSTS 43% MORE THAN RENTING ONE.
If multifamily construction is growing faster than single-family construction prices may remain high.
Huge swing and a miss. 4 years of 2% or less real wage growth YoY will NOT make houses affordable again.
lol @ comparing today’s unaffordable housing to the 90s
Prices need to come down big time !
For some unknown reason, I stumbled on a story headline from 2 weeks ago, at some pointless scumny blog:
“ U.S. Vacation Hot Spots Getting Flooded With New Residents”
It had a list of places where they claim people are retiring to — one of the top cities on their list was Panama City, Fl.
Then, I google Panama City and inventory, and see a link to Wolf Street — so I search for any mention of that relationship.
What I found was some comment mirroring how awesome Panama City is — and then Wolf shooting that comment with lead pellets:
“ The Panama City Beach area is still growing because of tourism …
what’s growing is inventory, LOL. In the Panama City-Panama Beach metro, inventory is double of where it was in April 2019. It’s among the worst in Florida:”
Great example of why Wolf Street is a far better place to visit for facts versus hype.
As housing inventory explodes higher, there’s going to be an explosion of misleading hype and bullshit about great deals — let the buyer beware!!!!
Inventory exploding higher would be a great thing because it would eventually result in some good deals.
I’d be interested in a post on the 10 big cities with the biggest price increases, too.
The promo clickbait media, paid for by the real-estate industry, including the WSJ and social media, are filled to the rafters with this toxic real-estate hype propaganda. THEY are a big part of the cause of the disastrous housing unaffordability. Young people should sue them to smithereens for the damage they have caused with their ceaseless real estate promo BS. These toxic promoters are everywhere, infesting everything, from WSJ down to the comments here, to manipulate potential buyers into FOMO, which is one of the reasons we saw this explosion in prices. THEY are among the culprits. If you promote real estate here, YOU are a culprit. Every housing-market article attracts them, and they’re crawling all over the comments here like maggots, and I now block them or incinerate them.
As Wolf points out above, be very critical of everything you read and hear and be conscious of the fact that at the end of the day, those in the industry are salespeople.
Quick story, in 2003 I bought my first house in N. San Diego (San Marcos). Our realtor pushed us hard to make an offer on each property we looked at. After missing out on the first few we fell into the FOMO mindset. Ultimately, we closed on the 4th home we made an offer on. The house was fine but the downstairs layout was very poor. Closed off rooms, not open at all, etc. So fast forward to 2007, began divorce proceedings and put the house on the market. At this time, market is shifting, home prices are falling and we need to sell. Took a year to sell the house but the choicest comment was from our realtor who stated, “I never would have sold you this house as everyone who looks at it points out how inefficient the downstairs layout is”. Point is, she didn’t even remember selling us the house as the only thing she cared about was getting her commission. Moral of story, just be aware the motivation of anyone who is giving you advice.
A quick shout-out to Wolf for presenting such thorough information rooted in data and analytics and not emotions/speculation.
“which is why we saw this explosion in prices”
Slimy RE hucksters are always in abundance (slimy hucksters in general are always in abundance).
But without ZIRP (and the money printing which made it possible) both doomed Bubbles 1.0 and 2.0 could never have happened – ZIRP rates created the illusion of affordability (at ever ascending, astronomical *prices*) by holding monthly payments flat.
Zeroed rates…in a country with ever more gross debt.
So slam away at the hucksters – but make sure to reserve the greatest scorn for the master forgers of the Fed.
Totally agree, and further, the Republicans and Democrats appointed and confirmed these fed governors that created this zirp and money printing fuel for the explosion, and to be fair, buyers had a very risk on appetite, which contributed also, but still, the frenzy was increased by the govt policy, but I wish more people were aware of that when they vote, meaning, do they want to vote for frenzy fuel? And the crazy thing is, some do. But I think it’s really bad.
It’s true. I get incinerated here regularly.
But tell us how you really feel.
No, you don’t want to know.
“It’s a great time to buy”- Lawrence Yun. Oct-1991, Dec-2003, Feb-2004, Jun-2007, Oct-2010, Jul-2011, Sept-2013, Sept-2016, Jan-2018, Mar-2020, April-2022, Nov-2024, Jun-2025….
buwhahah…..the day that Lawrence declare it’s not a good time to buy and for buyers to stay away from the market for extended period of time, the follow things will probably also happen…another word, unlikely in our lifetime.
Universal health care
Wealth gap diminish to “normal” level
Pension becomes a thing again in corp America
US withdraw all military intervention around the world
Interest rates and mortgage rates above 10%
We land on Mars and make it a livable colony (maybe then RE will start advertising good time to buy early there?)
Wolf,
Has your data started to show any uptick in foreclosures? As we all know, there haven’t been many recently because with the huge price increases, a borrower in cash flow trouble could sell the house and repay the loan. However, drops of 20% will start to put some borrowers into negative equity situations.
I track foreclosures quarterly. They have come up quite a bit, but from near-zero levels during the pandemic during the foreclosure bans, and they remained low by historical standards — same with mortgage delinquencies:
https://wolfstreet.com/2025/05/14/here-come-the-helocs-mortgages-housing-debt-to-income-ratio-serious-delinquencies-and-foreclosures-in-q1-2025/
As always your analysis is what we need to see sir. 1 quick question = Is there any remaining regulatory/rules from the COVID timeframe that limits forclosures in anyway? (sorry if you already covered this.. I did look, but may have missed it)
I think the Trump administration has removed, or is in the process of removing, the remainders, such as for VA loans. I’m not sure what the current status is, but it caused an uproar in the media about Trump wanting to evict thousands of Vets from their homes because they haven’t made a payment in years or whatever.
That said, no lender wants a foreclosure, and they will do what they can to avoid one, including modifying mortgages. That’s standard practice, and always has been. It works pretty well when home prices rise, but when they fall significantly, it may add to the losses for the lender.
Treasurer Powell own this ! His procrastination has cost the housing market losses in keeping the high Rate housing affordability, an arm reach away from loan approval. Yet his political minor degree. Which he openly shared . Has cost homeowners billions ? In addition to keeping builders unmotivated to build.
Perhaps you have discussed this before but what are the differences between ZHVI and Case Schiller? Do you prefer ZHVi over Case Schiller? Are there other indices worth watching?
Thanks for giving me an opportunity to repost this:
Here are the top 10 shortcomings of the Case-Shiller Home Price Index, and why I stopped using it:
1. The Case-Shiller index only covers 20 cities. So it has a “20-city index” that under-weights Texas (with only one market), over-weights California (3 markets), and lacks other big markets entirely, such as Philadelphia. So the 20-city index EXAGGERATED the housing bust price decline because Texas didn’t have a housing bust, but it was under-weighted. So the 20-city index is NOT a national index. And do NOT confuse it with a national index.
2. The CS does not provide prices by city or county or state or zip code (Zillow does all of this), just for 20 metropolitan areas.
3. The prices of the 20 metros are single-family home prices only.
4. The CS provides condo prices for only five metros. So that’s totally useless.
5. To fill in the gap for a national index for single-family home prices, the CS adds the data from the FHFA house price index, which is based on prices from mortgages that have been securitized by Fannie Mae and Freddie Mac. It doesn’t include data from sales where Fannie and Freddie mortgages were not involved (cash deals, jumbo mortgages, VA mortgages, etc.). So this FHFA house price index is systematically skewed to Fannie and Freddie mortgages, and it systematically skews the CS index. To include this data is unforgivable, and for that reason, I have never ever used the “national” Case-Shiller index.
6. In terms of condos, the CS doesn’t even attempt to come up with a “20-city” or “national” index because it has condo data on only 5 metros.
7. The CS indexes for the 20 cities are available only as index value, with that value set at 100 for the year 2000; and not as dollar prices. So by looking at the index of each city, as I do, you have no idea how expensive they are in relationship to each other.
8. The CS was invented by three guys at a university in 1991 on a shoestring. It was a revolutionary advancement at the time over median prices. The three guys – Case and Shiller being the two lead guys – formed a startup company and commercialized the index, and then sold the company. It has changed hands several times since then and now is part of S&P. Neither the prior owners nor S&P invested in the index to gather data on more than the 20 cities and to use modern data collection technologies. So it has been left behind.
By contrast, Zillow has invested billions of dollars to build its “Database of All homes,” and it continues to invest in it. This database contains everything… property tax records, MLS records, data from the local Realtors associations (especially useful in Texas which is a non-disclosure state), data from Zillow postings, pictures of the properties, transaction histories, etc. It has everything the CS has (sales pairs) plus a gazillion more data points on individual properties in all markets.
9. The CS uses an algo to weight the sales pairs. That is the shortcoming of the sales-pairs method. You have to assign weights to the sales pairs, depending on when the prior sale occurred. For example, a sales pair where the prior sale occurred a year ago is weighted heavily. A sales pair where the prior sale occurred 20 years ago is weighted much less. These algos are decisions, and not current market conditions. With the sales-pairs method, there is no way around these algos, but they are human-designed algos, and so part of what you’re seeing is the calculation of these algos. And I have seen it produce some strange results.
10. The Case-Shiller lags 3-4 months, which is unforgivable with today’s data-gathering technologies. It’s just outdated.
Thanks. That’s exactly the level of detail I was hoping for.