The labor market started regaining momentum in the fall of 2024, and it continued through March.
By Wolf Richter for WOLF STREET.
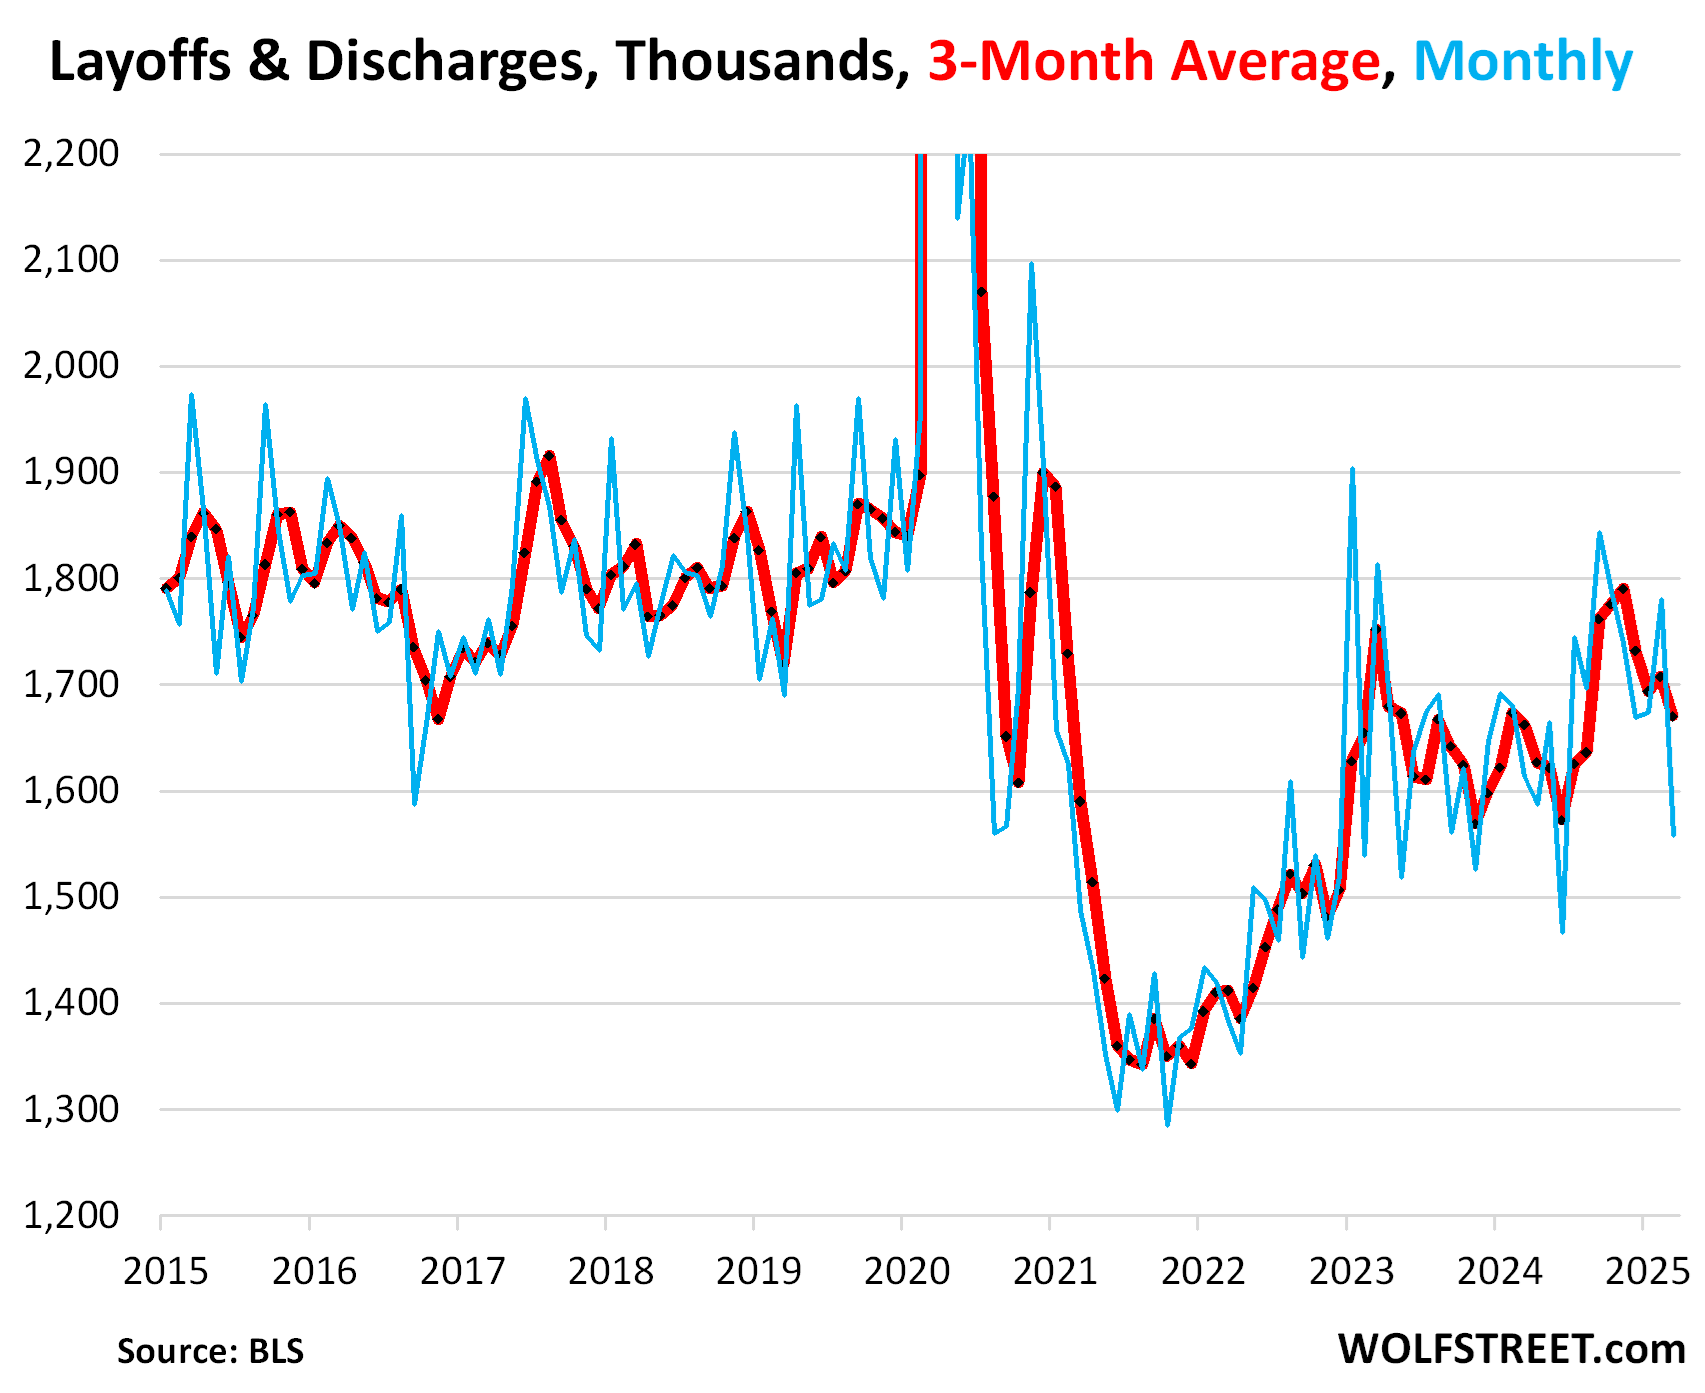
Layoffs and discharges plunged by 222,000 workers in March from February, seasonally adjusted, to 1.56 million (blue line in the chart below), the lowest since November 2023, and far below the pre-pandemic range, despite the layoffs and discharges at federal, state, and local governments that soared to 107,000 workers, the highest since the end of the Census taking period in late 2020.
These are workers who got fired with or without cause – a common feature of the US labor market – and workers who got laid off for economic reasons. But it does not include retirements, deaths, etc., which are in the category of “other separations.” And it does not include people who quit voluntarily to take a better job elsewhere; those folks are included in “quits” below.
The three-month average, which irons out the month-to-month squiggles and revisions, declined to 1.67 million, the lowest since August 2024 (red line). This data from the Job Openings and Labor Turnover Survey (JOLTS) by the Bureau of Labor Statistics today is based on surveys of about 21,000 work locations.
Quits soared by 82,000 workers in March from February, to 3.33 million, the highest since July 2024, despite a drop in quits at government work sites.
These are people who voluntarily quit their jobs – not including retirements, deaths, etc. – such as to take a hopefully better job somewhere else.
At just private sector employers (chart below), quits soared by 91,000 workers, to 3.15 million, the highest since April 2024. The three-month average soared to 3.09 million.
A higher rate of quits means workers feel more confident and/or see better opportunities elsewhere.
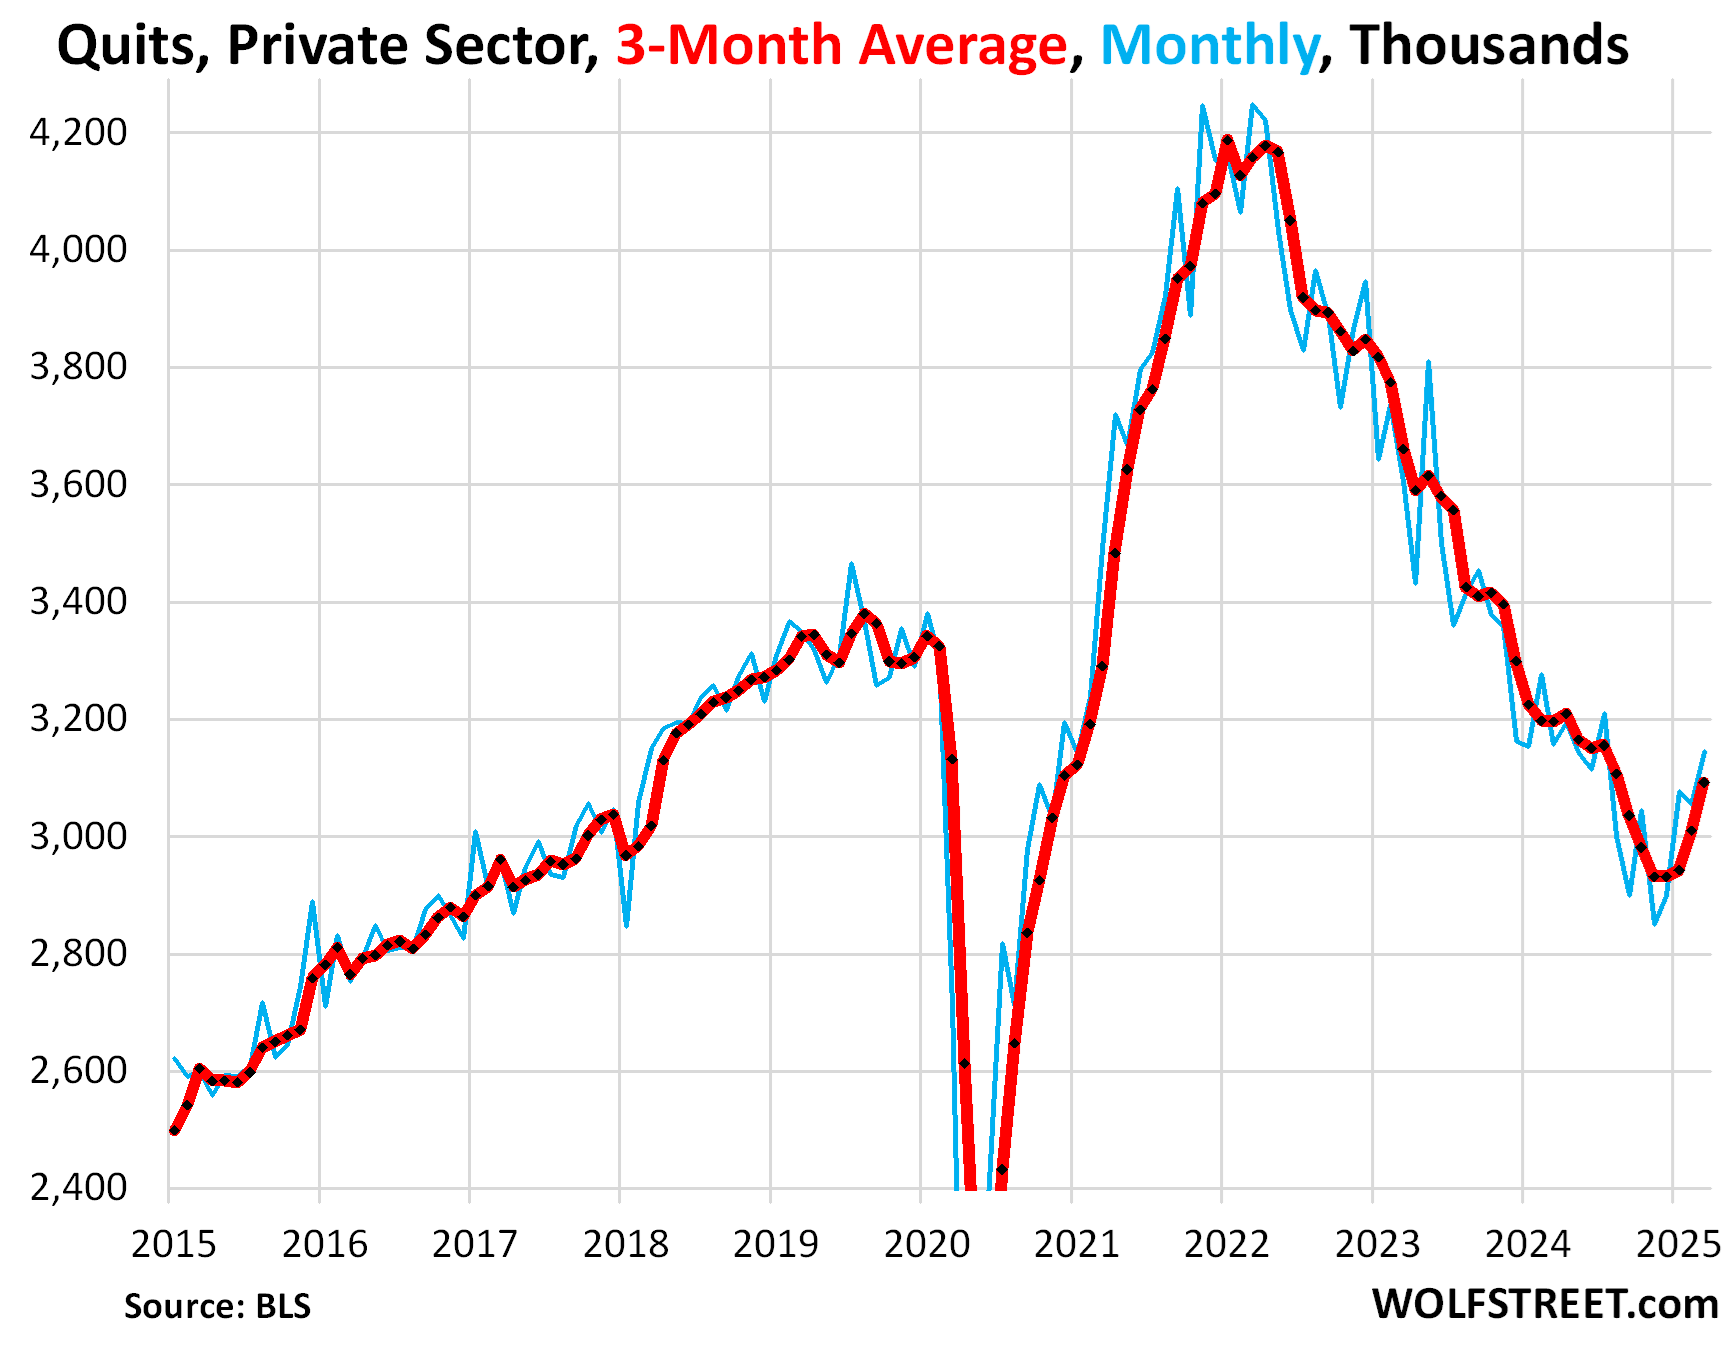
But quits are still below pre-pandemic levels, as employers succeeded in scaring the bejesus out of their employees by announcing mass-layoffs starting in mid-2022, a strategy with which they attempted – successfully, I would have to say – to calm down the enormous churn in their workforce during the pandemic when employees quit jobs in huge numbers, and employers were forced to pay much higher wages to hang on to the ones they still had, and to hire new workers to fill the slots left behind by quitting employees. This churn got to be very expensive and reduced productivity, and employers began to reassert their power in mid-2022 and got employees to hang on to their jobs and be grateful they even had jobs.
These still lower-than-prepandemic quits means fewer job openings left behind than before, as we’ll see in a moment. And for employers, that’s a good thing.
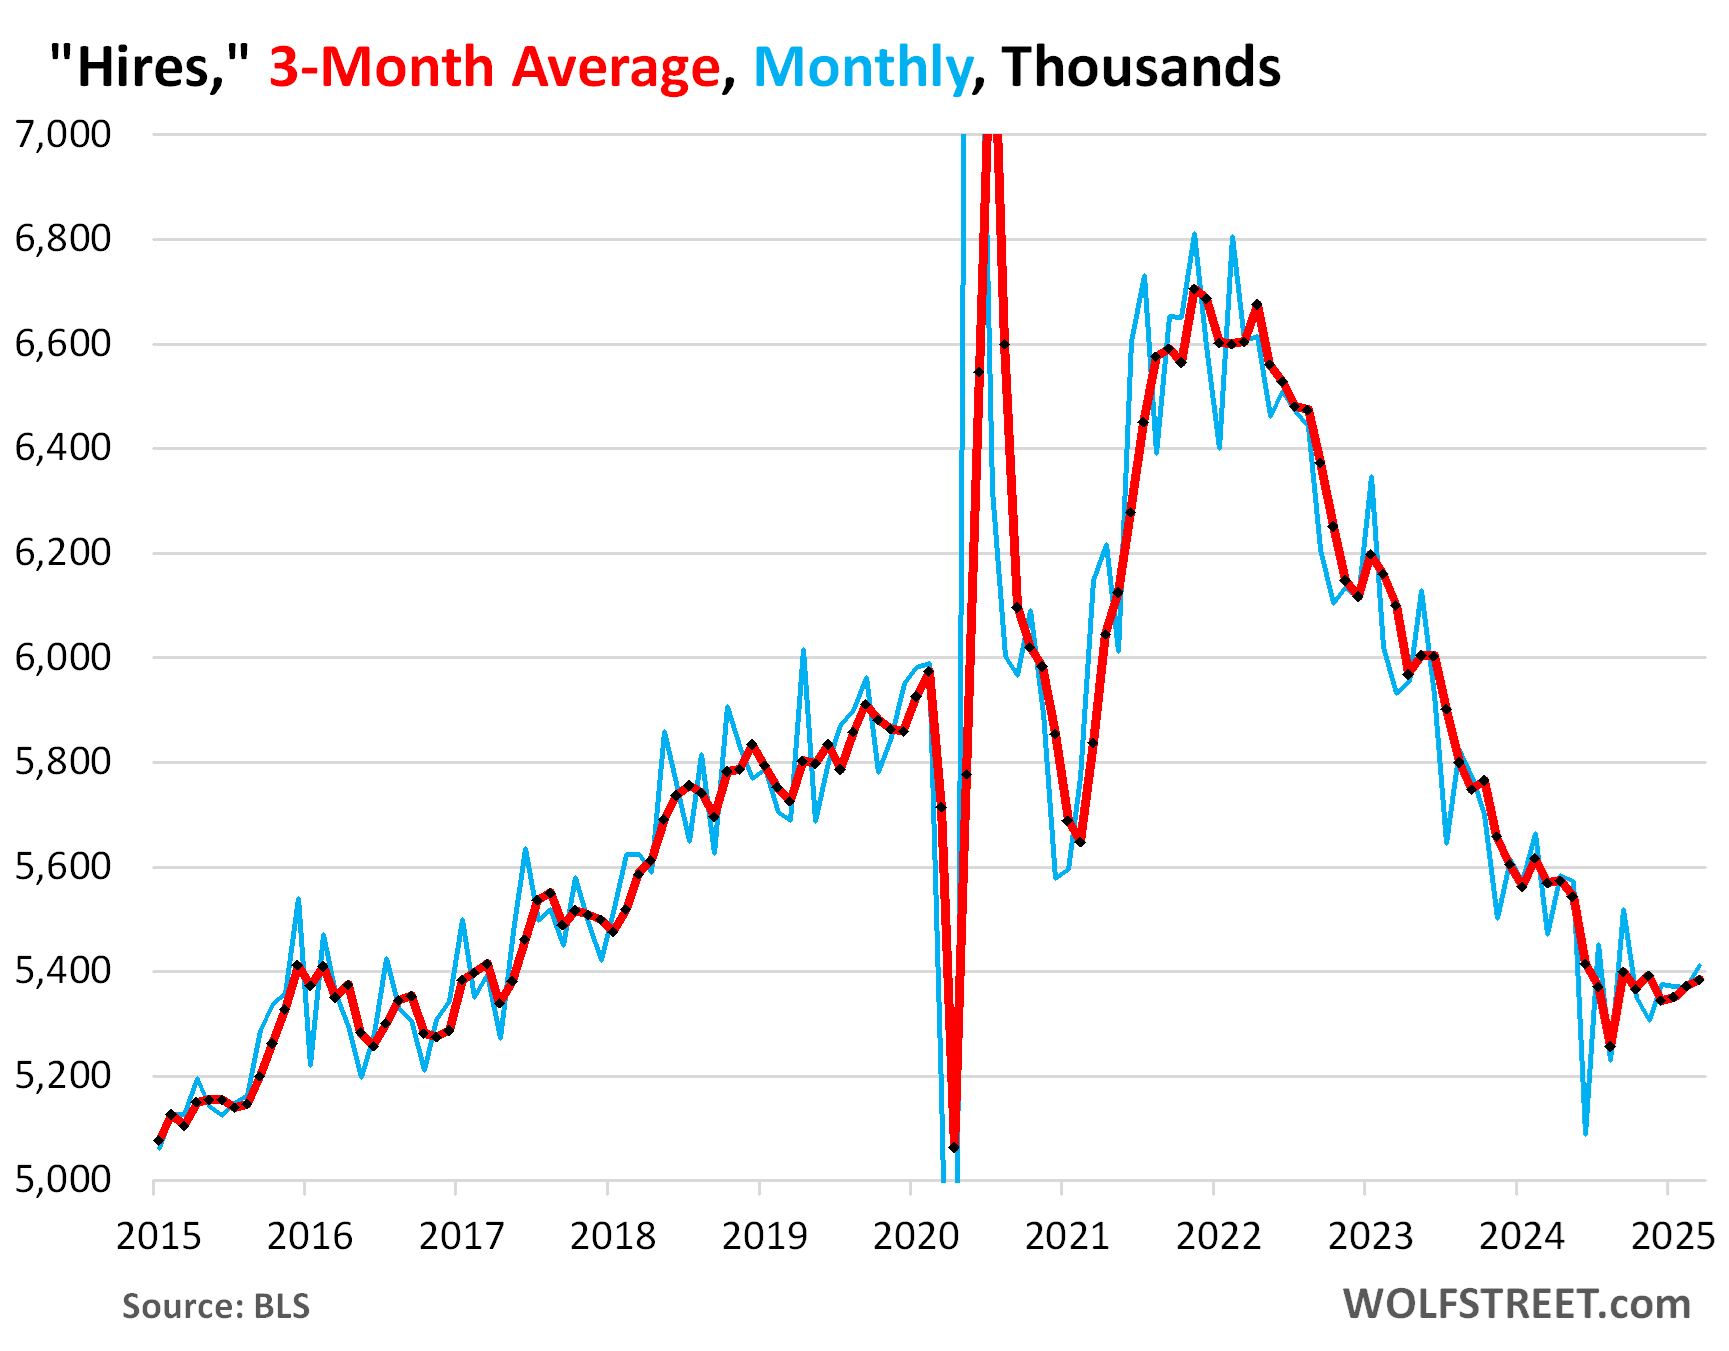
Hires jumped by 41,000 in March from February, to 5.41 million, seasonally adjusted, the most hires since September 2024.
The three-month average rose by 12,000 to 5.38 million, the highest since November 2024.
Labor turnover, or what creates job openings: Employees quitting their jobs, getting fired, laid off, or discharged for other reasons, such as retirements; and to a small extent, employers increasing the size of their staff (as tracked by the nonfarm payrolls).
In March, there were 3.33 million quits and 1.56 million layoffs and discharges, for a total of 4.89 million not counting retirements and other discharges, versus just 228,000 new payroll jobs created (which was a healthy number).
So a low number of quits, layoffs, and discharges leave fewer job openings behind, which explains the drop in job openings. This is not a measure of new jobs being created, but of churn in the labor force — also indicated in the title of the data JOLTS, where the L and T stand for Labor Turnover. And the churn has calmed down.
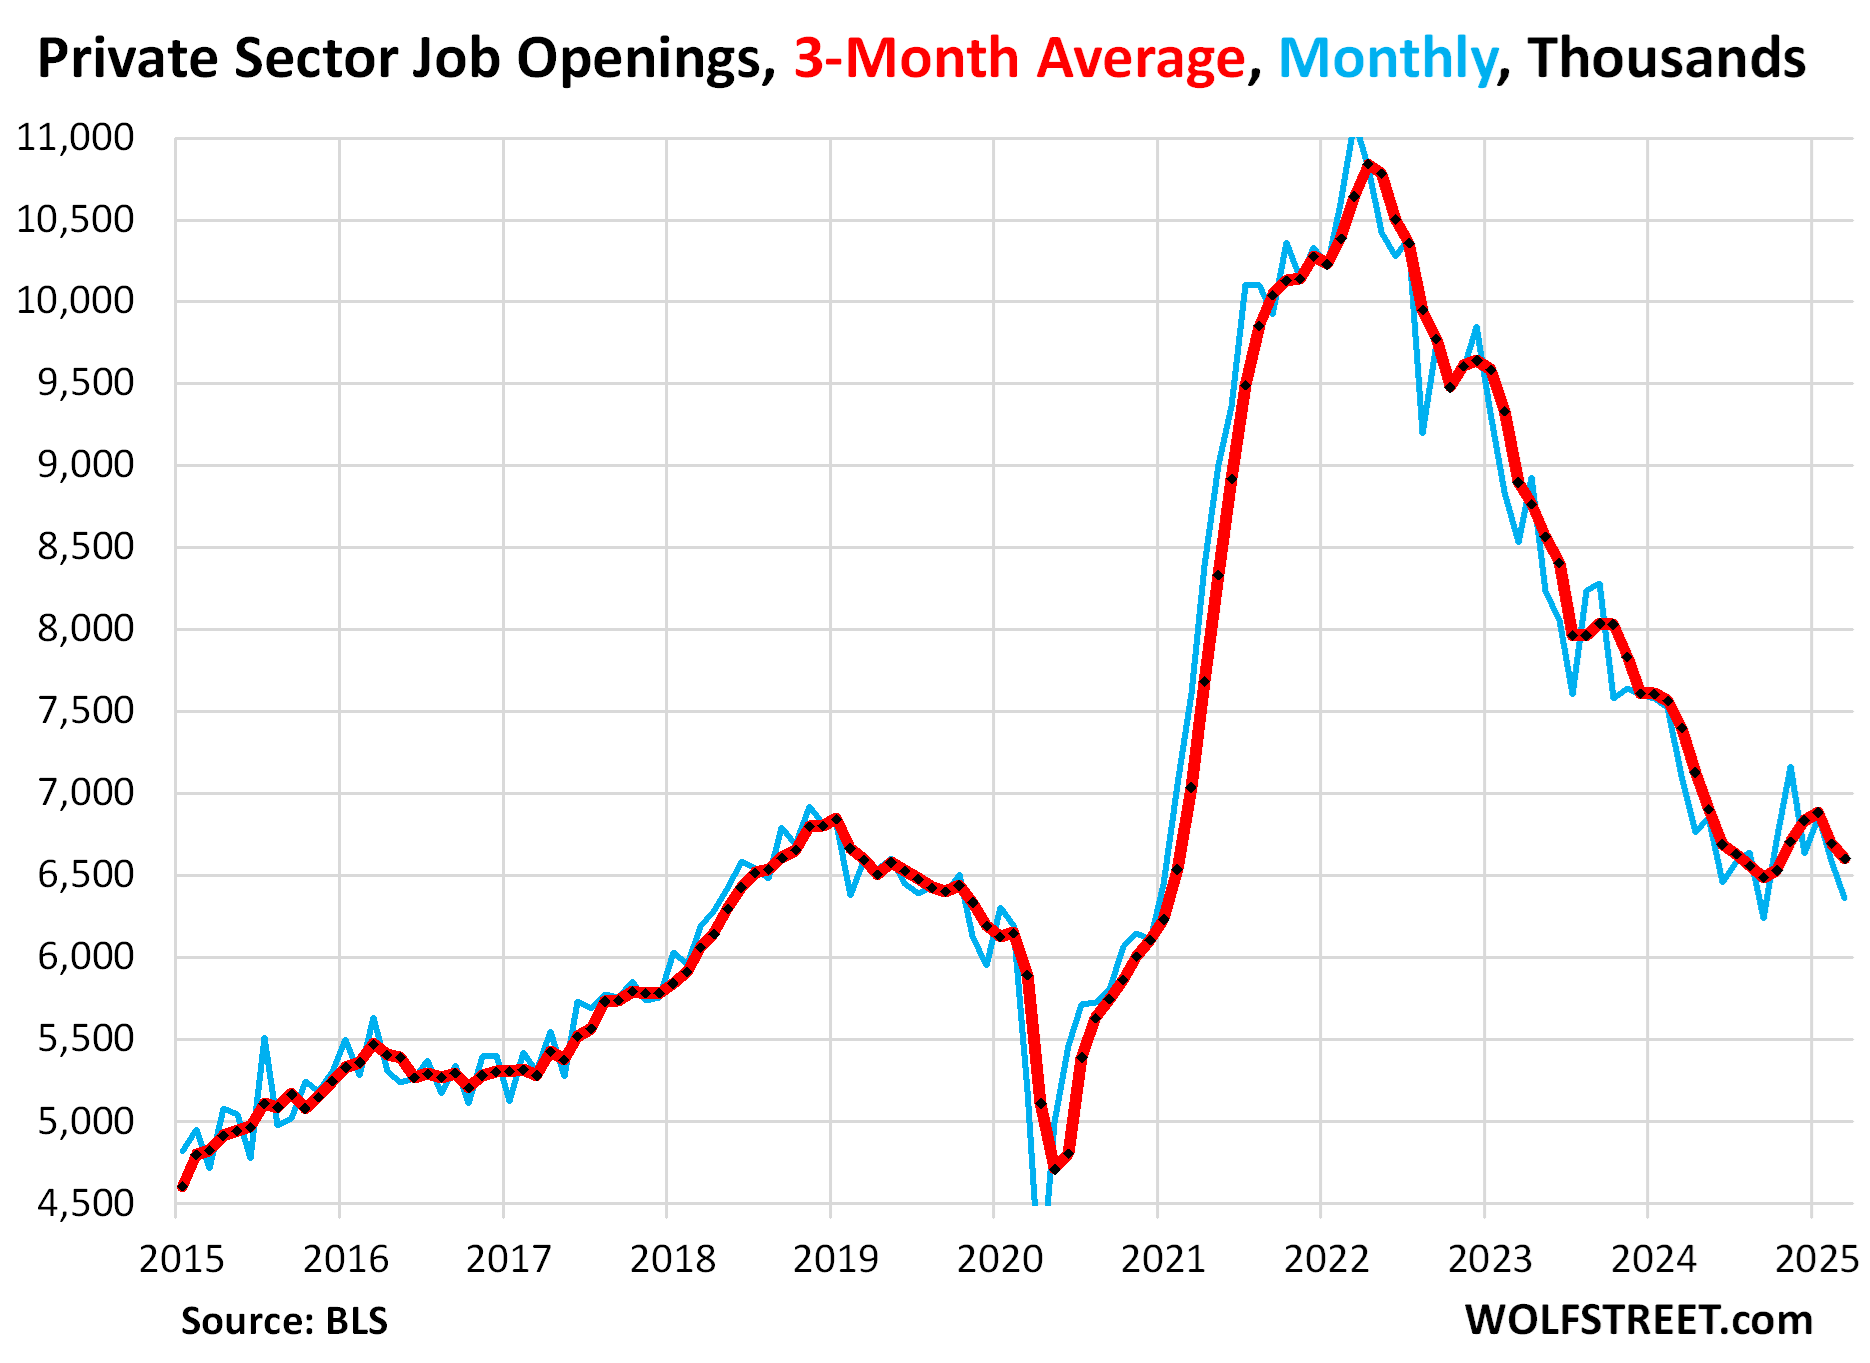
Job openings declined by 288,000 in March from February, to 7.19 million, the smallest number since September. This includes government job openings, which dropped month-to-month by 59,000, to 833,000 openings, the lowest since early 2021.
Private-sector job openings declined by 229,000 to 6.36 million (chart below). The three-month average declined by 92,000 in March to 6.6 million job openings.
This JOLTS data of job openings is not based on online job postings (fake or otherwise), but on surveys of about 21,000 private-sector and government work locations.
Regaining momentum: As the above charts of layoffs and discharges, quits, and hires show, the labor market, which had been losing momentum through mid-2024, started regaining momentum in the fall of 2024, and that turnaround has continued through March.
Enjoy reading WOLF STREET and want to support it? You can donate. I appreciate it immensely. Click on the mug to find out how:

![]()
I quit…actually retiring in July, so count me out!! Leaving behind “for lease” retail space, adding to CRE vacancy rate. It’s all a numbers game.
I’m retiring in 3 more years… my wife wants me out of California.
55 years old seems absurdly young to retire; but I just don’t need the money anymore.
My investments are making more than my salary…
I’m a funds manager. I do the very thing I love to do. I love economics. I’m obsessed with money. Being raised in abject poverty will do that to you.
All the Nvidia, apple, Google, & Netflix Millionaires in their 20’s out here in silicon valley. They think tValley. living the dream. But I’ve been around long enough to know. It’s feast or famine in silicone valley.
Then we had Liberation Day and the soft data has been bad ever since. It’s still less than a month since the bombshell and the uncertainty hasn’t yet crystalised into hard actions. It’s still wait and see, but things can’t go on like this.
The media, from the WSJ to the NY Times, across the political spectrum, the blogosphere, the social media, ALL of them have been LYING to Americans about the tariffs from day one, bombarding them with bullshit and lies and braindead idiocies, ceaselessly fearmongering, every day all day long, in their efforts to sacrifice everything, including the entire US economy, at the altar of high stock prices, fat corporate profit margins, and one-sided globalization. I have never seen anything like that. No wonder everyone is in a sour mood and all the soft data is shitty. But there is an economic reality out there: businesses trying to make their businesses work, and consumers making records amounts of money and spending it, and having fun.
I agree. It’s hard to believe & understand.
Just like it’s hard to believe 55% of Dems would like to see Trump die. Or lots of them get excited when a judge keeps ICE from detaining someone who’s not supposed to be here. Or even people praising Luigi Mangione for killing a UHC executive.
There’s not that makes much sense anymore.
100%. Plus Vance.
It makes perfect sense. Nothing has changed since 1865 when half the country saw William Tecumseh Sherman as a hero and the other half saw him as a monster. The country continues to exist as two halves each loathing, hating and despising the other half with every fiber of their beings.
Are you seriously whining here that 55% Democrats don’t like Trump? I thought it was closer to 100% of Democrats and maybe about 50% of Republicans wouldn’t care if Trump died. Big deal. It seems that Trump didn’t care either.
Would you have cared if Biden died?
bet you there are a bunch of gig workers exiting out door
Appreciate your comments and insights Wolf, I think you’re spot on.
Keep going
Howdy Lone Wolf. “businesses trying to make their businesses work, and consumers making records amounts of money and spending it, and having fun. ”
AMEN Thank You for that
All is good, Bubba, the sky is blue, stonks are going back up, houses are plentiful, there is a chicken in every pot, Musk is going back to rule Tesla, and you can buy a CyberTruck without a wait.
This is America….remember!
I’m like many late boomers
working for last bit before exiting
in last couple years with costs going thru roof
I keep plugging away, putting as much away as possible
but it all seems to go poof at end month
those pesky $7k-$10k month cc bills
bought 2 sticks 1″x3″ tube steel yesterday(20′ long)
$150
and property insurance/auto insurance – almost had to cancel purchase due to lack of affordable insurance
You, sir… I can find no objection to what you say.
I can criticize the media for their blather all day long, but I come here and I just learn. You bring the numbers, they bring the bs.
As if we ever had a crystal ball to begin with. It’s never certain; uncertainty is just a buzz word they’ve used to convince people to sell equities on fire sale, and we saw the winners of that trade in Q1.
And to act like business people are just sitting on their hands with nothing to do until certainty magically appears again… shameful reporting.
i haven’t seen anything like it either, and for the first time in my adult life, it’s making me wonder whether the first amendment needs to be curtailed.
the top 1% who controls the media, wall street, and academy have basically gaslit the american people into believing that what’s best for them is what’s best for america.
it’s their ideas for the last 50 years that have gotten us into this mess.
Franz G,
“. . . whether the First Amendment needs to be curtailed.”
In September 2022, PEN America celebrated its 100 year anniversary. For five nights in a row, sixty authors’ quotes were illuminated onto the four sides of Rockefeller Center. “Speech Itself” celebrated PEN America’s defense of the written word and the fundamental right of free speech.
My wife had two of her quotes projected onto Rockefeller Center for this celebration. She has been locked up in prison for sixteen and one-half years, to the day, now. But she writes. Her words carry power. She can speak to the world because we have a Bill of Rights, for now anyway, in the USA.
Here is my favorite quote of the two:
THE POWER OF WRITING
CAN BE USED TO
ENLIGHTEN
OR IGNITE OPPRESSION
WHILE WE CANNOT
FORCE PEOPLE TO
ABSORB OR CONNECT
WITH OUR WORDS
WE CAN WRITE
AND KNOW THAT
WE PLANT SEEDS
AND THE GARDEN
WILL COME
Franz, do you want to be a free individual? Or do you want to be controlled and submissive to the will of the collective that holds political power at any given time?
Please think about those questions when you wonder if free speech should be outlawed in the USA.
Wolf Richter has, and uses to great effect THE POWER OF WRITING. Thank you, Wolf.
Prairie Rider,
I think you missed the overall point. When a few own almost all the means of communication then their is a problem. In the Internet space algorithms control what you are or will be exposed to. It is purposeful and of course the reason TikTok was almost banned and other media companies bought.
Think of it like ghost kitchens on Door dash. They serve all the same food but crowd out the smaller businesses. Media is no different. This is of course nothing new as plenty of examples like Citizens United, which wasn’t the beginning but certainly opened the door further to abuse.
Glen,
1st
Congress shall make no laws respecting an establishment of religion, or prohibiting the free exercise thereof; or abridging the freedom of speech, or of the press; or the right of the people peaceably to assemble, and to petition the government for a redress of grievances.
glen, you got it. prarie rider, the constitution is not a suicide pact.
the point of the free press clause is to allow the media to report on reality. not to create the reality it then reports on.
To Glen and Franz,
I respectfully disagree.
Franz G – Free speech should remain and always be free.
Libel should be sued to the full extent of the law, especially that spewed by media, celebrities and politicians who believe they are immune. The same goes for inciting violence.
The media is bankrolled by the advertising industry and who pays their bills? Corporate America, if you follow the money it all makes sense.
Effect of tariff hasn’t been felt yet. It is too early to say tariff has no impact on businesses and consumers. Importers have built a buffer that can last awhile but if you order directly from overseas, you see the tariff immediately. Attacking fat corporate margin is no way to drive prosperity. Consumers are not having fun when the prices are getting higher. This morning Trump’s attack on Amazon is not out of vacuum. Amazon, Walmart, Home depot, Target are facing the squeeze. Trump can reduce tariff based on who is begging. Yesterday it is the cellphones. Today is the automotive. Tomorrow will be what category?
OH, tariffs WILL have an effect, the primary effect being that more production is shifted to the US. Big companies like Apple refuse to produce in the US because they cannot dodge US income taxes if they do. By producing overseas, routing the profits to Ireland, and selling in the US, they avoid US income taxes. Too bad Trump didn’t lower the boom on Apple.
And sure, I have said from day one, tariffs will squeeze the record-fat corporate profit margins and are bad for record-inflated stocks. So what? I told you that months ago.
Agreed Wolf. According to the MSM, every silver tariff lining has 50 clouds. And each one of those clouds is fully capable of having a huge negative impact on the entire US economy.
One of the most pervasive (and sensational) MSM lies is that tariffs will be completely passed along to the consumer. In other words, a 25% tariff will automatically mean a 25% higher market price. As you’ve correctly pointed out in the past, the free market will not necessarily tolerate a 25% higher price.
Only the market will decide how much of a price hike is possible without a commensurate sales decrease. If sales decrease beyond a certain point, both the producer and the importer/retailer will need to decide how the tariff cost will be absorbed/distributed. By that sales decrease, the consumer has made it clear a 25% price hike will not be tolerated.
I’ve not once heard that fact mentioned by the MSM coverage.
Some friends of mine and I have an ongoing joke. Suppose Trump cured all types of cancer today. What would be the MSM headline tomorrow? Here is one possibility:
“Oncologist unemployment surges after cancer cure is found.” That headline would be followed by an interview with a now-unemployed oncologist lamenting his newly jobless status and the heartbreaking loss of his 500K annual income. The overall content insinuation would be the cure is a negative and should be viewed as such.
Thank goodness fewer Americans are listening to the MSM and finding more credible sources of information.
Longtime reader. This comment alone has gotten you a new paid subscriber. Thanks for stating the obvious, but sometimes telling the truth in a world full of madness is all sane people (like me) are looking for. I have always come to your sight to read facts. Not always what I want to hear, but facts nonetheless. Many Thanks Wolf. In the land of the blind, the one eyed man is king.
From a really, really, really high level….does it really matter, Wolf (e.g., he said, she said)?
Ultimately, the markets lost some 10ish % up to today, and for a hot minute, quite a bit more (closer to 20% and who knows what the next few months hold).
Whether the media is blatantly wrong and you are right, and tariffs ultimately work…or they blow up in our face and you are wrong, the markets are still down (and that’s all people really care about…cost, value, and worth) andddddddd no one really knows how this will play out, especially those of us commenting here, and you.
I have said from day one, tariffs will squeeze the record-fat corporate profit margins and are bad for record-inflated stocks. So what? I told you that months ago.
https://wolfstreet.com/2025/02/03/what-trumps-tariffs-did-last-time-2018-2019-had-no-impact-on-inflation-doubled-receipts-from-customs-duties-and-hit-stocks/
One issue is how do you measure whether tariffs ultimately work. I would argue tariffs “work” if they significantly increase US based production and/or generate significant revenue.
The performance of the stock market, which I doubt most people care about (the bottom 90% of the population by net worth owns roughly 7% of stocks by market cap), doesn’t measure whether tariffs worked. People often think their situation, which is usually similar to most people they associate with, is representative of all people. That’s why people in certain income and wealth classes often mistakenly think markets are all people really care about.
Gdp -0.3% today. Some of that BS was justified after all.
BS-monger. GDP, as I said many times it would, declined a little due to IMPORTS. Tariffs will reduce imports eventually, that’s their purpose. But Q1 had a record surge in imports. Do you just spread BS without ever looking at anything?
It easy for me to believe there was a true surge in imports. In my circle I know multiple folks who ran out to buy new IPhones before the tariffs hit. That’s just one product, but it evidences broader thinking. I would be surprised to see it extend to auto sales.
Wolf-
I will have to respectfully disagree with you on this. I’m actually a pretty big critic of “free trade” (no such thing) ever since Reagan really put things into overdrive.
But the way to bring back industry is through targeted, gradual tariffs that give industry and the economy time to adapt with minimal disruption. Trump’s blanket tariffs that change on a daily –sometimes hourly — basis is not the way to do it. No sane business is going to plan a 5 year billion dollar factory investment based on which side of the bed Trump woke up on that day. And starting with punishing our allies was a horrible strategy if we wanted a coordinated global response to China.
Trump’s tariffs will not bring back industry. All it will do (has done) is convince everyone in the world — including American companies — that long term investing in America is a risk not worth taking since there is no stable, rational policy environment. All that Trump has done is incentivize our former allies to figure out how to wean themselves off both American imports and exports, and start trading with the rest of the world. Even in four years if someone sane comes back into power, after trade patterns have been reworked, no one is going to go back to doing business with America and risk another idiot in charge four years later.
Just ask farmers how much of Chinese demand came back last time around after Trump’s first fight with China in his first term. The answer is very little. Once China started buying from other countries, they had little incentive to go back to American agriculture imports even after the trade war settled down. Now multiply this by every industry in every country and you can see the long term damage that Trump has done for very little gain.
Ironically, the only lesson that businesses are learning is that, rather than investing in their business, it makes more sense to invest in politicians. When the tariffs were started, Tim Apple didn’t all of a sudden build a factory in America. He bribed Trump to get an exemption. Businesses are understanding that as long as you pay off Trump, he’ll favor your business (maybe even hawk your products direct from the White House lawn a-la Tesla), and that’s far cheaper and easier than doing the hard work of relocating your factories. IOW, Trump is turning our country’s economy into Russia’s, where favor with Putin is far more important than a sound business plan. Surely you don’t think an economy based on oligarchs competing for favors from the president rather than with each other to build better products is where we want to end up?
“Trump’s tariffs will not bring back industry.”
It’s already doing that.
1000 likes!!
I agree with you Wolf. That’s why we follow you.
I stopped reading WSJ after the 2008 bail outs. 2008 was the year laissez faire economics died…. maybe it was 2001, but I didn’t catch on till 2008.
I’m still Heart broken about it. I hate fat cats who cry about Lehmans bank.
Lol that’s a lot of emotion. Having lived in a high tariff place where government tries to promote local production by restricting imports, I’d say buy a blender now and then see how this plays out.
I’m enjoying your data analysis immensely. But I’ve always thought of wolf street née the testosterone pit as libertarian
Hard to see how mercantalism and autarky will go well but hey, good thing the trump administrator is jam packed with highly experienced, competent and reasonable actors.
India has 110% tariffs on imported cars, for example. If you want to sell cars in India, you have to make them in India. And the funny thing is: automakers don’t whine about it. They set up shop and make cars in India. If Apple wants to sell phones in India, it has to make them there, and it does, not biggie, right? China has big enough tariffs on cars to where anything that is price-sensitive has to be made in China. And automakers scrambled to do that just that. Japan as administrative layers of protections that are so costly to deal with that it has been nearly impossible to sell mass-market cars in competition with local automakers. But high-end luxury cars that are not price sensitive and don’t compete with mass-market local cars can be sold (in small volume because there isn’t a lot of demand for these cars). The list goes on and on. That system has benefited those countries immensely at the expense of the US.
The culprits are not those countries though – they’re just doing what’s good for them – but Corporate America which is always in search of the highest profit margins, and they have sacrificed the US economy on the altar of high stock prices.
Now the government has $36 trillion in debt, and no one knows how to deal with it. There are no free lunches when it comes to money. When you run these huge trade deficits for three decades, there are consequences: the money flows for those imports have to come from somewhere. Hence, the twin deficits. They’re connected through money flows. It’s time to crack down on those abuses and rebuild production in the US. And it’s already working, and that started in 2022, it’s exciting to watch happen, but it’s a long slow process for a huge economy like the US.
I have always lambasted US trade policies and Corporate America when I discussed at least annually and sometimes more often that huge US trade deficit, and you would have seen that in my articles in past years. That has been a standard feature here:
https://wolfstreet.com/2025/04/30/q1-gdp-whacked-by-massive-spike-in-imports-on-tariff-frontrunning-consumer-spending-grew-business-investment-soared/
Seasonally adjusted initial jobless claims totaled 241,000 for the week ending Apr. 26, up 18,000 WoW — and significantly higher than the estimate of 225,000. The 4-week moving average was 226,000, up 5,500 WoW. Continuing claims rose to their highest level since Nov. 2021.
LOL? They’re fine. These are LOW numbers. If you want to imply otherwise, you’re clueless. Look at a long-term chart!!!! Over the past two years, there were many weeks when initial claims were well over 241,000. In the 5 years before the pandemic, there weren’t weeks when initial claims were UNDER 241,000. And now 241,000 is suddenly alarming?? You people need to get a grip.
Soft data is soft because it is limp and doesn’t please anyone lol
Wolf – my brain/memory are running behind my coffee and meds this AM, so I hope you’ll forgive a question you’ve doubtlessly answered in the past – is there sub-data in the labor stats reflecting those in service vs.industry vs.other sectors? (not asking for more charts, just curious).
Many thanks.
may we all find a better day.
Yes, there is, in terms of industries. The real weak point is government. That’s now a trend, not a monthly squiggle.
Wolf,
1) The G as weak point may be a trend for the last few *months* but I’d be willing to bet a fair amount that the G was an extremely strong grower (percentage of the whole wise) over the last 3-4 years (especially from mid 2023 until December 2024).
From mid 2023 to December 2024, what percentage of payroll jobs added were at local/state/federal G level (not even including G paid contractor army) or in heavily G subsidized sectors (healthcare, where the G pays about 50% of all sector revenues).
2) “In March, there were 3.33 million quits and 1.56 million layoffs and discharges, for a total of 4.89 million not counting retirements and other discharges, versus just 228,000 new payroll jobs created (which was a healthy number).
I *really* don’t want to start a fight in an area of long standing personal confusion (JOLTS numbers) but I’m honestly just trying to get some clarity here – are those 3.33 million quits and 1.56 million layoffs actual *monthly* numbers (like the new *net* payroll job adds) or are they *annualized* numbers (in which case, why are they placed in the context of the *monthly* payroll adds).
If those *millions* are in fact monthly, that would mean that something like 39 *million* quits happen per year (out of maybe 165 million total jobs) and 19 *million* layoffs occur per year.
That would be an astronomical amount of churn. About 58 million employment turnover per *year) – well over 33% of all jobs.
That just doesn’t seem possible to me.
What am I missing?
cas127,
1. “…are those 3.33 million quits and 1.56 million discharges and layoffs actual *monthly* numbers” like the new *net* payroll job adds) or are they *annualized* numbers…”
They’re monthly numbers, out of 160 million nonfarm payroll jobs. Yes there is a lot of turnover in the labor market. Lots of younger workers change jobs every year or two, during the pandemic more often. Companies have to constantly hire to replace people who left or were fired. It’s a massive constant flow. And it was back in my day of having to deal with hiring.
2. The vast majority of local government employment is teachers. The vast majority of state government employment is in education (state colleges and universities) and healthcare.
3. Federal government employment as percent of total employment has dropped below 1.9% of total nonfarm employment. It’s just a small part of total employment (the spikes are during the Census taking periods), but you can see the mini-surge during the Biden administration:
Wolf,
Thank you for the response.
1) 58 million jobs turning over *annually* in a 160 million payroll economy is mind-boggling.
I suppose my perceptions are shaped by the (not that) old estimate that people change jobs every 7 or 8 years – which would yield 13-14% annual turnover – not 35%+.
35%+ vs 13-14% is simply mind-boggling.
*Maybe* in 2020-22 pandemic chaos and snap-back, but *now*?
2) Yep – I agree that teachers dominate the (very large) local government employee ranks (about 14-15 million total in US or 9% or so of *all* employees). Ditto for higher ed and healthcare at state level (which has 5-6 million employees of its own, nationally).
But those numbers don’t get at the story of the last 18-24 months – which if my reading of BLS stats are right, show that local and state government hiring has played a notably dominant role of *all* hiring.
That matters because if the G has been aggressively (if very quietly) using local/state government hiring as a Keynesian lever (ahem) to goose *total* reported job gains beyond what they otherwise would have been, that is likely unsustainable (where is funding going to come from?) and had/has profound political consequences.
3) I don’t disagree with the Federal *employee* stats – but they do ignore the significantly larger army of federal-paid government *contractors* (at about 6 million) and the literal Army (and rest of US military) at about 2.2 million.
Those numbers matter macro-economically because all those G paid employees (explicit employees, contractors, and military) are all directly paid from the same source – the heavily, heavily indebted Federal government (who has only been able to keep the whole (ahem) show going by printing money (QE1, etc.)
1. I’ve had a bunch of jobs of 1-3 years. The longest I’ve ever had a job was 10 years. It’s not until I started my own shop here that I got nailed into place.
2. there was a massive teacher shortage during the pandemic around the country. Teachers just quit. And lots of them started working outside of education. It took a long time for schools to staff back up. That’s the surge in hiring you’re seeing.
Sure seems ‘off’ relative to news items. UPS laying off 20,000. Among many other similar, albeit smaller, stories.
Did you microwave your brain this morning??? Read the article whose headline you linked. It says that UPS lost or gave up much of the Amazon business over the years, its largest customer, because Amazon has increasingly switched to its own delivery services (mostly handled by contractors). FedEx has the same problem. And I see the Amazon-branded vans (driven by contractors) a lot more than the UPS vans. Contractors also use their own vehicles that are not marked, but often wear an Amazon vest. That’s a UPS problem, having lost its hugest customer, and not an economic problem. Read the articles before you stick braindead headlines into here to spread your narrative, you dufus.
Note to self:
Read the articles to avoid being called a dufus.
😁
Amendment to note to self: Read the articles whose headlines you post into here!
Amazon is more a competitor
to UPS, FedEx, and USPS instead of
a customer. Perhaps the tariffs
will slow their predatory business
practices.
Howdy Sporkfed. Just canceled my Amazon Account. Now if I can only find what I need ” Made in the USA ” May not be buying as much stuff for awhile and will just give more $$$ to the kids…….
Sporkfed,
I wonder how much of Amazon putting the “cost of the tariff” is really just a way to raise prices and put it on somebody else. I am sure somebody will do the analysis.
glen, that’s true for most businesses. god forbid they eat into their fat margins.
Glen/Franz,
Reminds me of how sales taxes in Japan used to be included in the ticket price like most other countries. After multiple tax increases by Abe, they started listing the taxes separately, like we do in most US States.
musssyke, i think in the u.s., taxes must be broken out since they vary by town, city and state. a chain store or restaurant can’t really publish pricing on an after-tax basis if they had to account for taxes varying from one place to the other.
that said, it’s usually just hotels and parking where you see taxes that far exceed the standard rate.
I think the discussion of other *tax* breakouts puts its finger on the crux of the Amazon/tariff controversy.
The way I read the initial reporting was that Amazon was going to go out of its way to *highlight* the tariff impacts by prominently putting tariff costs *next to* the *individual* upfront costs.
Amazon has never done anything like that with the multitude of G taxes…which get reported, in aggregate, once, at the very end of the sales process.
So the whole trial balloon stank of disparate political treatment, trying to gin up political opposition to the tariffs (vs. every other historical G tax/spend priority).
And while I wouldn’t exactly call Amazon *predatory*, they have super, supercharged a “dropshipper”/retailer-low-value-add trend in US while skimming off a very, very hazy mark-up of the true “China price” over the last 20+ years.
So it ain’t like Amazon ain’t being playing a big role in the intl macro dislocations over the last 20+ years.
They ain’t a disinterested actor.
(Early, similar-but-not-identical dislocation accusations were leveled at Walmart – but Amazon has relied upon *foreign-produced* goods coming in from a WTO-rip off artist (China) to a much greater extent – and to much lower US benefit (at least Walmart has many, many more physical store employees in the US).
*How* the Chinese have utterly gamed the WTO rules (and how DC has let them for 20+ years) is the true crux of the whole present crisis.
Worthy of whole series of Wolf posts…
Also UPS sucks. I will not order from a company who only ships UPS and I tell them so. I order shoes once in a blue moon from a company that shipped UPS. I told them to change to Fedex because UPS sucks, or I will order from someone else. The rep said they had been getting a lot of complaints about UPS. I ordered shoes a few weeks ago from them and they came by Fedex.
BTW, small typo: “Hires jumped by 41,000 in March from February, to 5.41 million, seasonally adjusted, the most hires since September 2004.” Maybe should be 2024 instead of 2004.
This is a real good point. I read the UPS headline this afternoon and had negative the sky is falling thought, the counter is usually another business is growing to offset the loss. Just because bad for one business doesn’t mean net bad for the economy necessarily.
Most of my orders (from all online vendors, not just Amazon) now come via USPS. Originally it was mostly last mile deliveries but now more and more are coming USPS from the origin point. It’s rare that a package is delivered UPS or FedEx these days. (USPS, BTW, though not speedy, and with poor online tracking, has proved very reliable.)
I ordered an expensive (at least for me) smart watch last week and it came portal to portal via USPS. So not just cheaper items.
You people seriously latch onto every negative headline.
Wolf..I would be lost without your factual analysis…spot on about the vans too..even out here in western va., Let the market decide..!!
Thankyou, President Trump. And their will be more great economic news yet to come!
There*
Good, now looking forward to seeing all those tax receipts! The Red Team has full control, they have no excuse for not balancing the budget.
are you insane or just trolling? do you really think anyone can transform a $2 trillion deficit to 0 overnight?
Just stating facts. Never said anything about “overnight”, that’s you trolling.
A journey of a thousand miles starts with a single step. Time for CONgress to be held accountable.
OK, how long does Congress have to balance the budget? Do you think it’s possible to balance the budget by the mid-term elections? The very narrow majority in the House, and the not even close to a filibuster proof majority in the Senate, will impact budget negotiations. As it is, the recently passed Continuing Resolution required the votes of Schumer and several other Senate Democrats. Team Red has less control than you seem to think.
rojogrande
Completely missing the point.
A journey of one thousand miles begins with a single step. Look at what congress just did, they are not even making an effort to cut spending and increase revenues. That is what needs to happen, period. It’s not personal, it just math. They are doing the exact opposite. Congress just proposed to increase spending and decrease revenues.
Hedge accordingly
WB,
If I did miss your point, it’s because your point changes significantly from one comment to the next. Your “point” is very flexible that way. You originally said: “The Red Team has full control, they have no excuse for not balancing the budget.” Then you say “A journey of one thousand miles begins with a single step” and complain Congress is proposing to increase spending and decrease revenue. Those are significantly different “points” (cutting the budget deficit versus balancing the budget), with completely different policy implications.
I doubt Franz G would have replied originally, and I certainly wouldn’t have subsequently, if you had originally commented that Team Red needs to cut the budget deficit. It was your call for a balanced budget, seemingly in the very near term given the election calendar, that didn’t make any sense to me given the scale of the deficit and political realities. That’s why I asked how long you’re giving Congress to balance the budget.
I predict small tax cuts and minor changes to Medicaid with large ongoing deficits. And media howling about the Medicaid cuts that still leave benefits far more generous than 2009.
Wb,
The blame game is pointless. I could easily say the democrats could have eliminated for profit health insurance but then a few hundred grand thrown at a few players like Lieberman failed to get the votes. Neither side really has any other interest other than serving their own. America is simply facing a likely long slow decline where red and blue argue all the way down. Admittedly, both parties are great at playing the game and are comfortable to yield control back and forth as long as status quo is not questioned.
Not “blaming” either party, DUH, they are BOTH responsible. Just pointing out a fact. If the republicans actually acted responsible, right now, they could, in fact, pass a balanced budget, and there wouldn’t be a damn thing the democrats could do about it. The fact that they are not, and actually are increasing war spending should tell everyone all they need to know.
Interesting times.
Hedge accordingly.
Do you have figures for number of retirements?
The numbers are small. “Other separations,” which includes retirements and deaths (while employed) declined by 15,000 in March from February, to 225,000. Of them, 183,000 were in the private sector, and 42,000 in government. Not seasonally adjusted.
These “other separations” are down about 25% from the peak in late 2021.
Is there any good way to get realistic numbers on the underground/not paying taxes on it economy.
Being in the trades I do know it is a large part of the economy and even though “underground” folks do buy a lot of stuff that helps the “above ground” economy chug along,along with the cash being used by the workers that effects the “above ground” numbers.
This is irrelevant here. This is about employers and employees, all of them above ground. This has nothing to do with the underground economy, independent contractors, day laborers, etc.
Wolf,
I am in manufacturing R&D for last 20 years and I have seen companies after companies closing their shops and heading to Mexico and China. I have been to China and Mexico many times and you can see how we have helped those countries immensely. I am all for bringing back manufacturing (some, not all) but I question the way our president is doing. Any way, my question is around Warren Buffet and he is holding record amount of cash in treasuries. You made a comment that media is playing a game and causing panic when job market is strong and consumer is spending. Can you comment why Buffet is holding on to cash? So many articles written on it. Is he waiting for crash and if he is waiting crash then where do you think it will come from? We will need job losses in millions for a true market crash where we get 20-30 percent dip. Thanks.
Buffett: Stocks are ridiculously overpriced. They’re going to come down hard, and after they come down hard, there will be buying opportunities.
And I agree with that.
The stock market has for years been separated from the economy – to the point where it’s now unrelated to the economy. The economy grew 2-3% a year, while stocks soared 15%-25%, year-after year 🤣🍾
Funny thing too is that people really believe this will go on forever. If you could get those kinds of returns without risk in stocks, nobody on earth would buy treasuries or bonds at all.
Marty Zweig’s old chart from the 1990’s:
DJII average drawdown and frequency from 1926 to mid 1990’s:
-10%…..every 1.5 years
-20%…..every 3years
-30%…..every 6 years
-40%(+)…..every 10 years
(From memory, but the shape is about right. Would appreciate correction if anyone else saved the actual chart. I have it stashed somewhere…)
Worldwide monetary and fiscal interventions dampened the declines and reduced volatility, especially over the last 30 years. Buffet logically anticipates a return-to-the-mean episode. He studied under Ben Graham, after all.
QE 3.0 is comin’, Baby!
Your assessment of the US economy seems to be made with rose-colored glasses. 👓
However, as good or bad as the economy is right now, can you imagine the chaos that lies ahead when the stock market correction/crash that Buffet refers to happens – there will be a lot of people with a lot less money. Also, pension funds, 401-k’s IRA’s will be decimated. Will pensions go bye-bye, or will they just get a major haircut? Time will tell. Too bad the go-bar-mint stood by while Wall Street made the stock exchanges more profitable and more corrupt than the casinos in Vegas. The average working man and woman will be the ones who pay the price. .
“…can you imagine the chaos that lies ahead when the stock market correction/crash that Buffet refers to happens…”
Yes, I imagined what happens, and spelled it out right here. I’m on record saying that a large stock market decline will cause a recession, such as the 50% S&P 500 plunge and the 78% Nasdaq plunge from March 2000 to Sep 2002, which triggered a run-of-the-mill recession in the middle of it, and then the stock market continued to crash, even as the economy was in recovery. It took the Nasdaq 15 years and lots of money printing to get back to its old high. Click on it:
Will Economic Detox Lead to a Recession? Maybe Not. But a Long Deep Stock Market Rout Will (See Dotcom Bust)
The price was paid by average investors, big investors, the smart money, the dumb money…. But people with little exposure to stocks, and all those who weren’t living in San Francisco and Silicon Valley, might have never noticed if they didn’t watch TV.
Note that the stock market crashed on its own starting in March 2000, imploding under its own weight, even as the economy was rocking and rolling along in high gear for another year-plus before the stock market losses triggered the big spenders and imploding dotcom businesses to cut spending, and the recession started.
Just to clarify, the “price” of the stock market soared, so does that say more about the underlying currency or the actual value of equities or some combination of both?
WB,
The GDP growth figures I gave you were adjusted for inflation (the “underlying currency” as you called it), so that’s already included, but the stock market figures were not adjusted for inflation. I should have cited nominal GDP growth rates which were in the 4-7% range for a fairer comparison.
Thanks Wolf,
I always try to point out to people that nominal yield are what really matter. If yields are running 4-5% and your costs of doing business (living) are running 8%, then you are, in fact going backwards…
Wolf – are there any estimates made by anyone of the effect on the work force of deportations? How much of the workforce is made up by undocumented aliens? Are we facing a labor shortage?
Quit worrying about that. The one thing all this hoopla has accomplished — it’s an important thing — is it brought the influx of illegal immigrants to a near halt. So that circus kind of ended. But deportations have been small in numbers. It’s very hard to deport people after they’re established, especially to countries that refuse to take their citizens back, such as Venezuela.
it’s also hard because the legal system favors immigration, not deportation. it’s very easy to allow millions to come across the border and give them appearance tickets, but the court processes required to remove them are many times more cumbersome and expensive.
So, in the spirit of “due process” round ’em all up and give them a flight to their country of origin with a set of court papers to “appear at a date 10 years in the future” at immigration and naturalization
court for their case to be heard and adjudicated ( they must provide their own transportation to return . In the event they don’t show they default. Problem solved !
“8 U.S. Code § 1324 – Bringing in and harboring certain aliens” says its illegal to harbor or employee illegal immigrants. What happens if some business owners who employee or harbor some of these illegals are prosecuted? Homan has referenced 8USC1324 and says “it’s coming”. Not so sure about that though.
Employers should be required to use E-Verify for every hire. And be audited. And pay penalties per day per employee. There was a brief period when that was done, but then the government gave up on it. There were some legal issues with it, I don’t remember what, and companies lobbied against it, and since we have the best Congress money can by, E-Verity has become voluntary.
I’m not surprised by the strength of the economy. With so much fiscal stimulus (our huge deficit), I find it hard to believe we may have a significant slowdown. As long as there are folks who buy bonds at these (ridiculously low, in my opinion) interest rates and the dollar remains strong, we will keep sailing with not a worry in the world.
Yes, try out the employment numbers later without the $2T+ fiscal stimulus each year. This place would go 3rd world.
How will the 2 T deficit disappear?
it won’t. his point, which i believe is valid, is that the u.s. economy is propped up by the federal government’s willingness to engage in massive deficit spending, and the federal government’s deficit is made possible by the reserve currency status and the willingness of people to lend the u.s. treasury seemingly unlimited amounts of power at low yields.
Much higher taxes is the only way to solve the deficit issue.
@SoCal,
Federal revenue isn’t that much lower than the average of the last 40 years.
Federal spending on the other hand is exploding. If it isn’t controlled, we are in for permanent inflation as the people will not tolerate taxes at w European level. And taxation in the EU falls very heavily on the middle class because of VAT. If you think this problem can be solved by taxing the wealthy alone, you are dead wrong, there is no country with enough wealth to pay for everything that a far left spending social and environmental government married to a far right spending military will desire to spend.
I’ll go on record by saying that the US is on the precipice of a significant economic downturn. Prepare accordingly. Unpredictable teriffs and the lack of clarity will rule the day this summer.
Agreed. Beige Book for April: “Economic activity was little changed since the previous report, but uncertainty around international trade policy was pervasive across reports…The outlook in several [regions of the U.S.] worsened considerably as economic uncertainty, particularly surrounding tariffs, rose…Several districts reported that firms were taking a wait-and-see approach to employment, pausing or slowing hiring until there is more clarity on economic conditions…etc”
That’s the “soft” data, and it has been shitty. The hard data has been good because businesses are trying to make their businesses work, and because consumers are making more money than ever and are spending it and are having fun, despite their shitty survey responses.
maybe the shitty survey responses are just the medicine needed to have people cut back just enough to get inflation down to the target? one can hope…
graphic-
The time-worn Wall Street adage: “the market climbs a wall of worry” might fit here, at least for a while.
That said, the uncertainty — especially on the part of business decision makers intent on keeping their jobs, their businesses and their profits intact — is palpable, just as you describe.
Just reading about 20% of container vessels changing course or being cancelled coming month. It’s being compared to the 12.5% peak of course-changes during height of the pandemic. If there’s no containers coming in, there’s no containers going out, seems like a recipe for a lot of things getting stuck at port soon. Global trade is sensitive and disruptions take some time to manifest and a long ass time to resolve.
Fewer containers coming in also means much lower imports in coming months. Imports are a negative for the economy and GDP, and fewer imports will boost GDP. Q1 GDP, out this morning, was negative due to the record surge in imports. That’ll end, thankfully.
Container freight margins are slim, ideally you want your containers to be filled both on your way in and your way out. Judging from these reports, the tariffs seem to significantly disrupt the amount of containers en-route to the US (mostly the ones outbound from China I’d imagine). Short term those containers are going to 1) clog up other ports, for example in Europe, 2) lower availability of containers in US ports for US exporters in the coming months, which 3) increases the waiting time at US ports, impacting storage availability & costs.
A 40′ container from Rotterdam to NY costs 2065 dollars atm. A container from NY to Rotterdam costs between 500 and 700 dollars. Why? Simple supply and demand. US has more containers inbound than outbound. But a very significant portion of those are coming in from China. Long term, if imports are truly going to permanently be lower, US costs to export to the rest of the world will go up. Short term, there are only so many containers and ships to go around, I think we’re not yet feeling just how much this boat is being rocked.
Going on the record means little unless you put a date and a number in the same sentence.
Economists never do because they are priests, not scientists.
Be ready for the negative GDP headlines. Basically only negative because federal spending is down and imports were up
Yes huge spike in imports turned it negative. Surging imports are NOT a sign of weak demand.
Hot off the press:
https://wolfstreet.com/2025/04/30/q1-gdp-whacked-by-massive-spike-in-imports-on-tariff-frontrunning-consumer-spending-grew-business-investment-soared/
and yet look at the headlines. The articles get into the details, but the headlines are ridiculous.
Also I’ll change my name to Eric86
Wolf, I spoke with an Italian motorcycle importer over the weekend and was ready for the sky is falling conversation. His entire business is dependent on imports(parts is the money maker). I was pleasantly surprised to hear him say that there is a lot of uncertainty right now and customs is screwed up , but that is the price we have to pay to make things right and the sky is in fact not falling. It was refreshing to hear it from the horses mouth after being lied to by the MSM. You are spot on .
As long as the GDP stays generally large, all concerned will be happy. It is only a crushing drop such as a depression brings that burns the toes of the citizenry.
6:36 AM 4/30/2025
Dow 40,076.82 -450.80 -1.11%
S&P 500 5,476.65 -84.18 -1.51%
Nasdaq 17,085.52 -375.80 -2.15%
VIX 26.48 +2.31 9.56%
Gold 3,311.60 -22.00 -0.66%
Oil 59.90 -0.52 -0.86%
I have to thank you Wolf. My son intermittently calls with angry retorts about the economy. The latest is everyone is getting laid off, we are in recession and their are no jobs!
Watching the fake business social media and msm I am sure.
I just send him here, to the actual numbers man. You settle the dispute while actually keeping me out of it!
All I say is I understand what the media has done to you, but these are the numbers and facts. Being an engineer he never argues with the actual numbers and facts!
Thank you!
I’m unclear why you care about the “BS”. You’re on record saying the stock market is going to tank. That’s all they’re saying. Tariffs likely will tank the stock market, the job market and raise interest rates through inflation. I know this is schadenfreude street, I mean I get a good laugh reading the comments almost every day for the last few years. Everyone with their marshmallows rotting on the sticks waiting for the bonfire that will “correct the housing market, correct the stock market”, but it does strike me that the BSers are saying the same thing you are, you’re just happy about the inevitable outcome.
So let’s imagine the housing values crater, which is a considerable proportion of the wealth of many Americans, and the stock market craters, which is a significant proportion of future retirement money in the US, and the job market tanks which is the only means of subsistence for ~ 50% of the country. (And I find it veeeeery hard to believe if the stock market craters that the outcome is more jobs, and if the shelves are empty that prices will come down)
But hey it doesn’t matter what I think, we’re buckled in, and it’ll be a disaster or it won’t. One thing is sure though if it’s a disaster it’s the other guy’s fault.
and now the GDP now is 2.4% lol
Ignore it this early in the quarter. It has no Q2 data yet to go by.
“Everything looks great here! Clear sailing!” Captain of the Titanic just before he collided with a large object.
The “large object” being the massive record spike of imports on tariff frontrunning. Imports are NOT a sign of weak demand. On the contrary.
Hot off the press:
“Final sales to private domestic purchasers” jumped by 3.0%, on strength in the private economy of businesses and consumers.
https://wolfstreet.com/2025/04/30/q1-gdp-whacked-by-massive-spike-in-imports-on-tariff-frontrunning-consumer-spending-grew-business-investment-soared/
It actually does look pretty good. From the sentiment on the street, it seems there is much variance from the mean from state to state. Here in our red mountain state, jobs are plenty, but our southwestern blue state friends seem to always be telling me the job market is tough.