Sellers come out of the woodwork after the rate cuts, buyers not so much. But Montreal, Edmonton, and Winnipeg play with all-time highs.
By Wolf Richter for WOLF STREET.
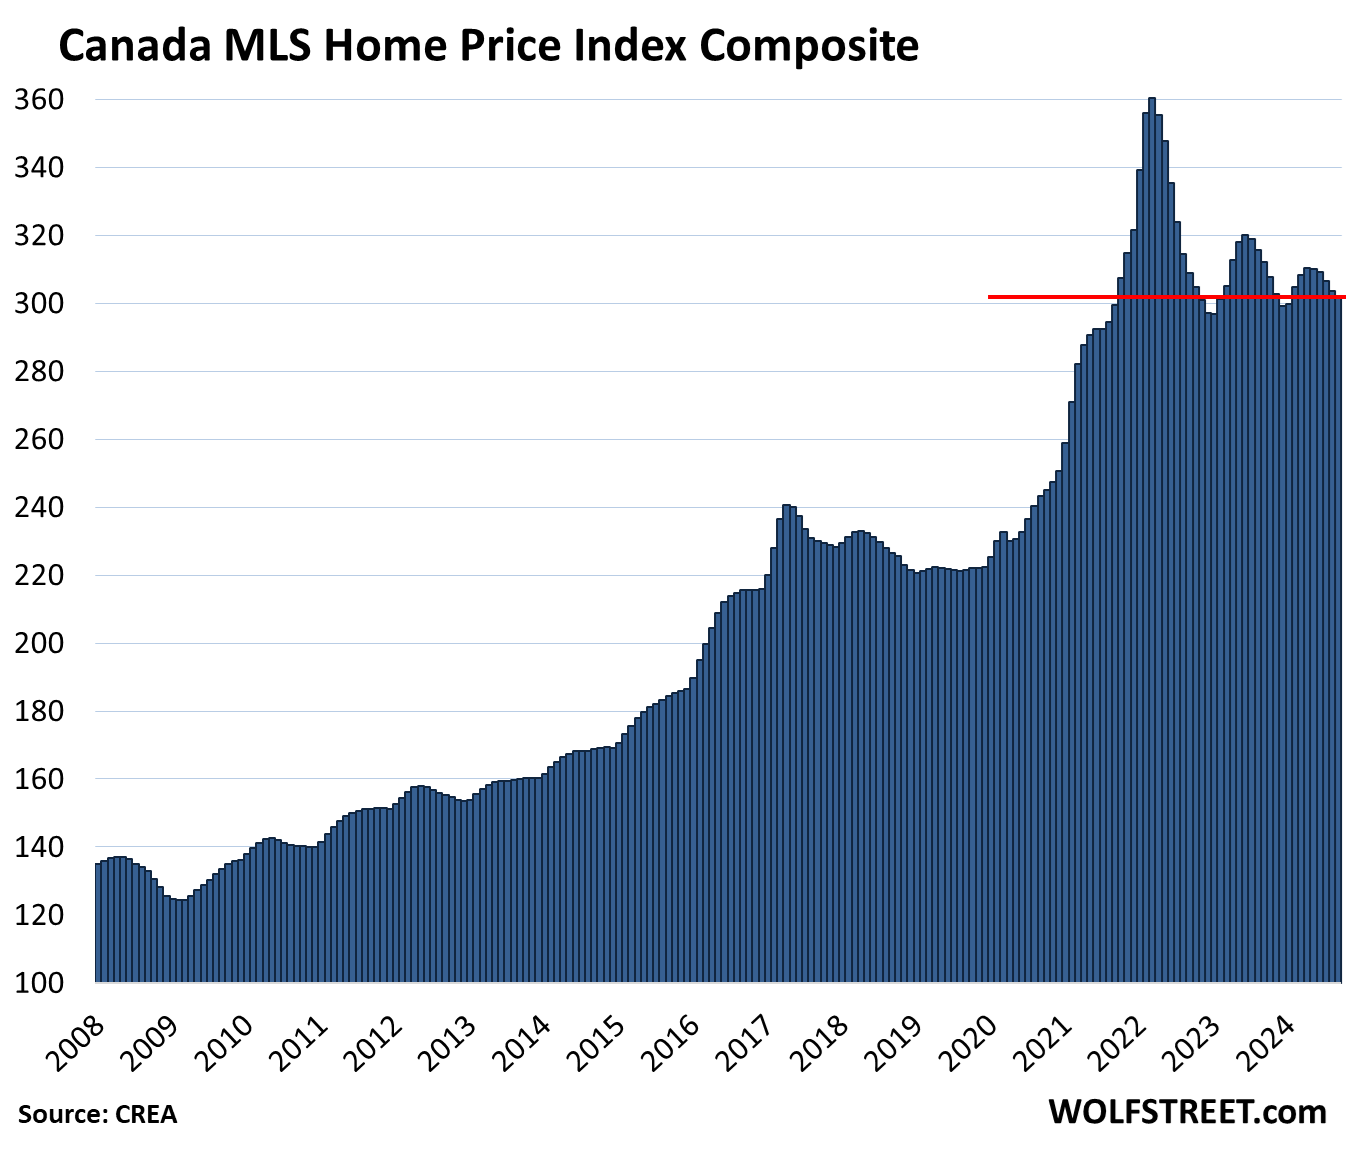
It continues despite rate cuts: Prices of single-family homes in Canada fell in September from August (-0.5%) and year-over-year (-2.8%), the sixth year-over-year decline in a row, and were down 16.7% from the peak in March 2022 (actual prices, not seasonally adjusted).
Condo prices fell 1.0% in September from August, and 4.0% year-over-year, and were down 11.4% from their peak, according to data from the Canadian Real Estate Association (CREA) today. Condo prices got hit hard particularly in the Greater Toronto Area, falling 2.0% for the month and 7.2% year-over-year, thereby carving out a new three-year low.
Sales and inventory in Canada.
Home sales in Canada rose by 1.9% in September from August, seasonally adjusted. Year-over-year, not seasonally adjusted, home sales rose 6.9%. Compared to the 10-year average for this time of the year, sales were still down 7%.
So the rate cuts by the Bank of Canada – and the lower prices? – nudged buyers a little, off the stalled levels before. But what the rate cuts really did was bring out the sellers.
New listings jumped 4.9% in September from August, with “a burst of new supply” at the beginning of September, “as sellers listed properties in larger than normal numbers for the first weeks of the month,” CREA said today. “Gains were broad-based, with most of the country’s biggest markets topping the list.” New listings have been increasing all year.
Total listings jumped by 16.8% from a year ago, to 185,427 homes in September. Supply ticked down to 4.1 months of sales at the current pace of sales, from 4.2 months in August.
Home prices by market in Canada.
All prices below are prices in Canadian dollars, not seasonally adjusted.
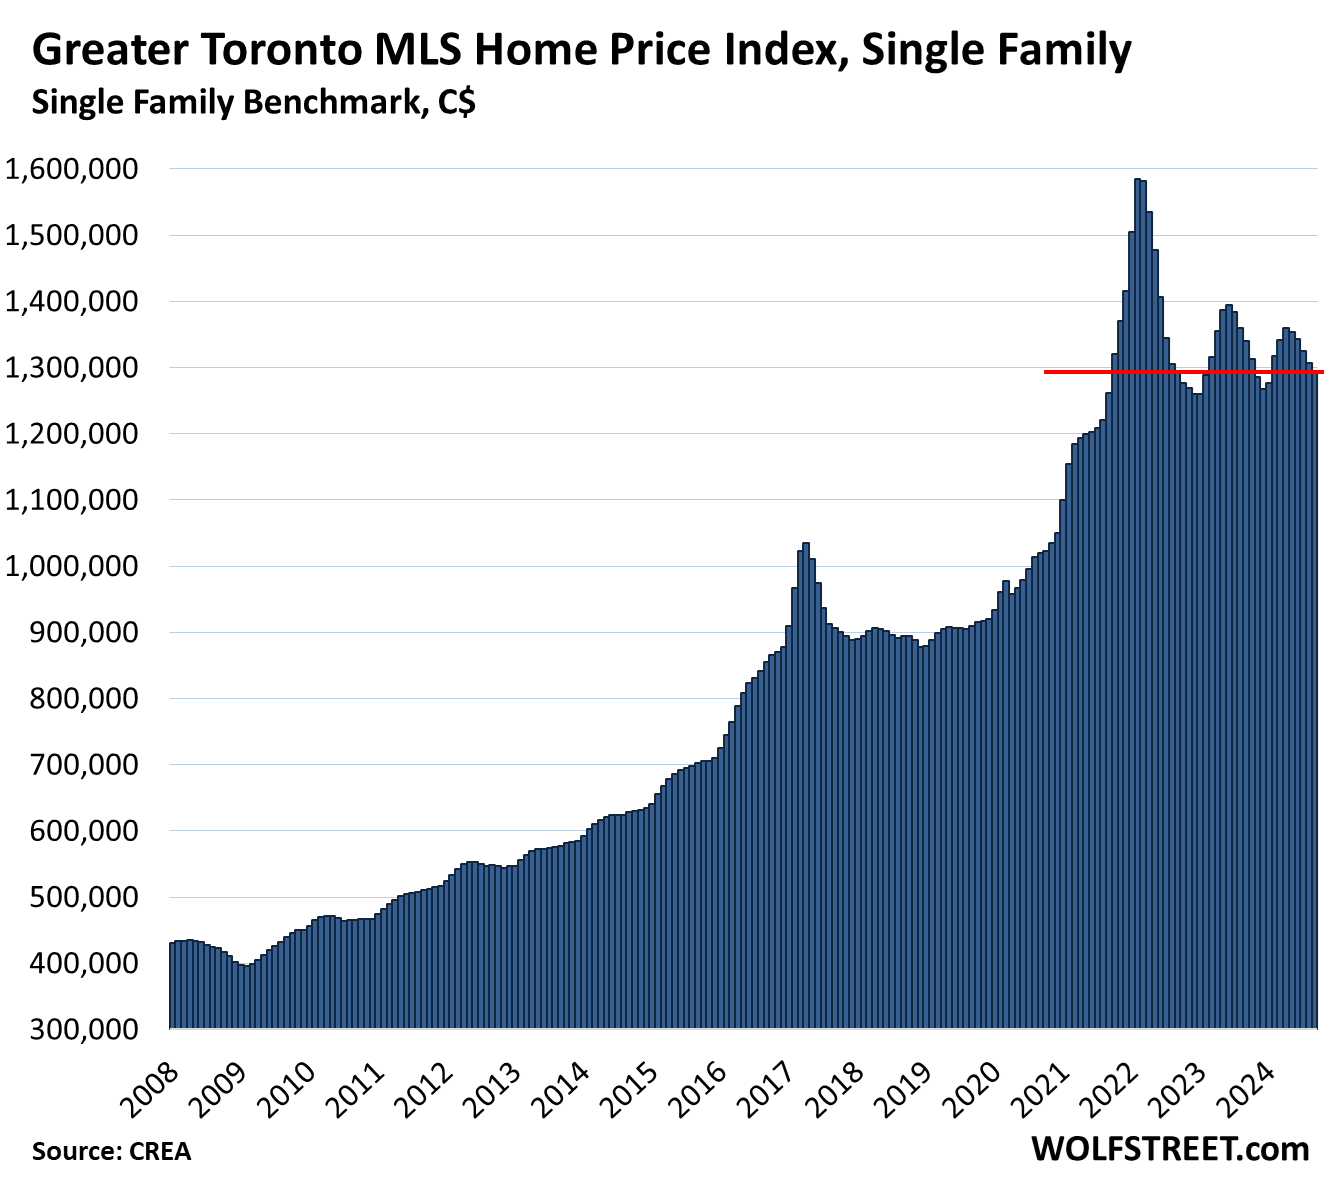
Greater Toronto Area, single-family MLS Home Price Benchmark Index:
- Month-to-month: -1.1% to $1,293,300; below October 2021
- From peak in February 2022: -18.4%
- Year-over-year: -3.5%, fifth month of year-over-year declines in a row.
New listings jumped by 9.8% in September, according to TREBB, and inventory continued to surge, pushing active listings to the highest level since 2009, as the rate cuts have brought out the sellers.
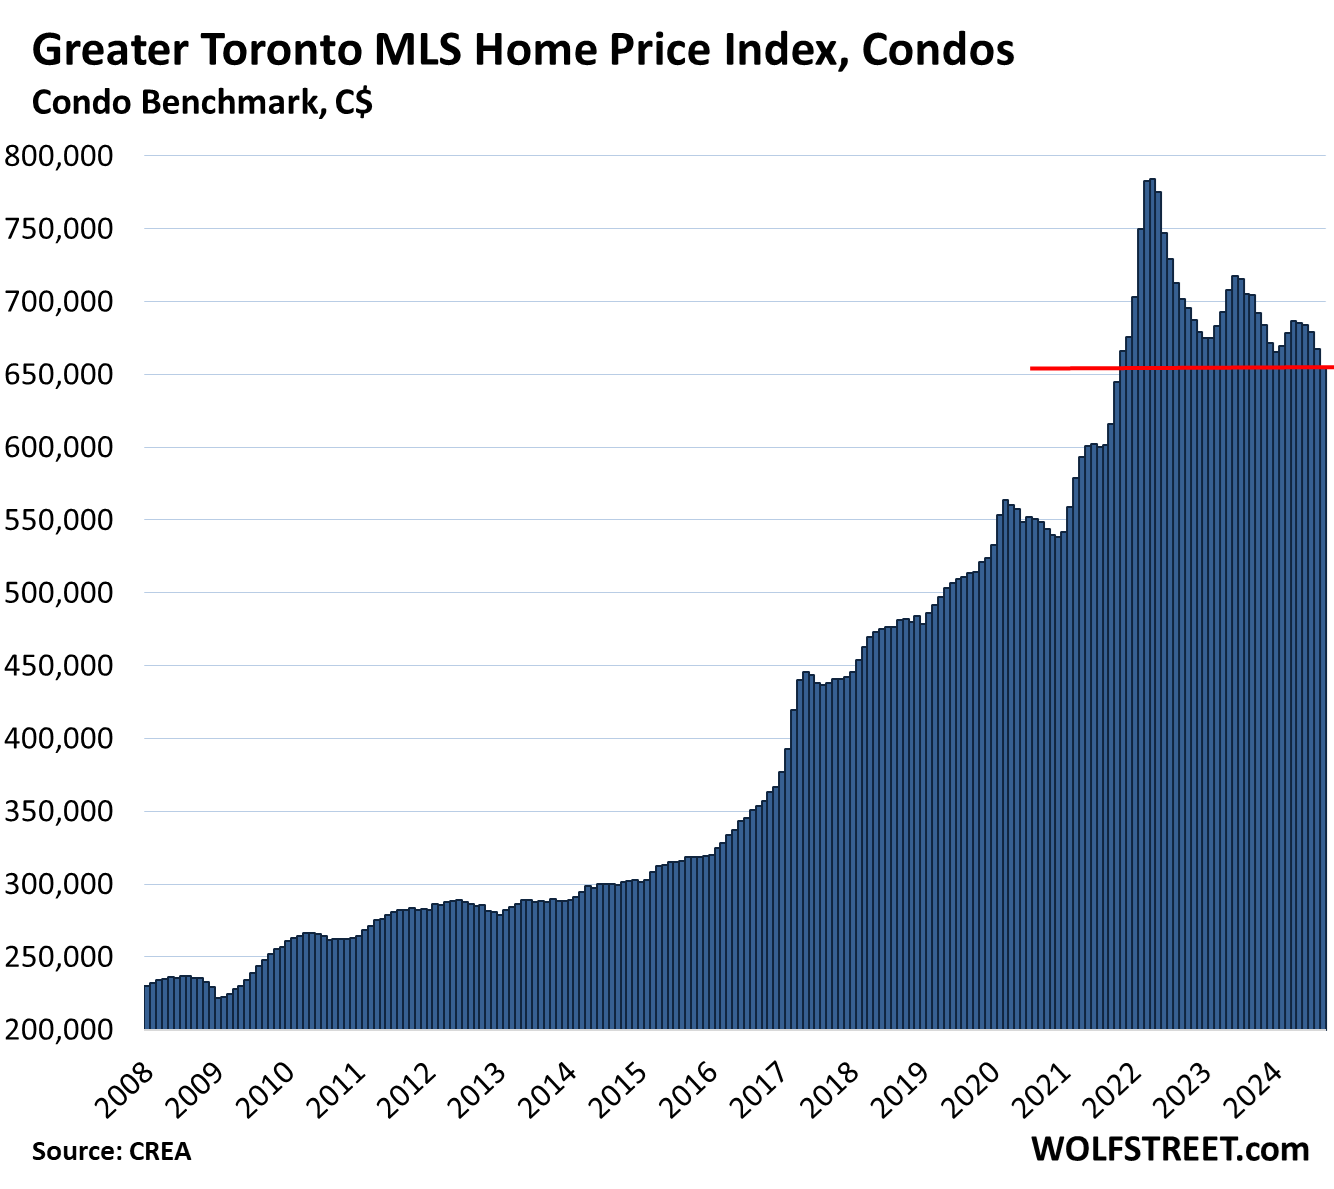
Greater Toronto Area, condo benchmark price:
- Month-to-month: -2.0% to $654,300, lowest since October 2021.
- From peak in April 2022: -16.6%
- Year-over-year: -7.2%, with 20 of the past 21 months booking year-over-year declines.
New listings of condos jumped by 9.9%, pushing up active listings further, as the sellers are coming out of the woodwork:
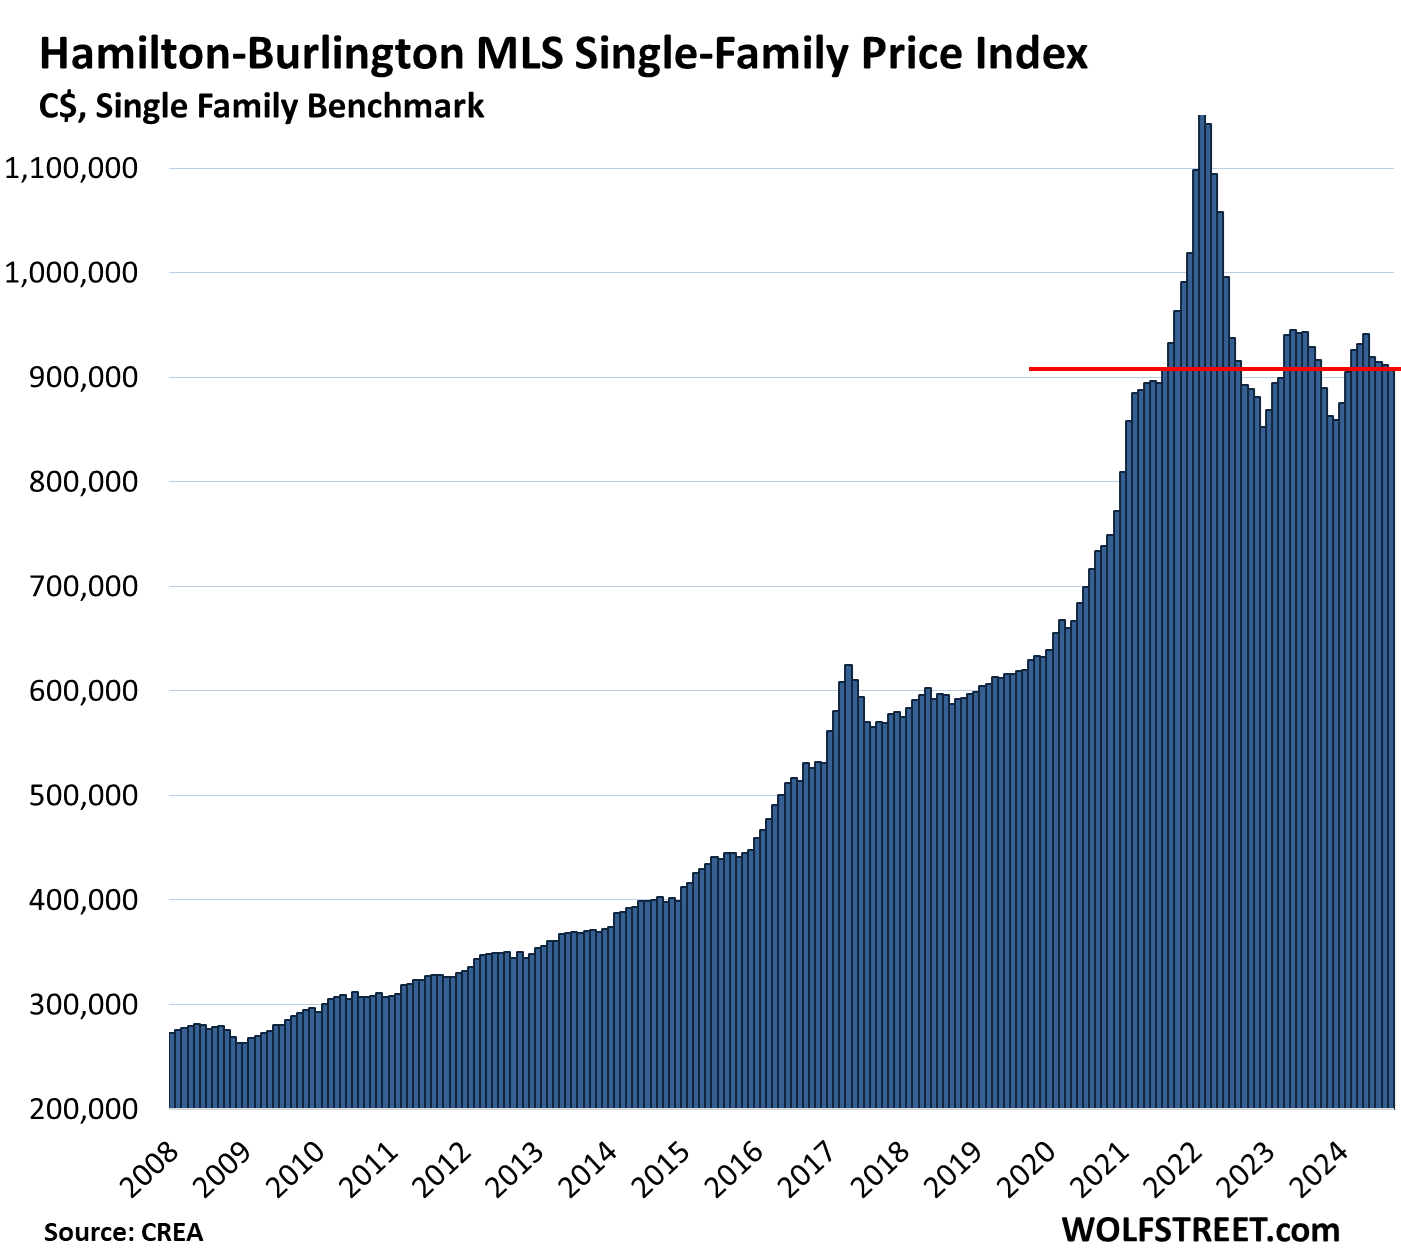
Hamilton-Burlington metro single family benchmark price (part of the “Greater Toronto and Hamilton Area”):
- Month-to-month: -0.4% to $908,000, below where it had been in August 2021
- From peak in February 2022: -21.5%
- Year-over-year: -0.9%, sixth month in a row of declines.
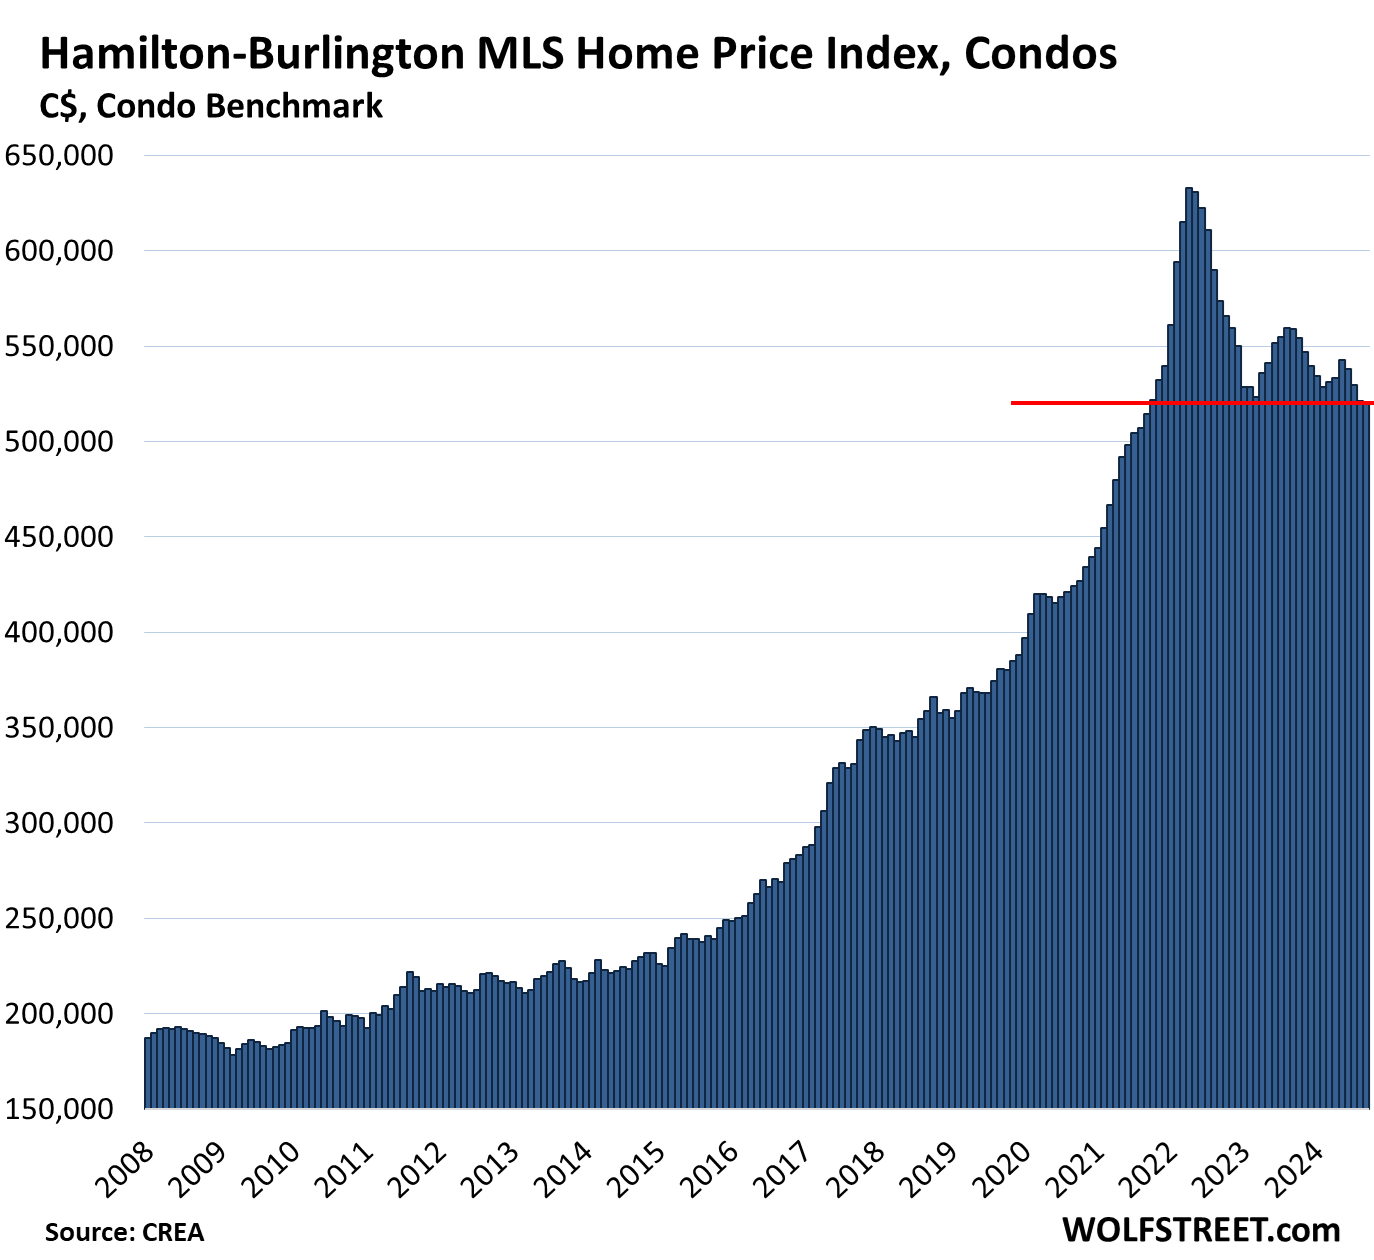
Hamilton-Burlington metro condo benchmark price:
- Month-to-month: -0.1% to $520,600, lowest since September 2021.
- From peak in April 2022: -17.7%
- Year-over-year: -6.8%, fourth month in a row of year-over-year declines.
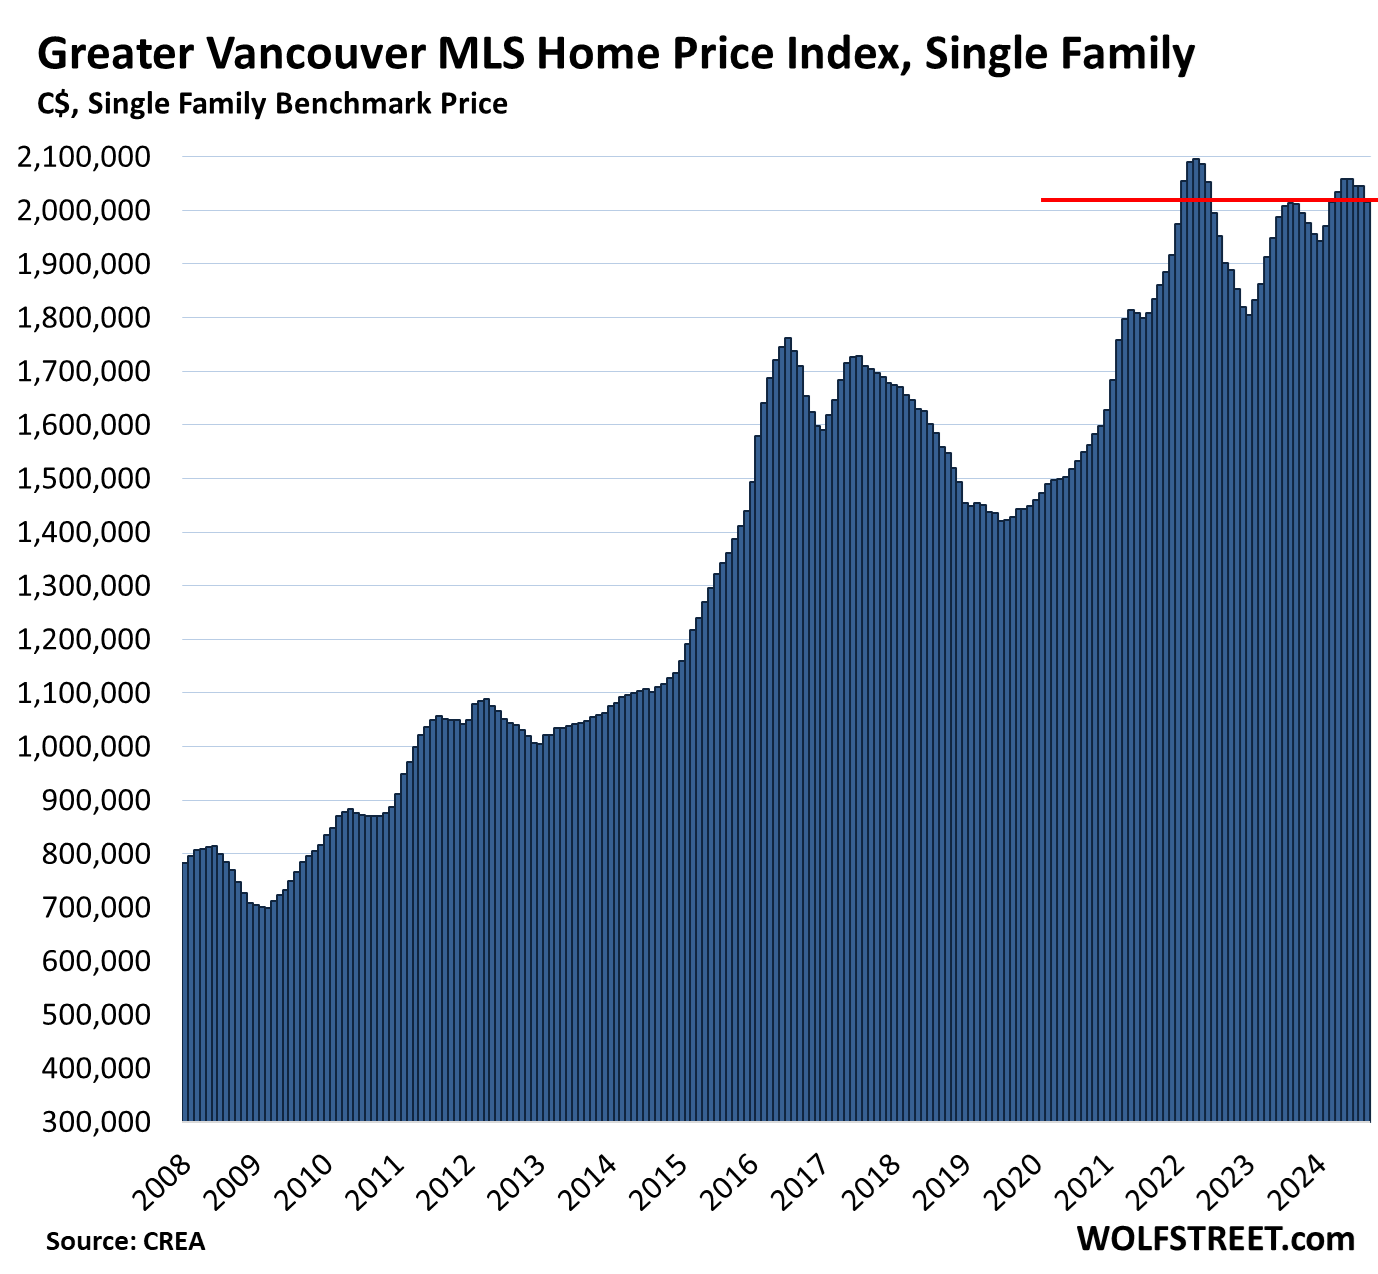
Greater Vancouver single-family benchmark price:
- Month-to-month: -1.4%, at $2,015,900, below February 2022.
- From peak in April 2022: -3.8%
- Year-over-year: +0.2%, smallest gain since the drop in June 2023.
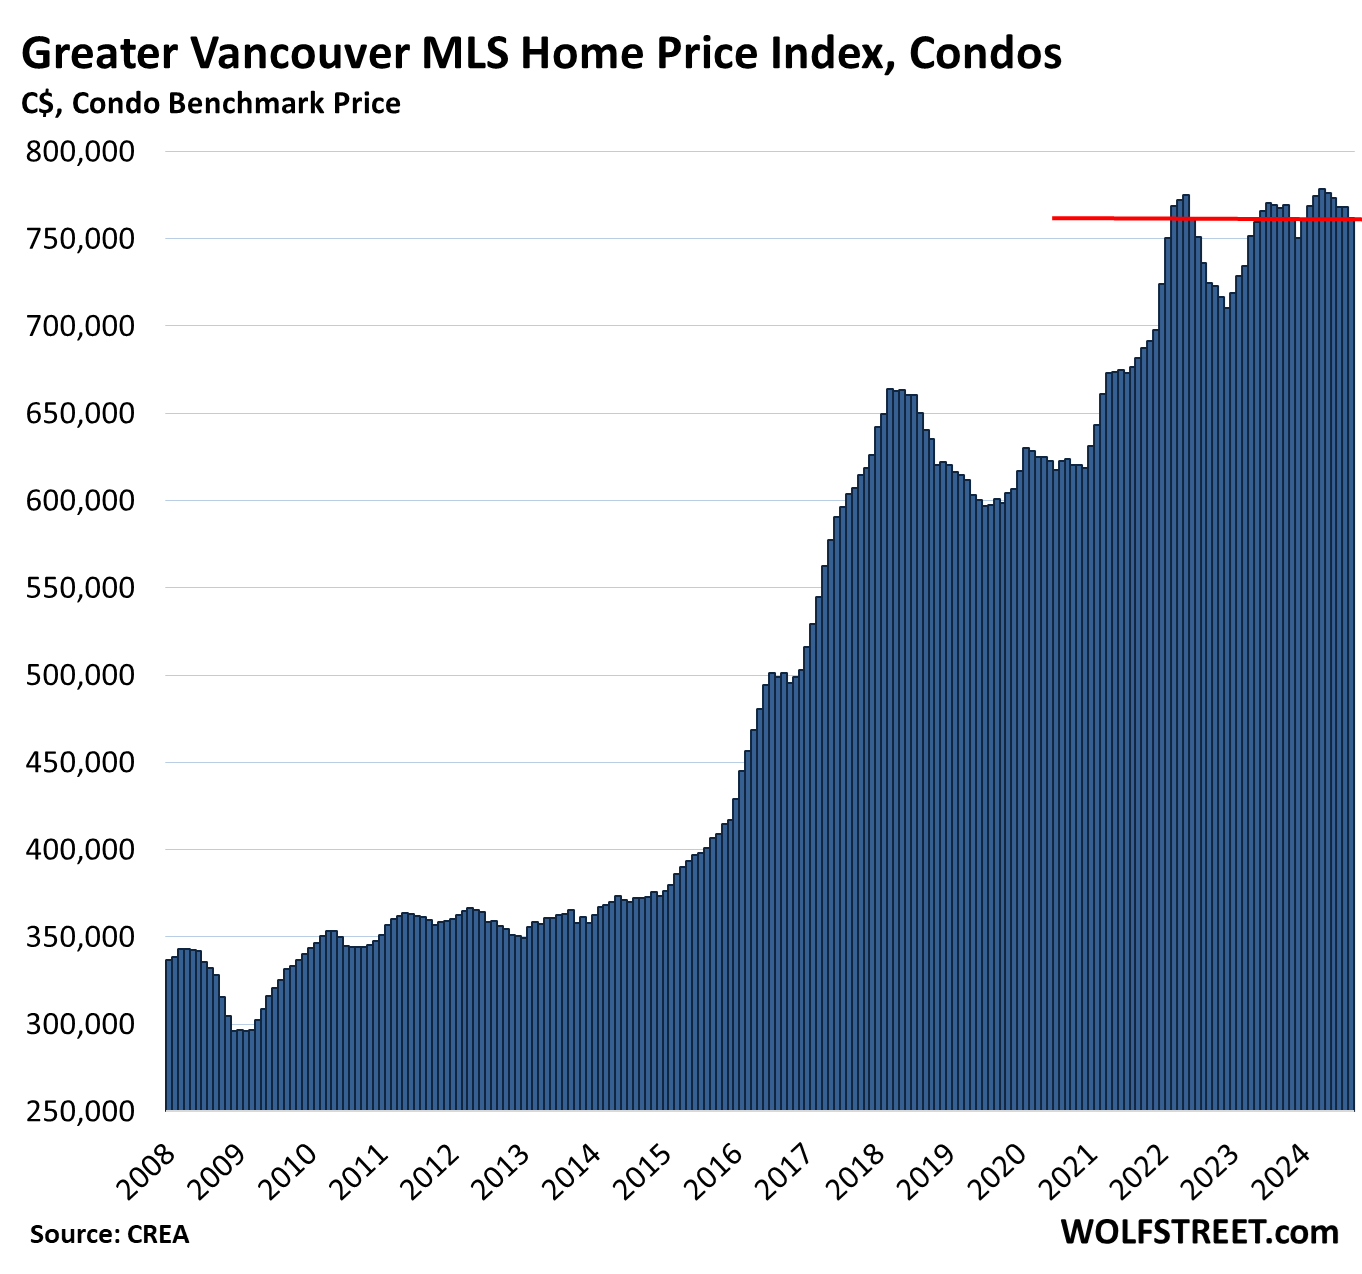
Greater Vancouver condo benchmark price:
- Month-to-month: -0.8%, to $762,000, below March 2022.
- Year-over-year: -0.7%, third year-over-year decline in a row.
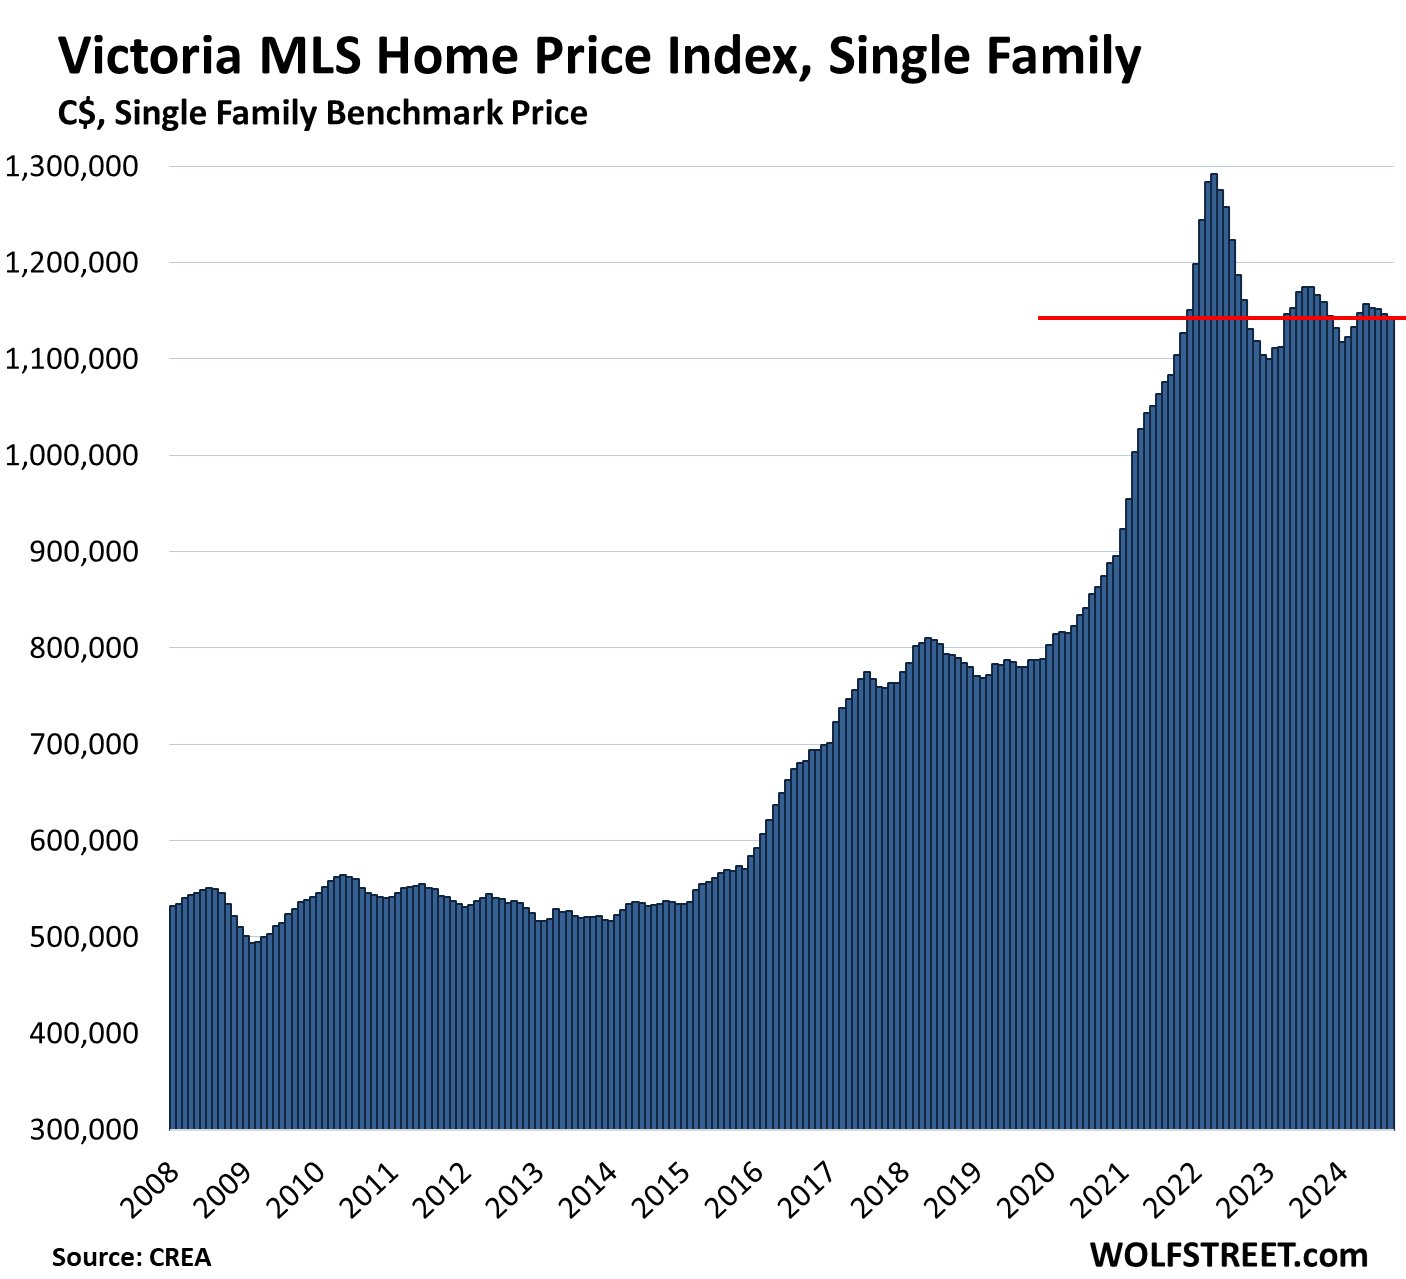
Victoria, single-family benchmark price:
- Month-to-month: -0.4%, to $1,142,100, below November 2021
- From peak in April 2022: -11.6%
- Year-over-year: -2.0%, fourth year-over-year decline in a row.
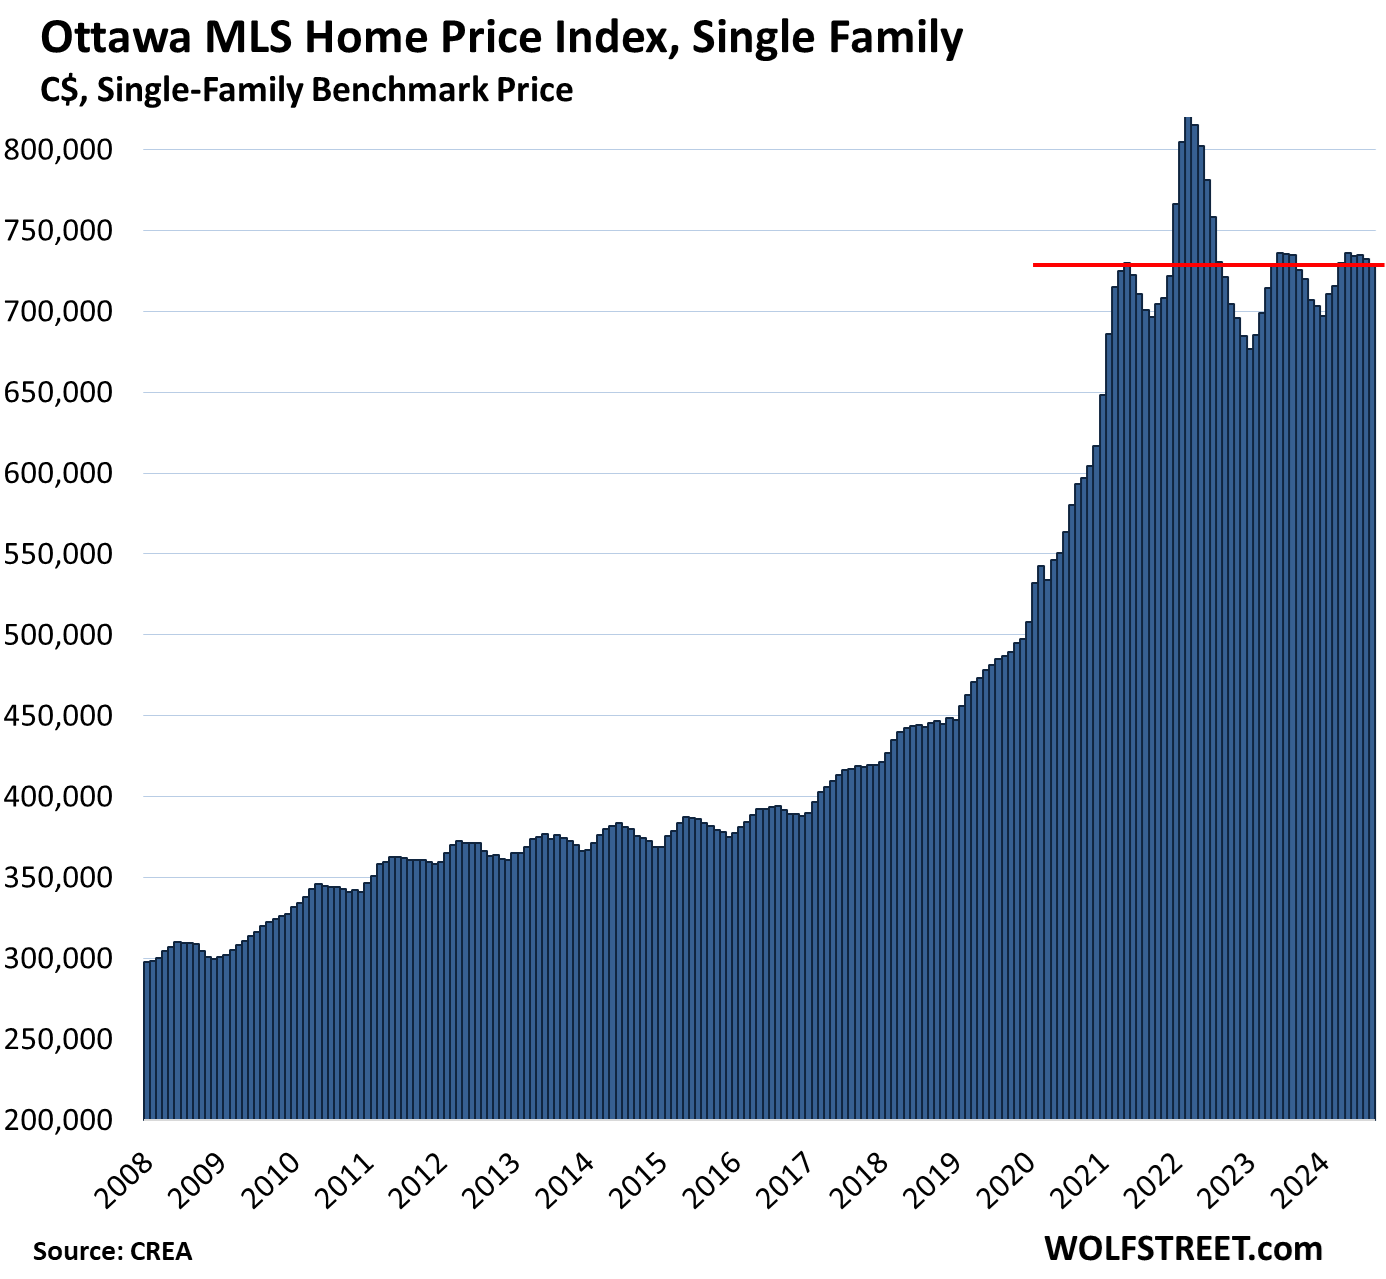
Ottawa, single family benchmark price:
- Month-to-month: -0.5% to $729,000, below May 2021
- From peak in March 2022: -11.2%
- Year-over-year: +0.5%.
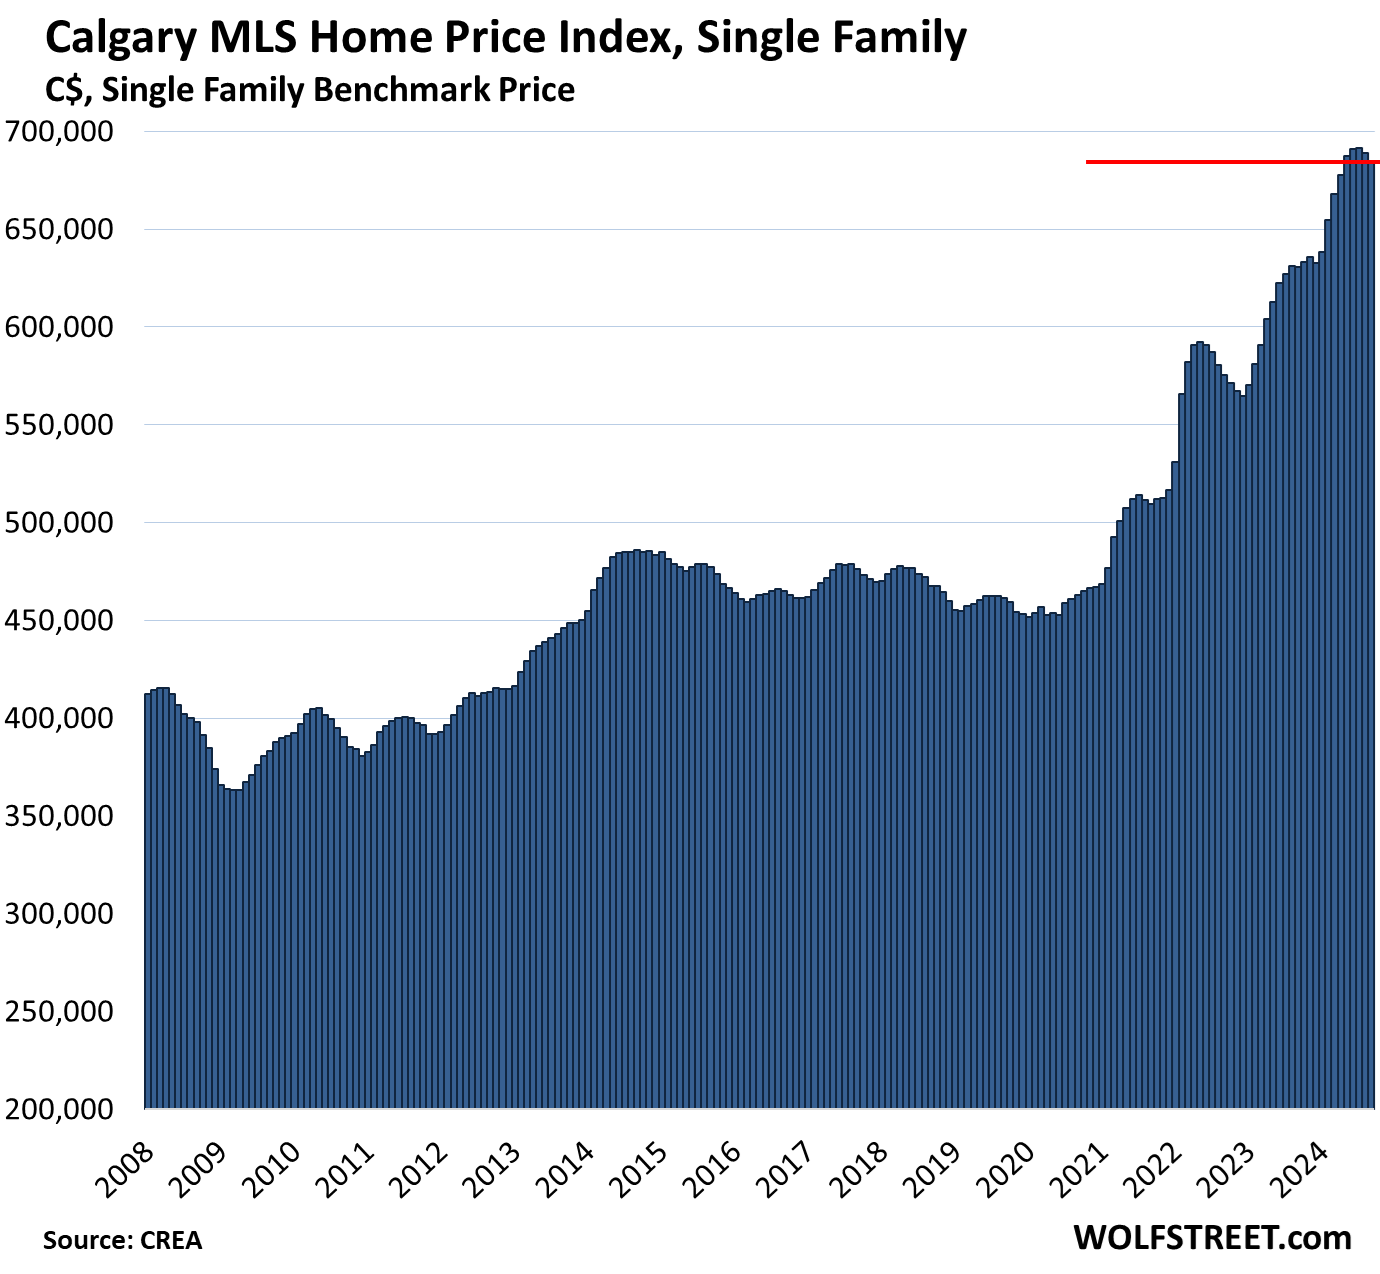
Calgary, single family benchmark price:
- Month-to-month: -0.7%, second month of declines from the all-time high, to $684,400.
- Year-over-year: +8.5%, the smallest gain since July 2023.
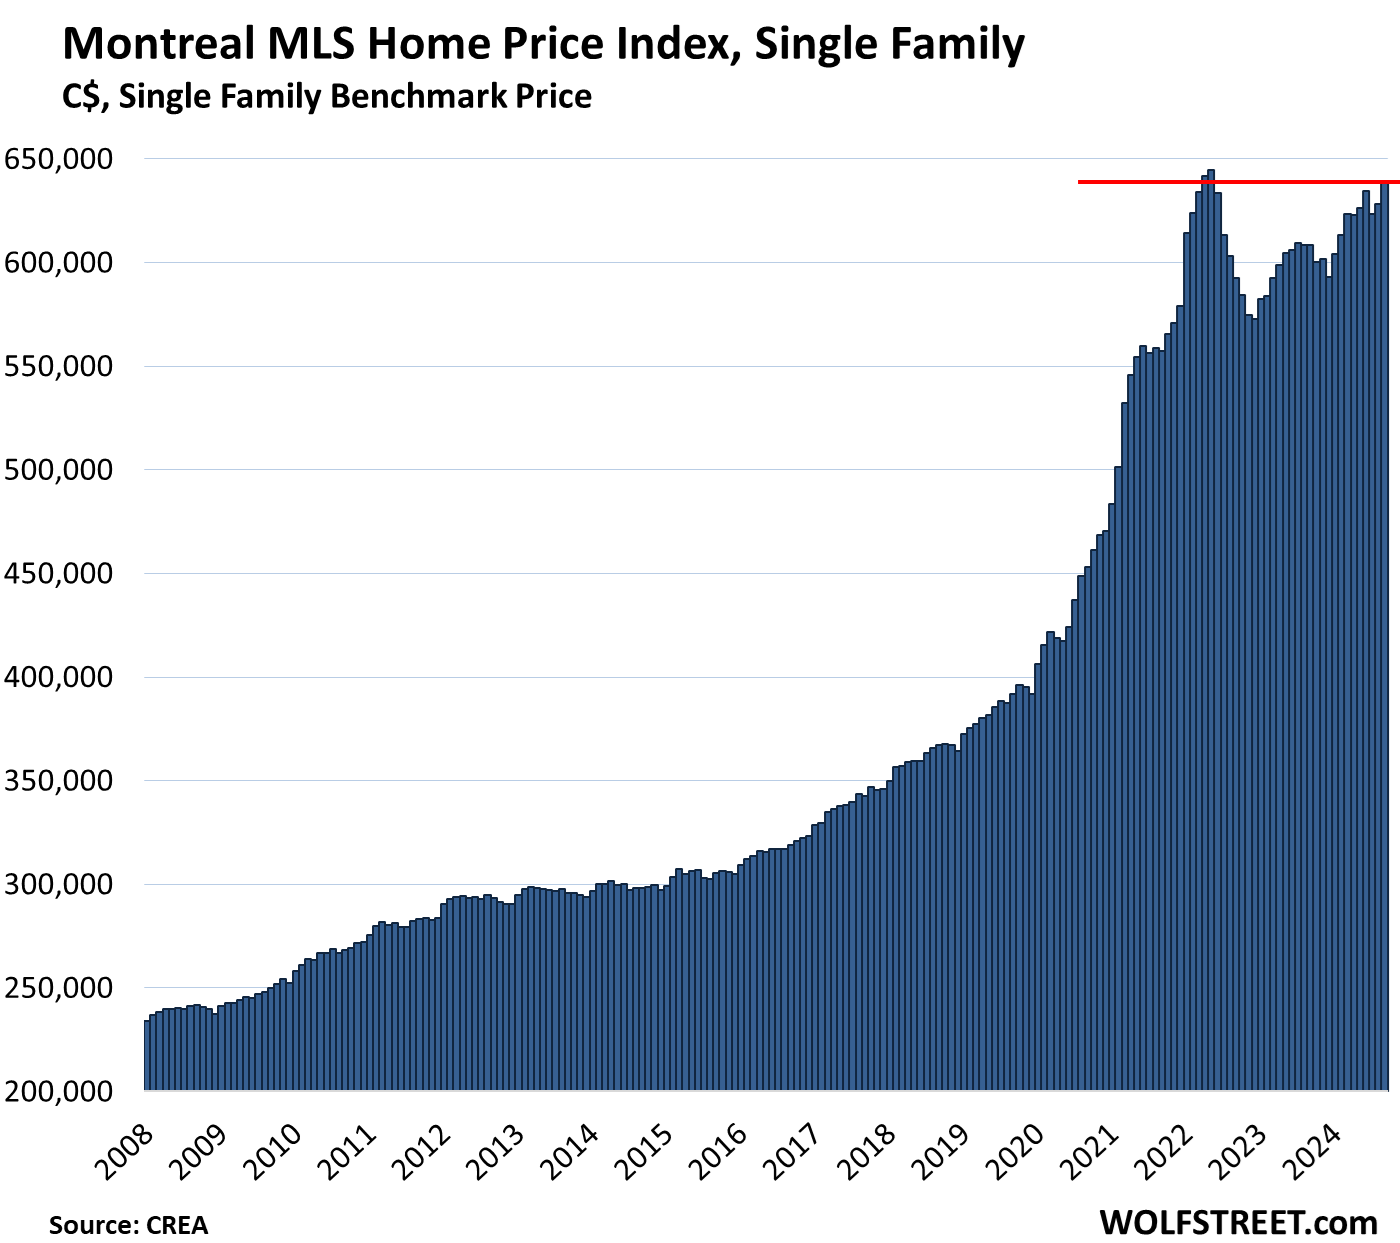
Montreal, single family benchmark price:
- Month-to-month: +1.7%, to $638,900.
- From peak in May 2022: -0.9%
- Year-over-year: +5.0%.
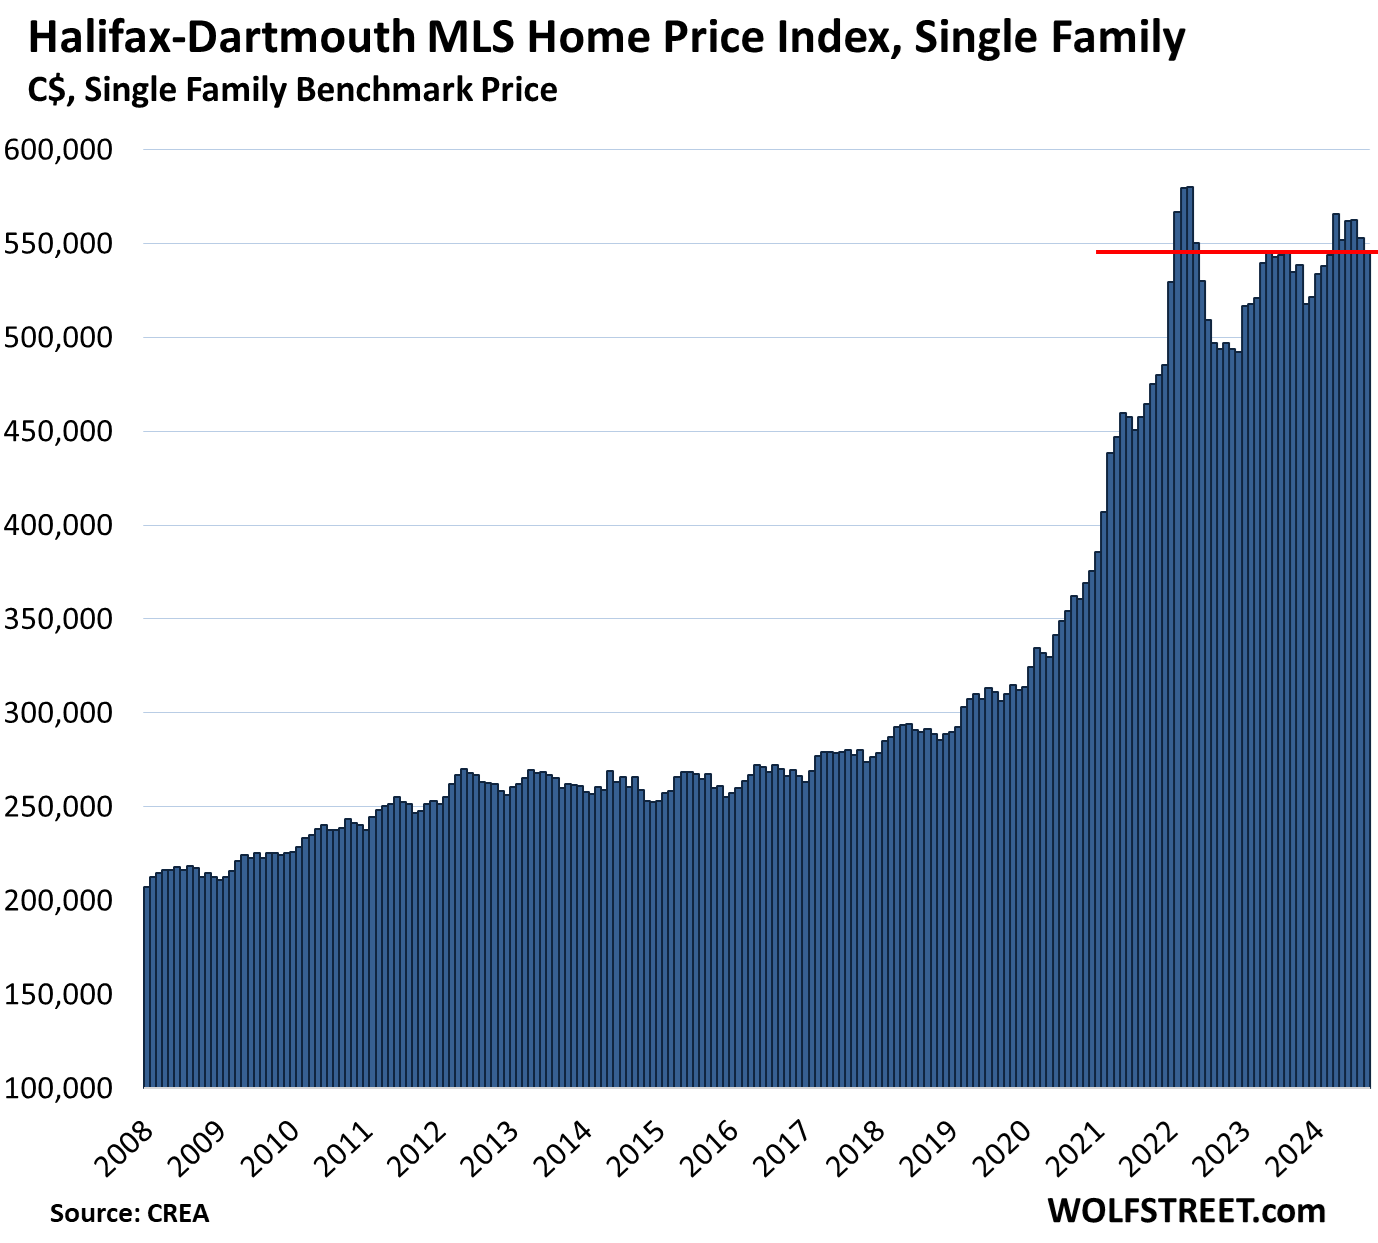
Halifax-Dartmouth, single family benchmark price:
- Month-to-month: -1.1% to $546,000
- From peak in April 2022: -5.9%
- Year-over-year: +2.1%.
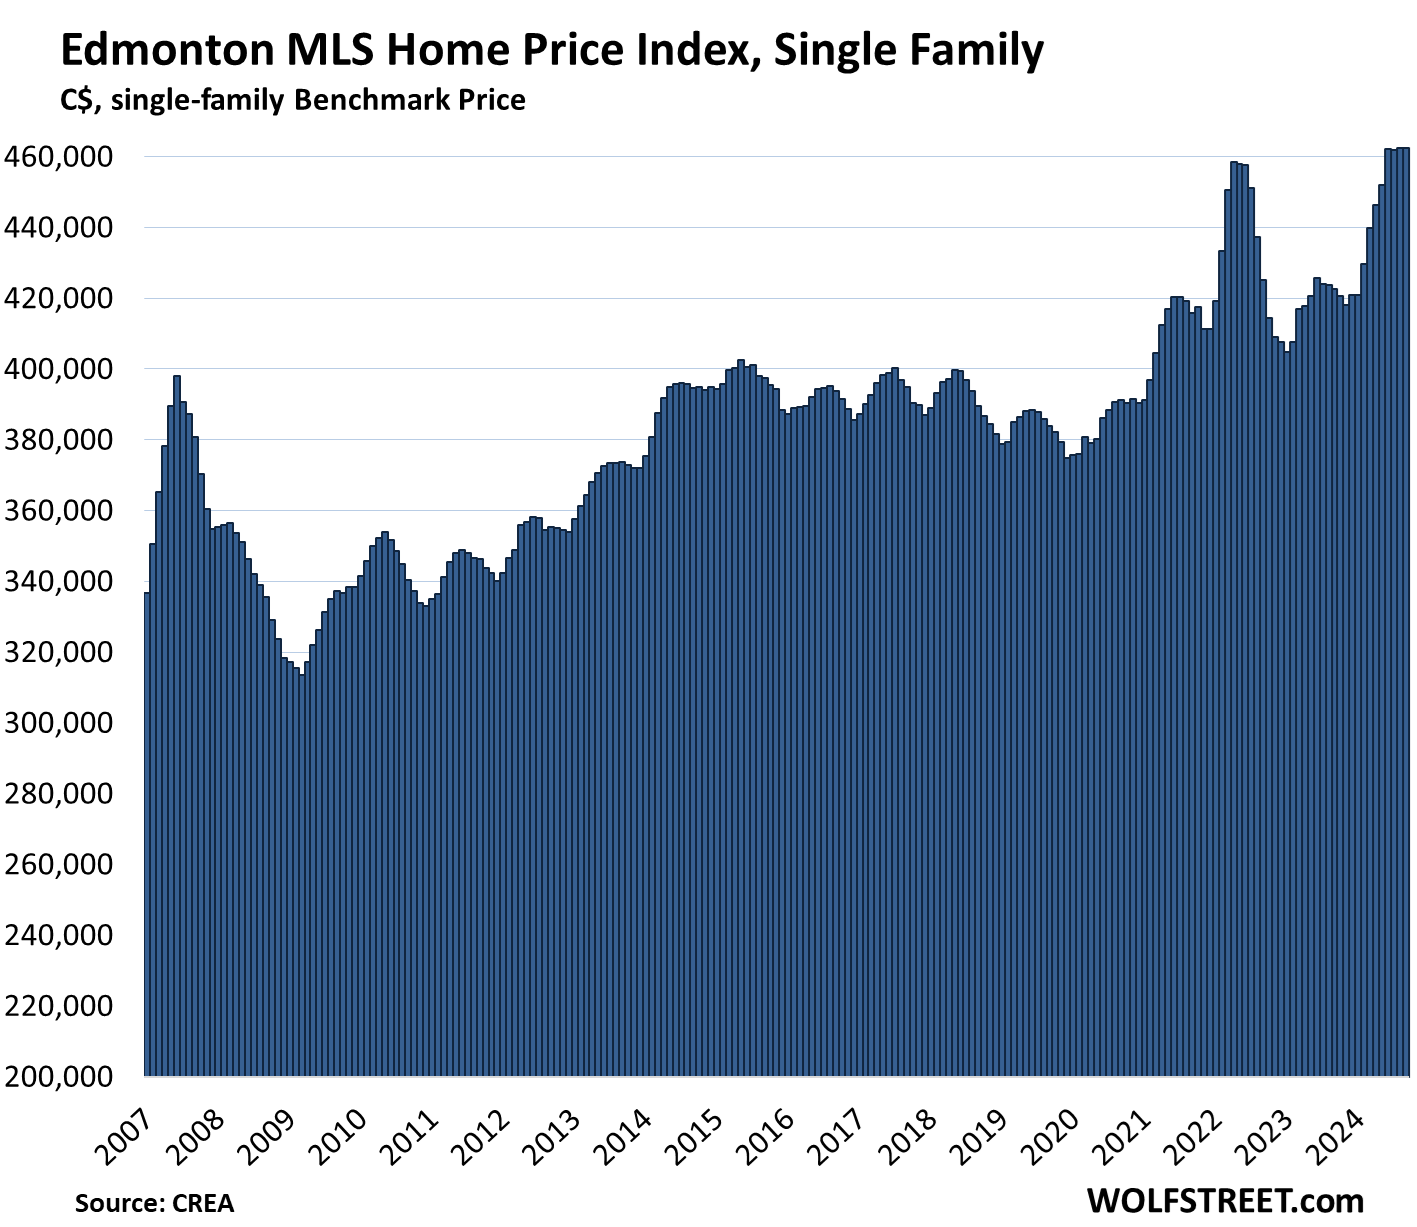
Edmonton, single-family benchmark price:
- Month-to-month: unchanged to $462,400; the last four months were roughly unchanged
- Year-over-year: +9.4%
- In the 17 years since the peak of the prior bubble in June 2007, the index is up 16%.
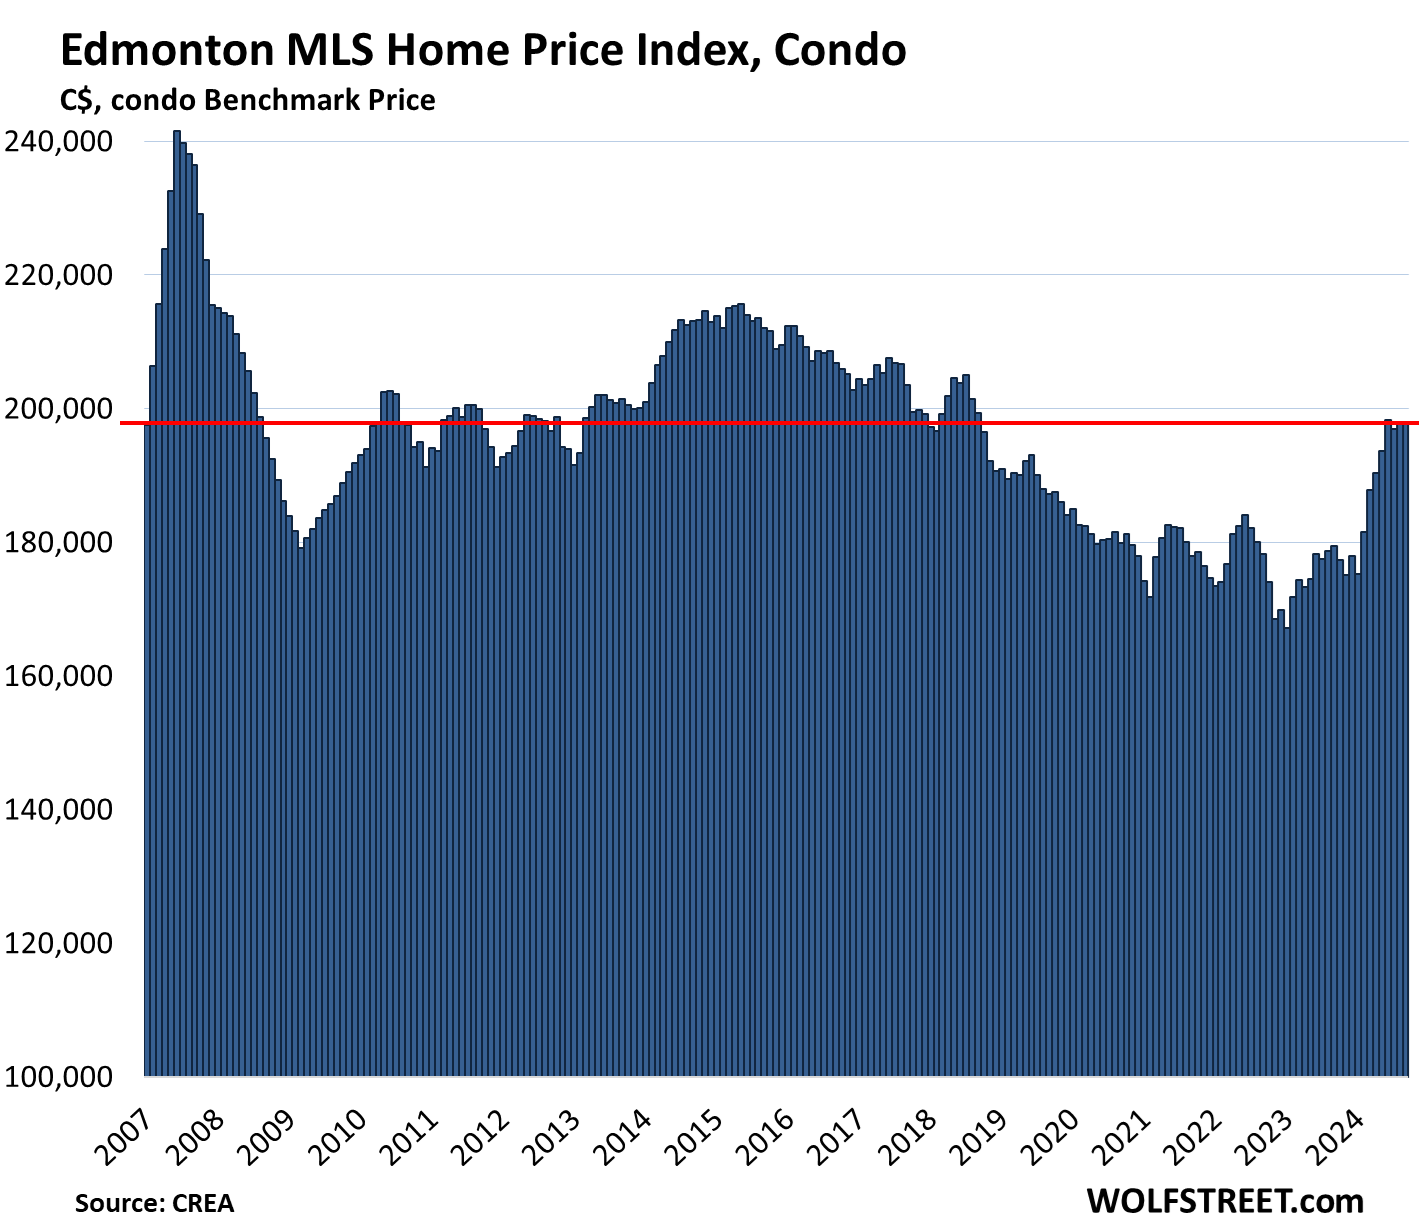
Edmonton, condo benchmark price:
- Month-to-month: roughly unchanged, at $198,000, first seen in January 2007.
- From peak in June 2007: -18%
- Year-over-year: +10.7%
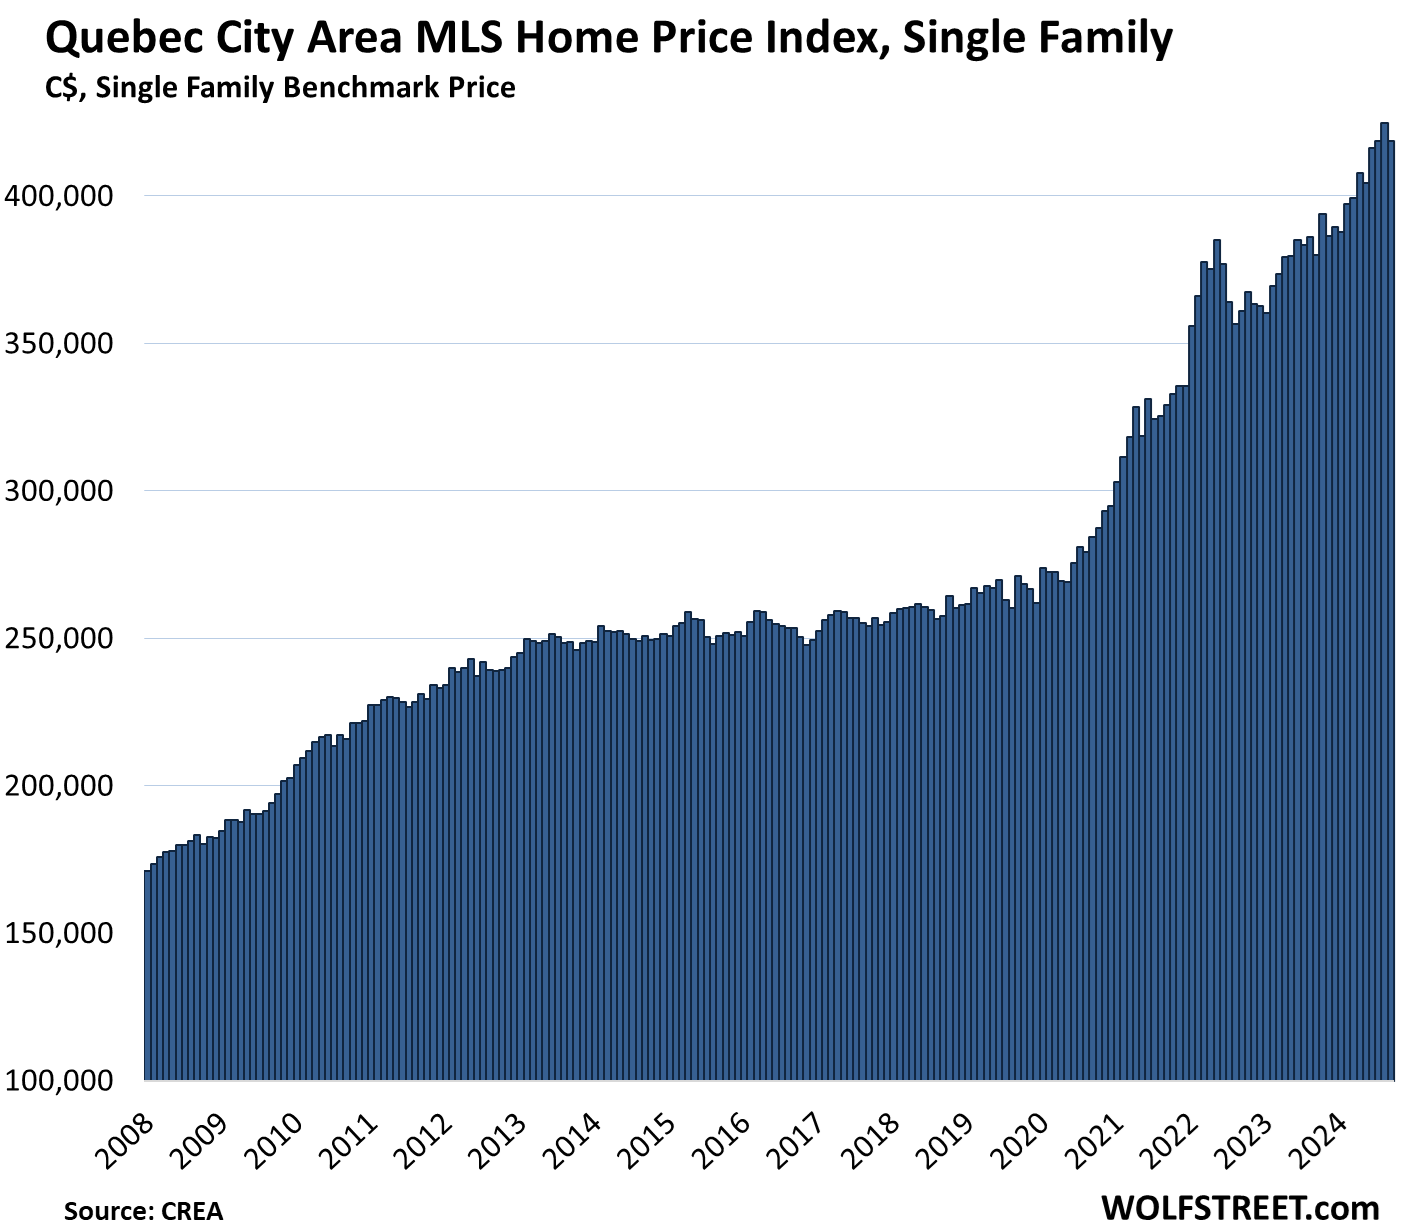
Quebec City Area, single-family benchmark price:
- Month-to-month: -1.4% to $418,600
- Year-over-year: +10.1%
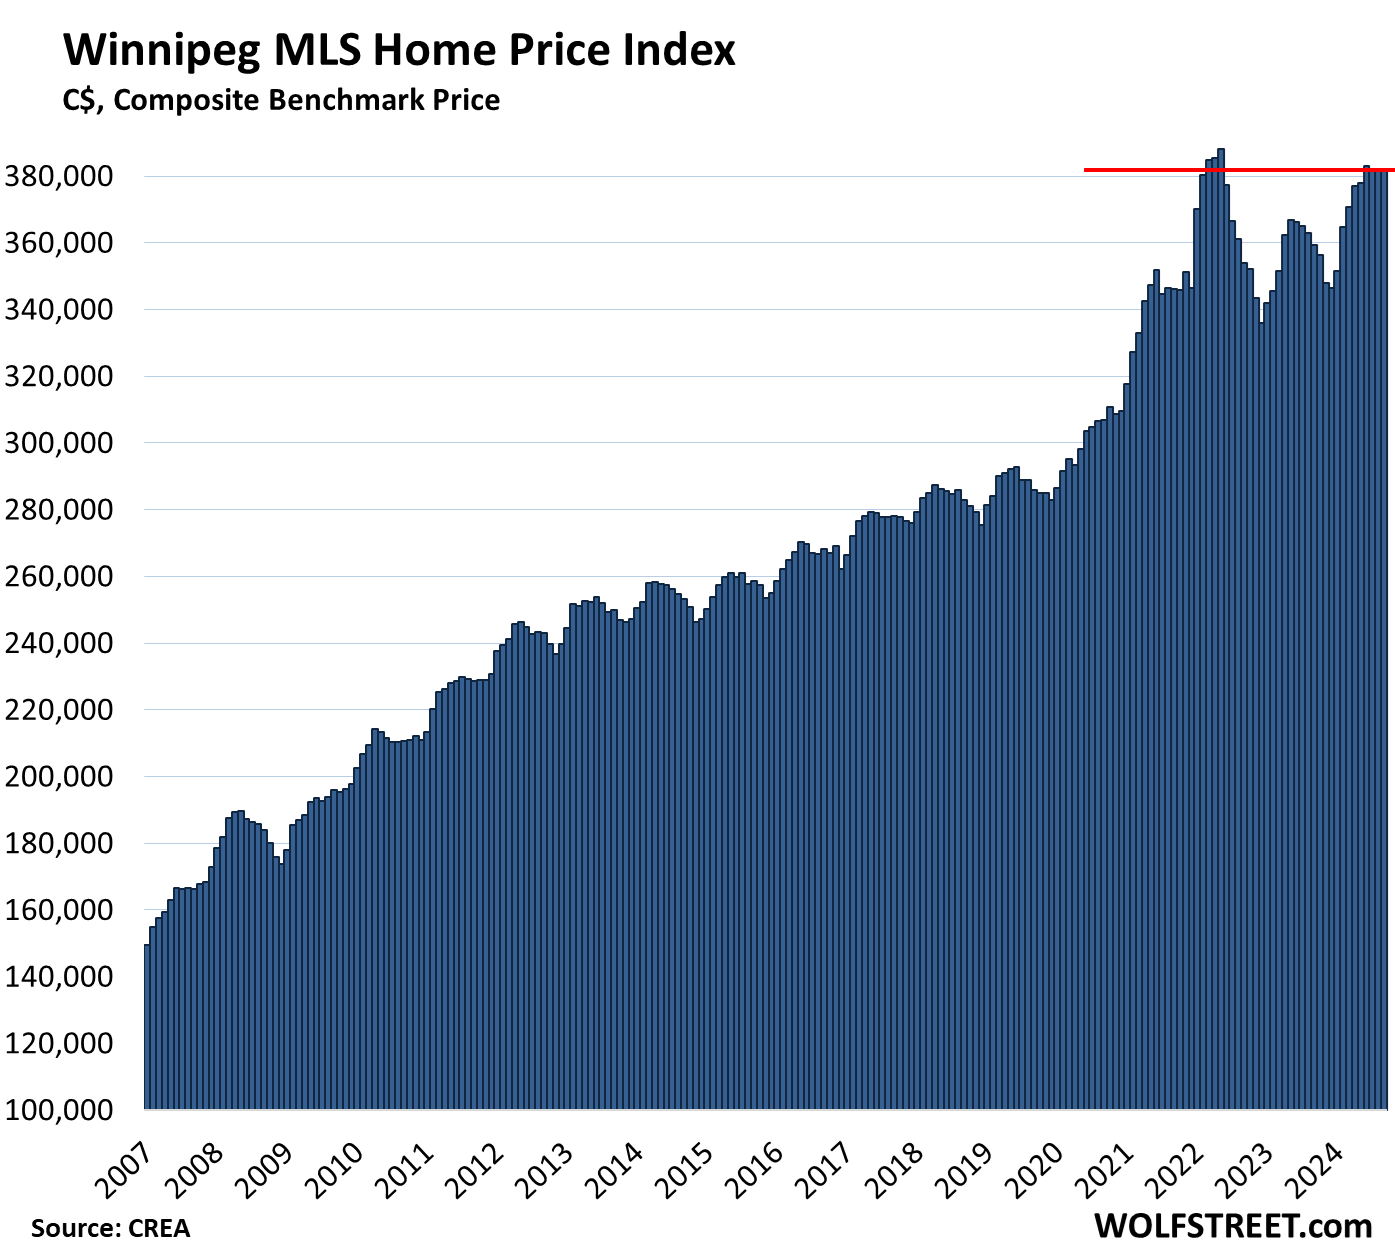
Winnipeg, single-family benchmark price:
- Month-to-month: roughly unchanged for third month at $382,200
- From peak in March 2022: -1.5%
- Year-over-year: +6.3%
Enjoy reading WOLF STREET and want to support it? You can donate. I appreciate it immensely. Click on the mug to find out how:

![]()
Thanks WR for this report.
It is hard to believe that people are paying so much $$ for homes in Canada.
Looks like free money has truly turned people’s brain into mush.
It is crazy what we Canadians are willing to pay for real estate. Our B.C. provincial government has gotten into the business of subsidizing home purchases. “Lucky” buyers can have tax payers pay 40% of their mortgage in certain developments. A two bedroom apartment on 99 year leased land will cost a mere 1.3 million – and you don’t even own the land.
https://www2.gov.bc.ca/gov/content/housing-tenancy/attainable-housing-initiative-heather-lands
More precisely, they can delay payment on 40% of the property. The government isn’t buying 40% of the house for them permanently.
This is largely predictable. Monetary policy is of limited value when l playing around with what little downside room there is on interest rates. This is the continuing price of the 2008 financial crisis. Lowering rates as has been done recently will not make a significant impact on demand. Presumably sellers are looking for too much money because they now think buyers can afford more. For the most part they can’t. Interest rate policy is not going to solve this crisis. People that should know better are pretending (deceiving) this is not the case.
Don’t sell the Bank of Canada short they’ll sacrifice the Canadian dollar to bring interest rates down as far as they can take them.
As far as I can tell, the “bubble” has taken a hit, but is still winning overall. Down single digits after doubling in the past 10 years.
1. “…down 16.7% from the peak in March 2022” (first paragraph) means “down DOUBLE digits,” not “down single digits.”
2. Give it some time. RE moves slowly, as you can tell. The peak was 2.5 years ago.
3. Just for the fun of math: If something “doubles” in x years (say from 100 to 200), and then drops 50% over the next y years (so from 200 back to 100), it gives up ALL the gains, not half of the gains.
4. If something “doubles” in x years (from 100 to 200) and then drops only 30% over the next y years, so from 200 to 140, it gives up 60% of the gains.
5. If something “doubles” in x years (from 100 to 200) and then drops only 16.7% over the next 2 years, it gives up 33.4% of the gains. That’s over a third of the gains so far.
Wolf, it might be instructive to show the price charts back to the 1990s.
The early 90s housing bust up here was so severe it took roughly 20 years for prices to match their 1980s highs again.
“…might be instructive to show the price charts back to the 1990s.”
1. No, it would not be “instructive” because the Canadian housing bubble was a creature of the 1980s, it peaked in about 1989 and then deflated for over a decade. So a chart covering that housing bubble and bust, would need to start in about 1982 and end in about 2005. People who study history can go do that, as far as I’m concerned. This is not a history site.
2. CREA data goes back to only 2005.
The lower-lows on the Toronto and Hamilton-Burlington condo charts are a red flag leading indicator.
During the 2006-2010 housing bust, condo prices fell faster than house prices. Looks like that will happen again. Bet it’s not just in Canada.
Condos are easier to speculate with than houses: standardized designs built in volume, simpler to maintain, and less-expensive to buy/sell.
Seems likely that as more condo price charts show lower lows, more speculative holders will look to sell rather than holding a declining asset.
“Condo prices fell faster than house prices. Looks like that will happen again. Bet it’s not just in Canada.”
I agree – just look at the ‘condopocalypse’ taking place in Florida lately: some properties are literally down >50% from peak, and are back to their post-GFC (2014-ish) prices.
Similar declines coming soon to a condo market near you…
I think the Florida condo collapse is due to the nature of ownership. Vacation home vs primary residence. AND don’t forget the insurance premiums.
Not to mention all of the flood damage plus the condominium building standards remediation requirements.
I think the Florida condo collapse is due to the condo building collapse, and the realization that older condos have $billions in deferred maintenance.
Would you buy a 30 year old condo in Florida? I wouldn’t.
The increase in capital gains tax is a disincentive for Mom and Pop small investors who might have bought a condo to rent out for extra income.
Been harsh for many. Canadian here.
Impact of: High prices; moderated slightly. Short term mortgage renewals (what’s available) into higher rates. 25% cummulative inflation. Rising taxation. Low wages, with low inflation adjustments, for many. Sellers’ expectations, (and others connected to supporting high prices) . Decade or two of central banks enabling. Immigration of wealthy, business types, and unmatched skills to replace retiring boomers (esp who build and maintain). Policy? avoidance of major roll back in asset prices; so except for top incomes, and where kids have parental mortgage supports, then a policy? preference for declining standard of living.
Imo.
Cities like Edmonton are rising because, for now, they have lower prices than other cities so you can still arbitrage a sale in, say, Toronto, to buy there.
Winnipeg at least used to be a bit weird as the price dynamic was extreme regarding location. Still much cheaper overall than Van or TO.
Real Estate prices will have to lower unless wages seriously increase, IMHO.
That isn’t arbitrage. More like a long/short. ;-)
Winnipeg’s prices were not weird due to location, far from it.
It was due to a City council which did everything in its power to prevent overgrowth in the city. The city council slowly retired or were ousted from their seats and the “new” city council did not have the same opinion as the old city council. It is why Winnipeg was stagnant as a whole for 20+ years. It is part of the reason that many HQs left Winnipeg in the 80s for Calgary, which you could say Winnipeg actually helped bolster Calgary’s initial growth boom. It started in the 80s (could be earlier…I am old, but not old enough to remember the late 70s city climate). Winnipeg also had numerous mayors through those years who’s only goal was to line their pockets at the expense of the denizens.
Couple that with the high property taxes that Winnipeg had at that time, which were higher than the rest of the country for a long time – which offset the actual pricing of housing…and that is why Winnipeg had low prices for as long as it did.
Winnipeg is no longer in that same place, many other cities have raised their property taxes to the same levels, and a city council that encourages growth has led Winnipeg into a renaissance. The business sector is growing, causing many more people are coming to Winnipeg. Winnipeg and Regina are two of the fastest growing cities in the country now, along with the Atlantic region’s cities.
Either way, I just wanted to correct your reasoning for why Winnipeg was “weird” with its prices.
Winnipeg house prices were suppressed for decades because Winnipeggers had no money. MB income tax levels were – and still are – higher than other provinces, except for the Atlantic provinces.
Just a clarification from a long-time Ontario resident.
The Hamilton/Burlington figures are distorted because Burlington is an ultra-rich suburb and Hamilton is a depressed industrial zone. Burlington home sale figures lift the total and distort it unreasonably; Hamilton ones do the opposite. Because the Burlington market is more robust, it has an outsized influence on the overall market, even though there’s only 160,000 people in Burlington and half a million in Hamilton …
You can say the same thing about any diverse real estate market — there’s always one end that distorts the other, or whatever.
There are areas in Vancouver that are down substantially, and there’s some bloodletting going on, but others are not, and so you get the overall metro figures. That’s just how it is everywhere.
Rate hikes i.e. higher monthly mortgage costs probably dominated most Canadian buyers’ minds for the past 2.5 years.
Now that the BOC has started a new rate-cut cycle (which directly affects variable rate mortgages, and should draw down fixed rate mortgages in its wake), should someone really expect RE indexes to continue their descent much longer?
The simplest view: buyers are mostly waiting a few more months for the expected jump in affordability… while sellers who can’t wait to sell are making the price cuts necessary to unload promptly.
What buyers?
I’m just waiting for the last kid to finish school before leaving GTA and never coming back
This is the danger of increasing COL without increasing income.
Nobody NEEDS to be here, and can actually have a better life leaving.
you can buy a really nice house with BOF ocean front and acreage in Nova Scotia for a 40ft by 60ft empty lot in Toronto. We moved 10 years ago and never looked back
Looking at these graphs the peak is Mount Everest and it doesn’t seem like the descent has even reached the summit’s base camp.
….don’t think these home prices in Canada should fall much at all, why should they, everything else has doubled, tripled. Why should home prices and home owners suffer the agony…
Over the coming months, as prices continue to rise on everything…wages will also continue to rise, the markets inching upwards, gov spending higher, I wouldn’t expect much in the way off falling home prices in Canada or here.
Then add on higher building costs, higher land values, higher taxes, insurance.
If your looking for a “bang” for your buck…a pop or pip squeak is what your going to get.
I saw an interesting graph for U.S. build to rent homes.
The graph started in 2000 but prior to 2010, BTR were about 2.5% to 3% of all new construction.
2010 to 2020: 4.5%
2021-2022: 6.5%
2023: 9.5%
Not sure the 2021-2024 is just a blip or this is will continue at the 6.5% to 10% levels. With the ability to build and sell the mortgages that will be backed 100% from any defaults probably means it is very low risk for this type of business.
If the BTR area experiences a downturn, just send the keys back to the bank….but what I mean is MBS holders….. but what I really mean is the GSEs….what but I really really mean is the Government……but what I really really really mean is the taxpayers.
Yes, it has been huge – the biggest trend in homebuilding. And we discussed this here many times, including in April with an article and chart, see below.
Build to rent is higher-end supply of single-family rentals for renters of choice with higher incomes. They’re very popular. People use them to arbitrage the lower rents v. monthly purchase costs. Instead of buying, people rent a similar new house for $1,000 a month less, and with all the flexibility that comes with renting. And no worries about homeowners’ insurance and property taxes.
ALL the big single-family landlords are doing build-to-rent, some through their own homebuilding divisions, others through deals with homebuilders. And what they’re selling are their individual houses they’d bought out of foreclosure in 2012 and that are scattered around all over the place and are inefficient to operate. They’re not selling the new build-to-rent houses – because they’re much less costly to operate. They’re selling the houses they bought in 2012.
I put some numbers in the linked article below, including the number of individual houses the big landlords sold while they added build-to-rent homes.
Your conclusion of build-to-rent homes going back to the bank is likely wrong, for these reasons:
1. Subdivisions of build to rent are very profitable because they’re much more efficient to operate than the scattered homes that the landlords bought out of foreclosure.
2. The houses they bought out of foreclosure by now have doubled and tripled in value, and they’re selling those for capital gains, to fund the new build-to-rent, and to shed the high operating expenses.
3. The big landlords don’t finance their houses with mortgages. They borrow at the institutional level as needed by issuing bonds, including asset-backed securities (ABS) backed by rental cash flows.
Biggest Landlords Pile into “Build-to-Rent” Single-Family Houses, but Sell Older Houses into this Overpriced Market
Here is a quote and a chart from my article:
Last year, 27,495 build-to-rent single-family houses were completed in professionally managed communities with at least 50 single-family rental houses in markets covered by Yardi Matrix research, according to an analysis by RentCafé, based on data from Yardi Matrix. Up by 75% from 2022!
It does not include single-family rentals that are not located in build-to-rent communities or in smaller build-to-rent developments.
Greater Vancouver is getting clobbered as we speak. For more daily market updates/analysis, join The Metro Vancouver Housing Collapse Facebook group or, follow the group on Twitter.
RE terminology trivia: From BC Gov site
What is the difference between a condo and strata? There isn’t one! Condo or condominium is the word used for strata properties in BC or Ontario. Most people informally refer to apartment-style housing as a “condo,” to distinguish them from townhouses or bareland stratas.
The word ‘condominium’ anywhere means shared ownership. The period when France and Britain ruled Egypt jointly is known as the Anglo-French Condominium.
Thanks for the data, is it wrong to think this is a good thing? I’m a young man from the GTA, and I don’t see a way forward with current housing prices. I am 21 years old, getting through college, and wondering if I’m ever going to be able to afford a house. I even considered buying land and a cheap temp home like a van and slowly building my own house myself, but even land prices are becoming ridiculous unless you go sleep with the polar bears. I don’t understand why this country’s economy is held up by RE, I don’t get why our gov thinks fixing the housing crisis means facilitating handing out more loans that will inflate the house prices further, and making an ouroboros out of the business. I can’t see a single reason why prices should be like this. (Ethically.. I can see the pointers as to why It’s happening statistics wise).
You’re 100% right. It’s absolute madness. The truly ethical thing to do is to let the RE market collapse and reset at a reasonable level. Wait. Be patient. Do not think about buying anything in this market.
Daniel,
Why on earth would staying in the GTA be a primary option? I’m an old guy now but when my friends and I were starting out we had two criteria….go where the work is and/or move to where there appears to be a future. Then stay for awhile and prosper over time. A BCer here, I did not stay in my home town but moved just a few hundred km away for a career. I now have a nephew trying to start out in his home town of Victoria, and he finally realised this year he won’t be able to stay there and ever ever get ahead. Accepting that is the first hurdle. Just an opinion so take it what it’s worth.
My Newfie neighbour had 6 brothers. Just one stayed in St Johns to take over the family mechanics/garage business, the rest all moved away across Canada. My neighbour was a mechanical engineer and worked in the pulp industry and in oil and gas….all over the world. He is now retired on the BC Coast.
As to condo price drops and stagnation there is an add on for the article. This year the BC Govt came down hard on Air B&B speculators. It has really hit vacation spots like Victoria and Kelowna. It is now law that people can only offer an air b&b in their primary residence in cities over 10K. In smaller centers they sit empty most of the year, anyway. This is designed to free up rentals. The above comment about Govt providing free money for buyers is not true. They are proposing low interest loans for down payments for first time buyers to get into the market.
Use that outside-the-box thinking, and your youthful energy, free time, brains, brawn, etc. , and I guess you are going to succeed. Just don’t get caught up in whining or waiting for someone to hand it to you or whatever they are saying about kids these days.
What you don’t understand is how the system rewards the speculative impulse more than the development or building ones. Only radical changes in tax systems at all levels of government in Canada could change that and that may take a while.
DM: Hurricane-battered Florida has four of the top 10 cities where home prices are dropping the most
Florida has four of the the top ten cities where house prices are falling the most in the last year, according to new data.
https://wolfstreet.com/2024/10/15/the-most-splendid-housing-bubbles-in-america-sept-update-prices-drop-in-26-of-28-big-metros-even-san-diego-los-angeles/
Rents are still rising in Calgary. My mom owns a condo and is probably the nicest landlord in the universe, didn’t raise rent for an entire year, but now her insurance is going up, as are the condo fees (inflation again)….so the rent will go up around 10%. Politically right leaning Alberta is very pro-landlord. But anyway, I’m sure the current tenant will stay, it’s a nice condo after all, and everything else in the surrounding neighborhood is smaller and more expensive, with a worse view.
Vancouver will be the housing market to watch as the Yuan continues to fall. A ponzi needs a flow of new money to continue and with the Yuan falling that means more and more Chinese from China are shut out of the Vancouver housing market due to the falling value of the Yuan vis-a-vis the Canadian dollar. If the Canadian housing market breaks Vancouver will be the first housing market to break.
Rate cuts by the Bank of Canada can influence buyer behavior in several ways, particularly in the housing market and consumer lending sectors. it often leads to lower mortgage rates. This makes borrowing cheaper for home buyers, effectively reducing their monthly payments. For prospective buyers, this can make purchasing a home more affordable and attractive, nudging them to enter the market.
But what we have seen so far, it nudged SELLERS into the market, and inventory has been surging.