Decade of Stagnation of Industrial Production in the US, Japan, EU
Adding to the picture of crummy demand for goods around the world, the CPB Netherlands Bureau for Economic Policy Analysis, a division of the Ministry of Economic Affairs, just released its preliminary data of its Merchandise World Trade Monitor for June.
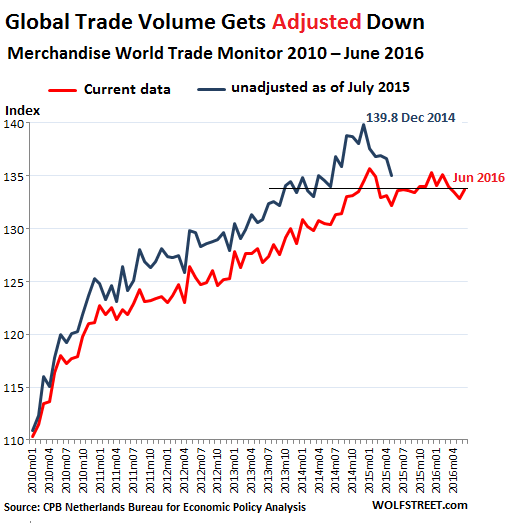
Trade volumes rose 0.7% in June from May, after falling 0.5% in May, but were about flat year-over-year, and below the volumes of December 2014!
On a quarterly basis – it averages out the monthly ups and downs – world trade fell 0.8%, contracting for the second quarter in a row.
The CPB recently adjusted its world trade data down, going back many years. The new data now depicts a post-Financial Crisis recovery of global trade that was a lot weaker than the original data had indicated. These downward adjustments of 2% to 3% came in a world where economic growth, according to the IMF, is stuck at 3.1% in 2016.
This chart of the CPB’s World Trade Monitor index shows the old data released as of July 2015 (blue line) and the newly adjusted data released today (red line). Note the 4.4% drop from the peak in global trade volumes in the original data for December 2014 and in the current data for June 2016!
World trade is a reflection of the goods-producing economy. Services don’t get shipped around the world. Goods do. So industrial production, excluding construction, is key. And here the trend is awful for advanced economies.
Global industrial production, excluding construction, rose 0.6% in June, after a 0.3% decline in May. The index for industrial production in advanced economies rose to 102.5, below where it had been in January (103.4), a level it had hit after the Financial Crisis in December 2012, but down from the glory days before the Financial Crisis when the index peaked in February 2008 (107.8).
And here’s a tidbit: the first time that the index hit the current level had been in April 2006. A full decade of stagnation.
To varying degrees this happened in the US, Japan, and the Eurozone. Only “other advanced economies,” according to the CPB, have by now exceeded their pre-Financial Crisis levels.
Industrial production has shifted to emerging economies (“cheap labor” economies) for many years, such as China, as companies in the US, decades ago, and eventually in Europe and Japan began outsourcing and offshoring production to emerging economies. Hence, industrial production in emerging economies has surged over this period. This was particularly the case after the Financial Crisis when companies in the US, Europe, and Japan redoubled their efforts to get production relocated offshore.
This chart shows the CPB’s industrial production index globally (green line), and also separated by advanced economies (the dismally flat-ish blue line at the bottom) and emerging economies (brown line at the top):
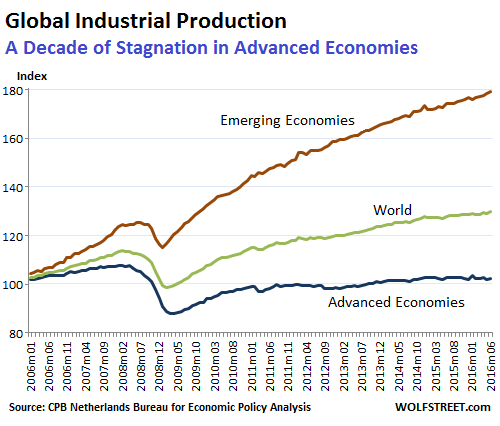
While industrial production plunged in advanced economies during the Financial Crisis and never recovered to pre-Financial Crisis levels, it barely dipped in emerging economies and then began to re-soar. It’s the essence of the multi-year stagnation in industrial production in advanced economies – the very economies that have been shifting to a “service-based” model where economic growth has been languishing for years.
Yet, totally unperturbed by reality, stocks have continued to march higher, causing the head of credit strategy at Citigroup to lament so eloquently, “Everything feels distorted and unnatural.” Read… “Mother of all Shorts” when Stocks Cave to Reality?
Enjoy reading WOLF STREET and want to support it? You can donate. I appreciate it immensely. Click on the mug to find out how:

![]()
first a warning: I always call our CPB statistics office the Ministry of Truth. They are worse than the pathetic liars of Eurostat and the BLS.
Then the real question: what are they measuring trade in, hopefully not in euros or dollars? Because with all currencies plunging in value, that tells you very little and reality would be a lot worse than it looks. There is a 40 page document with details on their website but I’m a bit lazy today …
For several years we have become accustomed over here to our CPB cheering the huge improvement of the economy as evidenced by the increased shipping of products through the port of Rotterdam, compared to previous year and measured in euros or dollars of course. I all looked rosy as long as the oil price was rising (oil and oil products are VERY important for that port) but last year they suddenly changed the subject. I guess they increased the importance of financial products in the national index over the last years so things still look great (debt is booming again, to make sure the Dutch remain in the top three worldwide for total debt).
Politicians claim the Dutch economy is still growing (“we are doing great!”). This may be true in euros, both for industrial production and retail sales, but not in volume – it is all stealth inflation and actual sales volume (in units, kg or whatever) is probably down. As an example, the catering industry is “growing” again after some bad years, but only thanks to much higher prices.
P.S.: is it just me or does the 2015 dip in the chart look better after the adjustment? Are they preparing for more downside?
BTW, this is the same CPB that always cheers rising home prices (up 5% on average again this year, and over 20% around Amsterdam; the Netherlands is booming again!!), writes that every year since 2008 the rise in rents was bigger than the rise in homeprices (quick renters, buy a home before you are priced out forever) and at the same tells us that inflation in Netherlands is ZERO (and that this is really bad, we need much higher inflation).
Just imagine how the change in monthly costs compares between renters (up 5-10% yoy) and homeowners (down 10-30% yoy?), with the current sub-1% mortgage rates. The monthly savings for the average home-debtor thanks to NIRP are probably big enough to compensate all the other inflation. But you can’t be both a renter and a home-debtor and enjoy the average 0% inflation that the CPB is calculating.
lies, damned lies and statistics…
Inflation? The CB’s have it.
The gold-silver ratio as an indicator measuring inflation momentum is on the rise once more.
Enormous monetary inflation has already taken place, but has so far mainly only affected asset prices. Strongly rising food prices are viewed as disastrous, while rising house prices are celebrated.
Both indicate a decline in purchasing power, it matters not whether it is expressing itself by rising food prices or rising house prices.
The CB’s pumping 100’s of billions into the global economy per month will eventually reach the point of “no effect”. This is the diminishing marginal productivity of debt. The more debt you have in the system – the more debt you need to support the previous level of debt.
The “no effect” point of no return is very close. At that juncture, faith in currency is lost and the currency effected suffers a catastrophic crash.
Nah, they know helicopter money isn’t an economic bootstrap, not that they care really except for providing lip service and maintaining appearances.
Central banks are only pumping 100’s of billions into the pockets of their close friends, relatives and future employer special interest groups. Chances are, prices might rise primarily due to Argentinian style shortages.
But I’m sure it’s all on the up and up, it’s gotta be.
Markets were important when they represented what was going on in the real economy.
Now they just represent Central Bank stimulus and manipulation.
They mean nothing and are irrelevant.
Markets keep rising because Central banks can create money without limit, something you should know already.
When the real economy crashes, artificially inflated markets will come back to reality.
You can pay attention to them again then.
For now, watch the real economy and not the meaningless markets.
The bearish billionaires are obviously watching the real economy and not the meaningless markets.
Follow the smart money.
MARKET: – [noun] Late old English;
A meeting of people for selling and buying.
There are many definitions for the word MARKET. The above is the most definitive, purest form.
As it pertains to the financial “stock market” it not longer applies. These so-called (increasingly run by machines) “markets” contain very little to no price discovery and therefore little to no valuation information, so as to effect a mutually beneficial sales agreement between people.
These financial “casinos” that insist on calling themselves markets are nothing more than houses of chance. Where the “odds” are always tilted in favor of the house. You lose. Next!
Zero Hedge had an interesting article a few days ago about the cattle futures being disconnected from the cash market for cattle. It is harbinger for the rest of the futures market. When the spreads don’t make sense and you can’t even count on getting physical delivery, all you really have is a betting parlor.
Or bucket shops, outlawed from the great depression until not so long ago deregulation was passed.
Markets are an important vehicle of theft for WS crack heads and cocaine hounds stealing from mom and pop’s 401K retirement account.
Yeah, and Mr. & Mrs. Slick Willy are at the top of the Heep…balanced on Jamie and Lloyd’s shoulders..
Ludicrous LOL> Congress appropriates and a Republican Congress is Wall St. best friend. Try again.
It’s only partially my fault. I still use my 2006 TV. The rest is on Sony because it still works.
An update from the road. I have heard rumblings in the company grapevine that freight is a little slow. I am personally quite busy. The new tech in the trucks has finally gotten fairly stable, and I haven’t had the downtime issues with this truck as I’ve had in recent years. DOT keeps fiddling with the hours of service regulations, a bit of bureaucratic disruption that is like an itch you can’t scratch. The moochers are back, but not in droves. There has been a lot of road construction this year but I think it has to do with the neglect of the last few years catching up with them. Good sit down restaurants continue to disappear from the truckstops, and fast food is king. Loves is the up and comer, the company has shifted fuel purchases and minor service repairs over to them. I just wish they’d get some decent coffee. Parking continues to be an issue in the Northeast and the larger metropolitan areas, and in California. I recently had a trip that hit all the garden spots with deliveries in SF, LA and San Diego. I was never so glad to finally head back east. Keep up the good work Wolf!
“This was particularly the case after the Financial Crisis when companies in the US, Europe, and Japan redoubled their efforts to get production relocated offshore.”
And one wonders why folks don’t have money to spend. Automation will kill all economies in the end. Failure to buy anything will kill companies in the end. Debt overpowering stock valuations will kill investors in the end. Elites see this very clearly and have prepared for it.
Why is this so hard for everyone to get. AS stupid as I thought the “Hunger Games” was, I can see a shadow case upon us.