Student loan delinquencies are rising.
Rising household debt would be a hopeful sign that consumers are once again living beyond their means, that they’re finally spending money they don’t have, that they’re in fact transferring money from the future to the present in their heroic effort to stimulate Wall Street, corporate earnings, and the Fed’s self-esteem, or something. So we jubilate when we see signs of this economic miracle happening once again. We’ve waited for it long enough.
Household debt – mortgages, credit cards, auto loans, student loans, and other debt – jumped $241 billion, or 2.1%, in the fourth quarter 2013 to reach $11.52 trillion, the New York Fed reported. It was the largest quarterly rise since 2007, near the peak of the last bubble. For the year, consumer debt rose $180 billion – the first annual rise since 2008 when the last bubble imploded. But it’s still 9.1% below the all-time record of $12.68 trillion, set in that fateful year of 2008. Very reassuring.
But that household debt has bad breath.
Mortgage balances, which account for 70% of total household debt, rose $152 billion in Q4 2013, to $8.05 trillion. With that whopper, mortgage debt for the entire year increased by $16 billion, the first gain after four years of declines. One-quarter wonder? Originations of new mortgages, after rising steadily since 2011, plunged $97 billion to $452 billion. Down for the second quarter in a row. Investors and private equity funds, increasingly dominant buyers in some markets, have driven up home prices and have successfully pushed first-time buyers and others off the cliff. So this isn’t exactly a sign of health.
Home equity lines of credit declined 1.1% to $529 billion. So total housing debt was barely in positive territory.
Non-housing debt – credit cards, auto loans, student loans, and “other” debt – looked better on the surface with a 3.3% gain that pushed it to $2.94 trillion.
Credit card debt rose $11 billion to $683 billion in Q4, enough to nudge the year into positive territory, for the first time since 2008! Auto loan balances were up $18 billion for the quarter and $80 billion for the year to hit $863 billion, the highest level in the data series going back to 2004. The glory days may be over. In another ominous sign for the auto industry, newly originated auto loans dropped in the fourth quarter to $88 billion.
Student loan balances soared $53 billion in the quarter and $114 billion for the year, to end at $1.08 trillion, an unbroken record in the data series of ever higher highs. Student loans now make up 9.4% of total consumer debt and 36.7% of non-housing debt. In 2003, student loans accounted for 3.1% of total consumer debt and 12.2% of non-housing debt. The $1.86 trillion in credit card debt, auto loans, and “other” debt are now a smidgen below where they were in 2004. But student loans have more than quadrupled.
Student loans are going to bankrupt a generation.
Not that today’s students are getting more education or a better education or a more useful education, or that they make more money when they graduate – you’ve got to be kidding! Instead, tuition has skyrocketed over the years as universities and colleges have perfected the art of milking the American system of student loans and grants. Students are getting a similar education as before, but at a much higher price. And afterwards, they’re left with a mountain of debt on their fragile shoulders.
Hence, delinquencies. Oh my! Mortgages that were 90+ days delinquent peaked in Q1 2010. For credit cards, the peak occurred in Q2 2010, for “other” debt in Q3 2010, for auto loans in Q4 2010, and for HELOCs in Q3 2012. Since their respective peaks, delinquency rates have dropped. Except for student loans.
Student loan delinquencies were barely above 6% in 2004 and 2005, meandered up to 7.6% by Q3 2007, to 9.2% in Q3 2010, eased off a bit in 2011, then soared. By the end of 2012, they hit 11.7%. Then they dropped to 10.9% in Q2 2013, espousing a tsunami of false hope that it would turn around somehow, only to jump to a new record 11.8% the next quarter. In Q4, delinquencies eased off, accompanied by another round of false hope, to a still astronomical 11.5%.
In American culture, credit card delinquencies have always been highest, with a range of 8.5% to 10.2% between 2004 and 2008. During the crisis, they spiked to 13.7% before dropping again. In Q3, 2012, a new phenomenon occurred: for the first time ever, credit card delinquencies, at a still lofty 10.5%, were trumped by student loan delinquencies. The gap has widened since, with credit card delinquencies at 9.5% and student loan delinquencies at 11.5%.
The official student loan delinquency rate, as dizzying as it is, actually covers up a problem that is even worse: many borrowers don’t have to make payments yet because they’re still in school. If the delinquency rate were calculated based only on borrowers who have to make payments, it would be much higher.
It’s our student-loan subprime fiasco. In the age group below 30, 38% of the borrowers had credit scores of under 621, and 29% had scores between 621 and 680. At that lower end of the credit spectrum, student loans grew the most during the year:
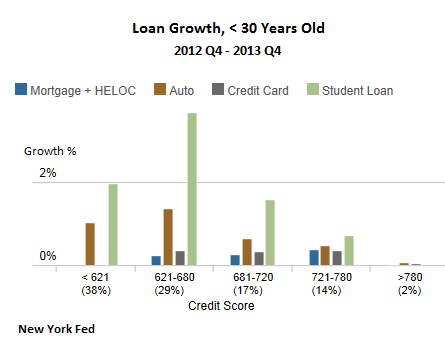
These borrowers at the low end of the credit spectrum are least likely to be able to service the mountain of debt they took on to attend schools that often left them unprepared for a job that pays enough, if they can even find a job in one of the toughest job markets for young people in recent memory.
Not that the rest of the consumers aren’t struggling: of their total debt, $580 billion was 90+ days delinquent. And 332,000 of our unsung heroes who were trying to move the economy forward and fatten up corporate earnings were rewarded with a bankruptcy notation on their credit report during the fourth quarter, up about 8% from a year ago. And consumers hounded by third party collections – guys calling them incessantly to wring the last dime out of their wallets – is a story that simply gets worse. In 2003, less than 9% of all borrowers got hit by collections. During the crisis, the number peaked at 14.7%. Over the last two quarters, they dropped below 14%, halleluiah. But the average collection amount has ballooned inexorably from $900 in 2003 to over $1,500 now.
But their problems pale compared to the masses of young people who’re dogged by a lousy credit score and an outsized burden of student loans to be paid off over decades with the shrinking real salaries for the lucky ones who have jobs. And the unlucky ones can’t even ditch that debt in bankruptcy, unlike other debt. They’re starting out their working lives broke, and they stay broke. It will handicap their contribution to the economy for years to come. They’re our first debt-slave generation.
Enjoy reading WOLF STREET and want to support it? You can donate. I appreciate it immensely. Click on the mug to find out how:

![]()