An ominous trend picks up speed: the middle class is shriveling. In 1980, 60% of Californians lived in middle-income families. By 2010, only 47.9% did, according to a study by the Public Policy Institute of California (PPIC), a non-partisan research organization (24-page report PDF, 2-page summary PDF). Main culprits: declining incomes and disappearing jobs.
From 2007, when the recession began, through its end in 2009, family incomes across the spectrum dropped over 5%. But then, instead of going into recovery mode, they continued to go south for another 6% through 2010—the end of the timeframe of the study. Given the astronomical cost of living in California, the study defined a middle-income family as one that earned between $44,000 and $155,000 in 2010.
But the declines weren’t spread evenly across the income spectrum. Families whose incomes were in the top 10% saw their incomes decline 5%. Those at the bottom 10% of the spectrum, the poorest families in California, saw their incomes plummet by 21%.
In a further indictment of income inequality in California—something that is clearer than daylight if you walk or drive around with your eyes open—the upper 10% enjoyed incomes that were higher than those of their counterparts in the rest of the US, while the lowest 10% earned less than their counterparts elsewhere. And income inequality between to top 10% and the bottom 10% doubled since 1980, to where in 2010, the top end earned 12 times as much as the bottom 10%.
Family income is a factor of wages, hours worked, underemployment, and unemployment. The main culprit for the loss of family income during and after the recession was unemployment which, according to the Bureau of Labor Statistics, peaked at 12.5% from September through December 2010. It has since edged down but still hovers at 11.7% (preliminary, October 2011).
However, the BLS percentages of unemployment are a form of statistical hocus-pocus that distorts and understates the actual unemployment problem. Here are the raw numbers of employed people in California:
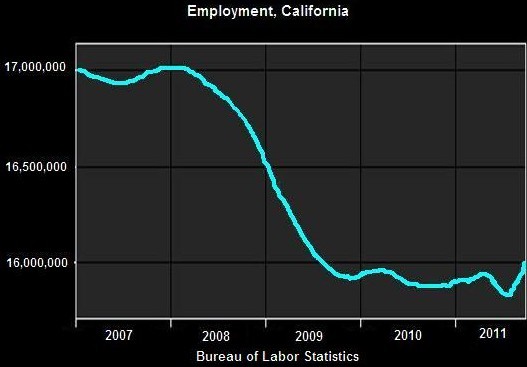
Peak employment in California occurred, according to the BLS, in January 2008, when 17,023,322 people were working. At the trough in August 2011—that’s correct, August 2011, that’s not a typo—only 15,830,729 people were working. During that period, 1,192,593 jobs had evaporated. Where the heck is the jobs recovery?
Maybe it’s in the future. Maybe it has started a couple of months ago. But there are certainly no signs of a jobs recovery in California before September 2011—and even that may turn out to be a fluke.
And if there actually is a jobs recovery that would raise family incomes? The PPIC warns:
If previous post-recession patterns repeat themselves, it is likely that lower-income families will recover much more slowly than those at the high end, potentially worsening income inequality that is already at a record high.
A thriving economy based on the American model requires a thriving and growing middle class. However, the current conditions—a shriveling middle class and rising income disparity—mark the transition to a banana republic.
Enjoy reading WOLF STREET and want to support it? You can donate. I appreciate it immensely. Click on the mug to find out how:

![]()