The Condo Bust deepens and spreads to more cities, unwinding some mindboggling Condo Bubbles.
By Wolf Richter for WOLF STREET.
Prices of mid-tier condos in the 24 bigger cities on this list have dropped by 12% to 29% from their respective peaks in 2021, 2022, 2023, or 2024. Each of them has its own chart below, with some additional data.
There are smaller cities where prices of mid-tier condos have dropped by 12% or more – including Killeen, TX, where condo prices have collapsed by 44% – but these cities are too small to be included on the list of the bigger cities. So some of them are listed separately here but without charts.
And then there are a bunch of bigger cities where condo prices have dropped, but less than 12%, and so they didn’t make the cutoff, and some of those are also listed separately, but without charts.
The 24 bigger cities where condo prices fell 12% to 29% from their peaks:
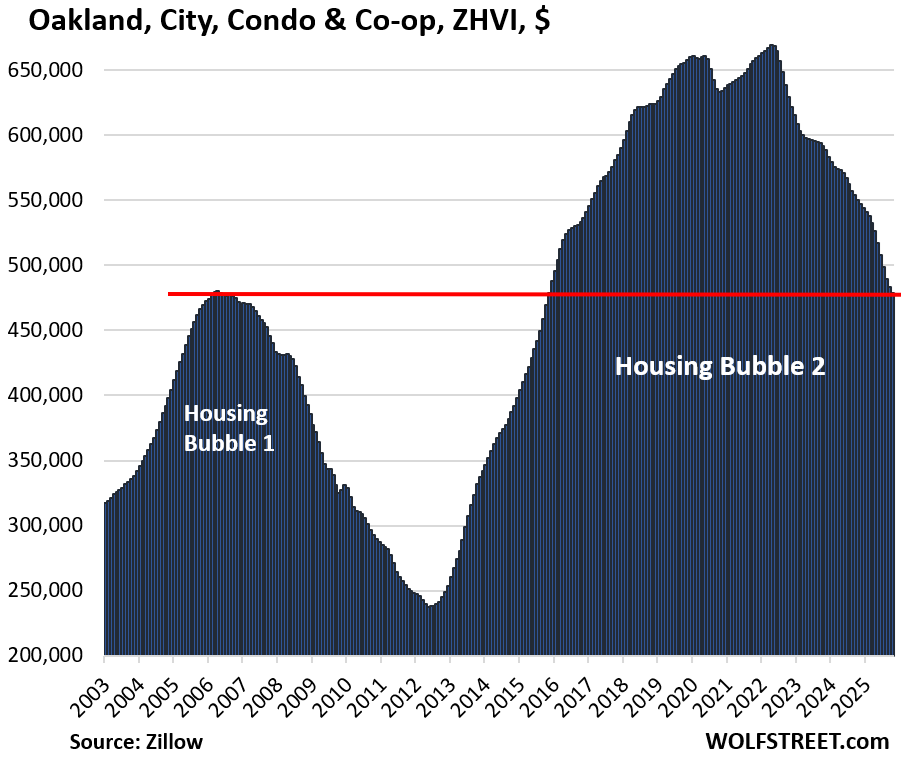
- Oakland, CA: -29% (2022)
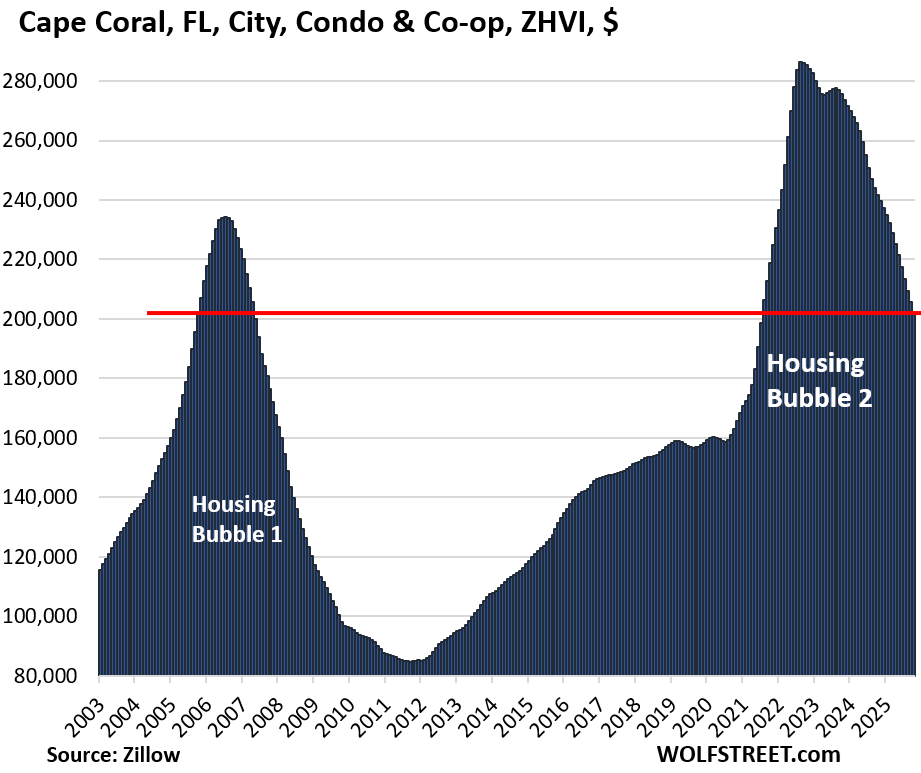
- Cape Coral, FL: -29% (2024)
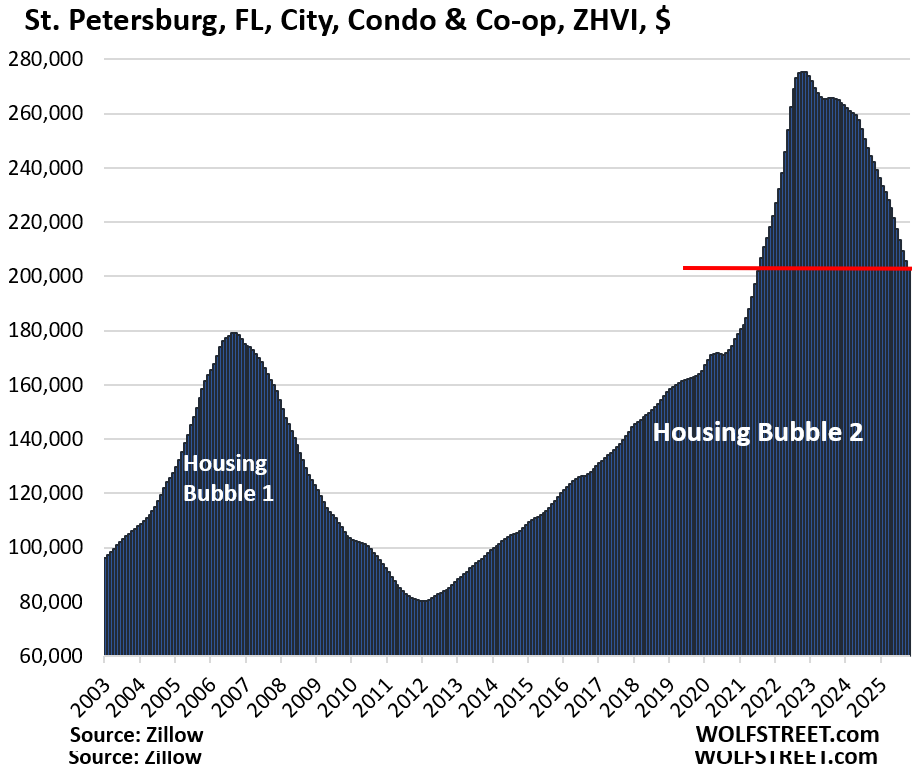
- St. Petersburg, FL: -26% (2022)
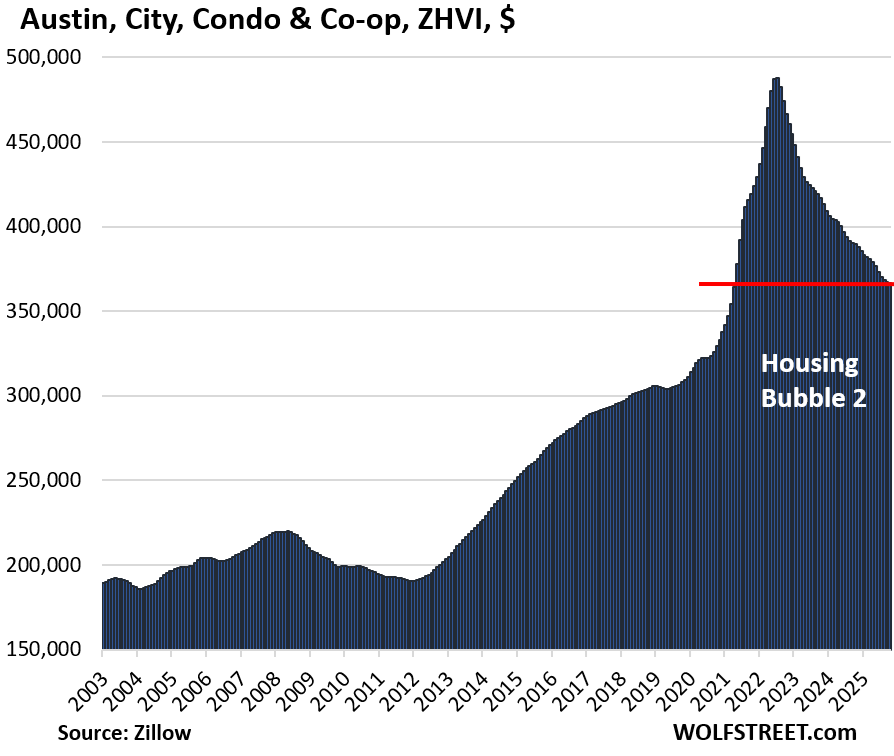
- Austin, TX: -25% (2022)
- Jacksonville, FL: -17% (2022)
- Tampa, FL: -17% (2022)
- San Francisco, CA: -16% (2022)
- Arlington, TX: -16% (2024)
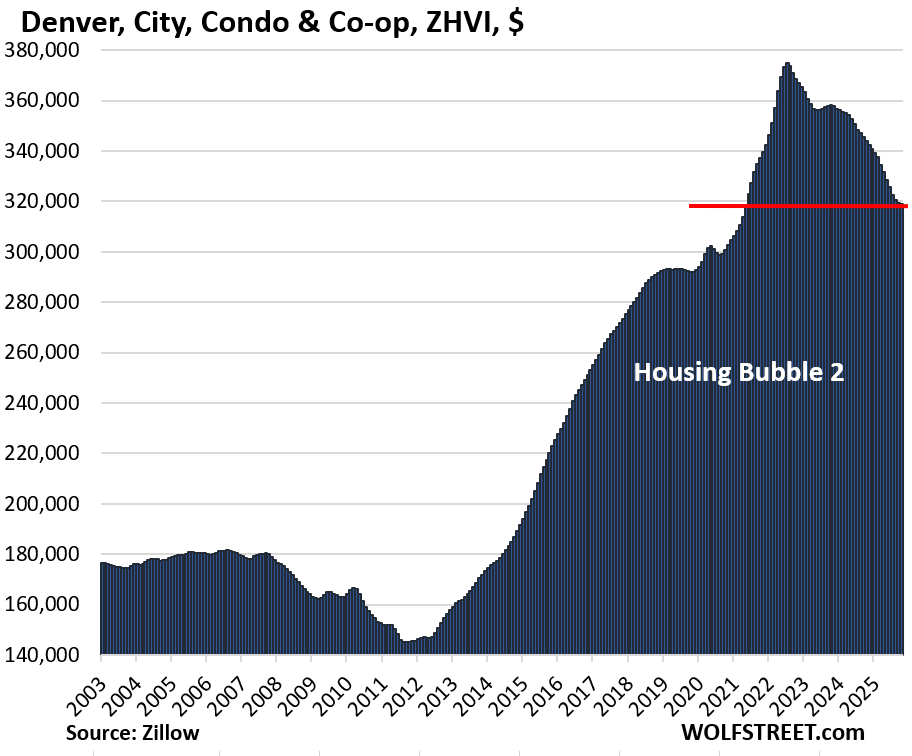
- Denver, CO: -15% (2022)
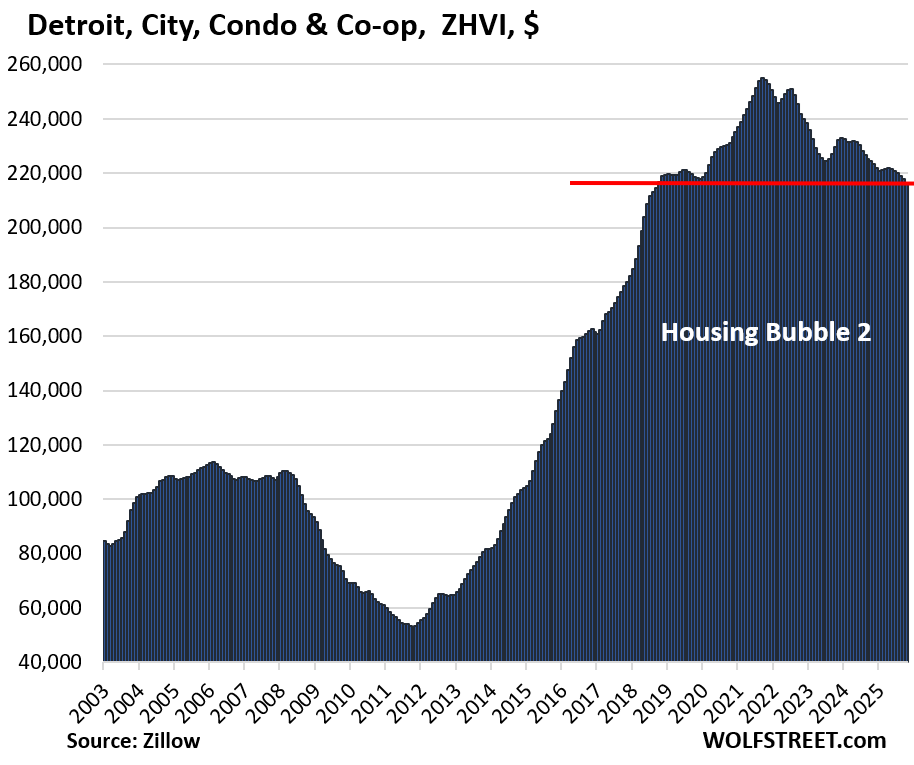
- Detroit, MI: -15% (2021)
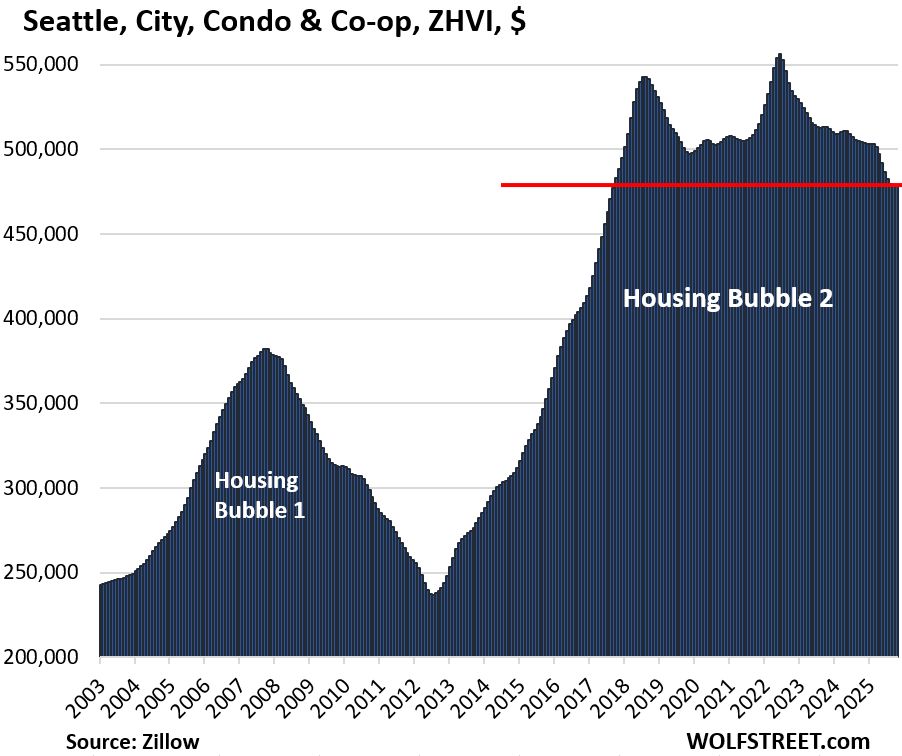
- Seattle: -14% (2022)
- Reno, NV: -14% (2022)
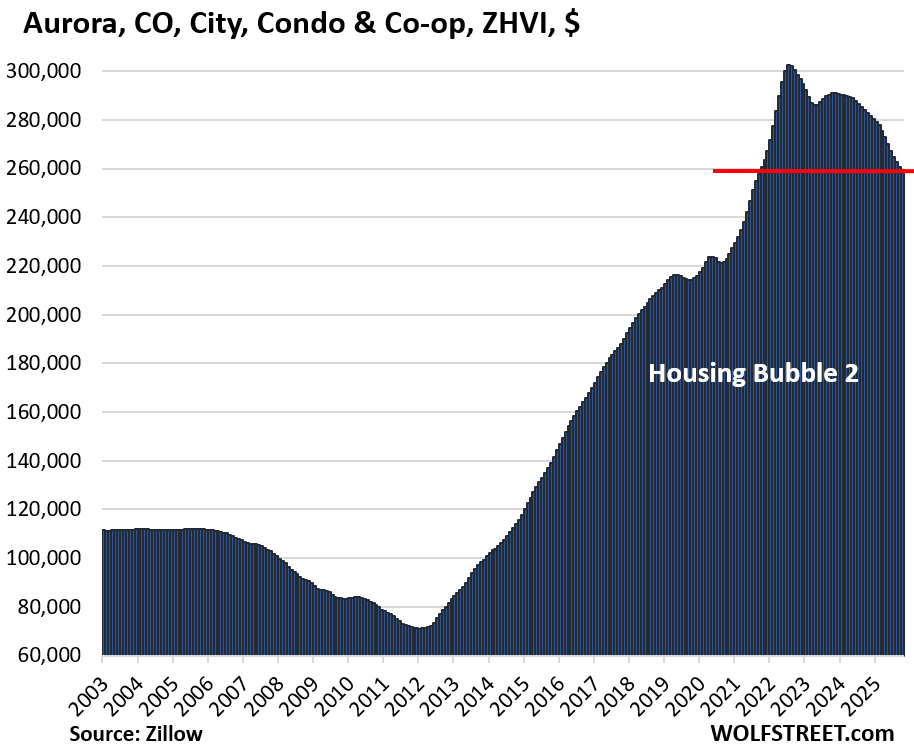
- Aurora, CO: -14% (2022)
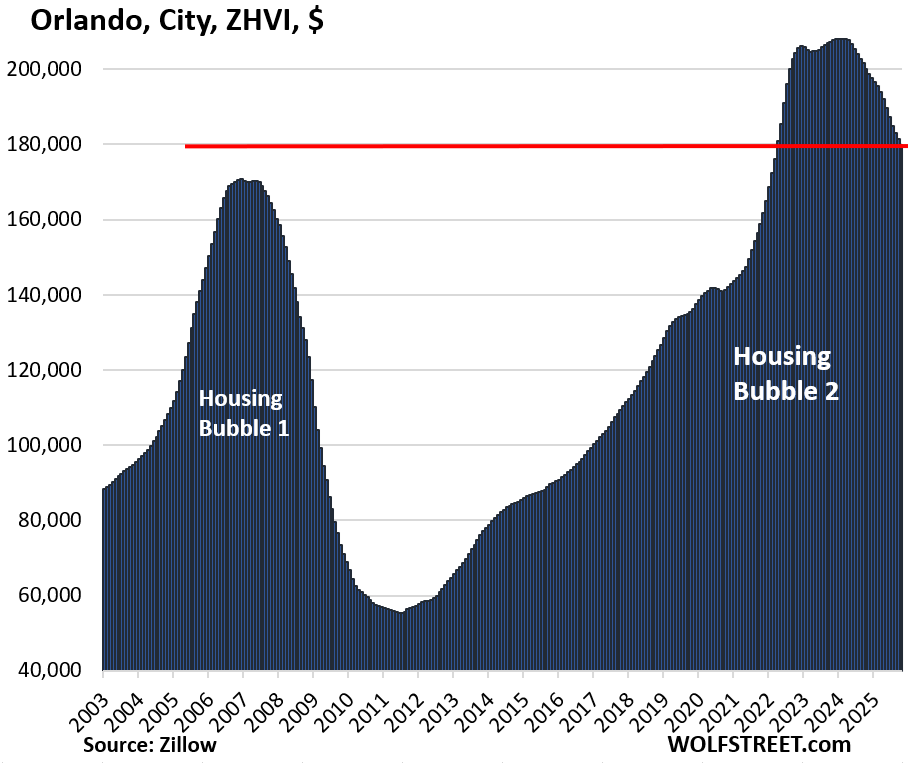
- Orlando, FL: -14% (2024)
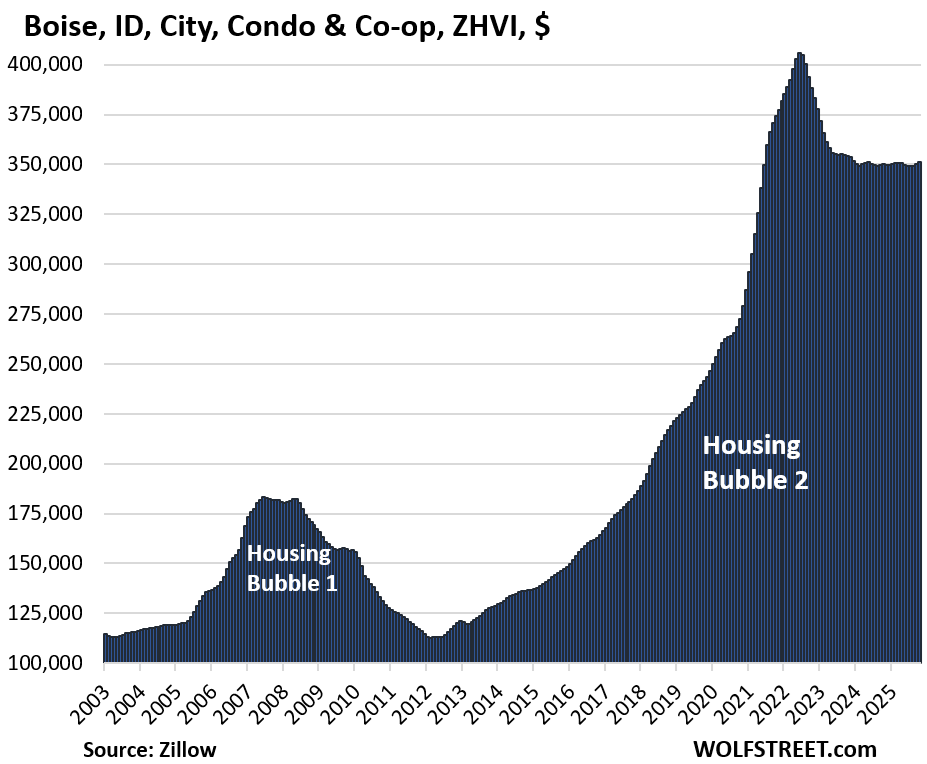
- Boise, ID: -13% (2022)
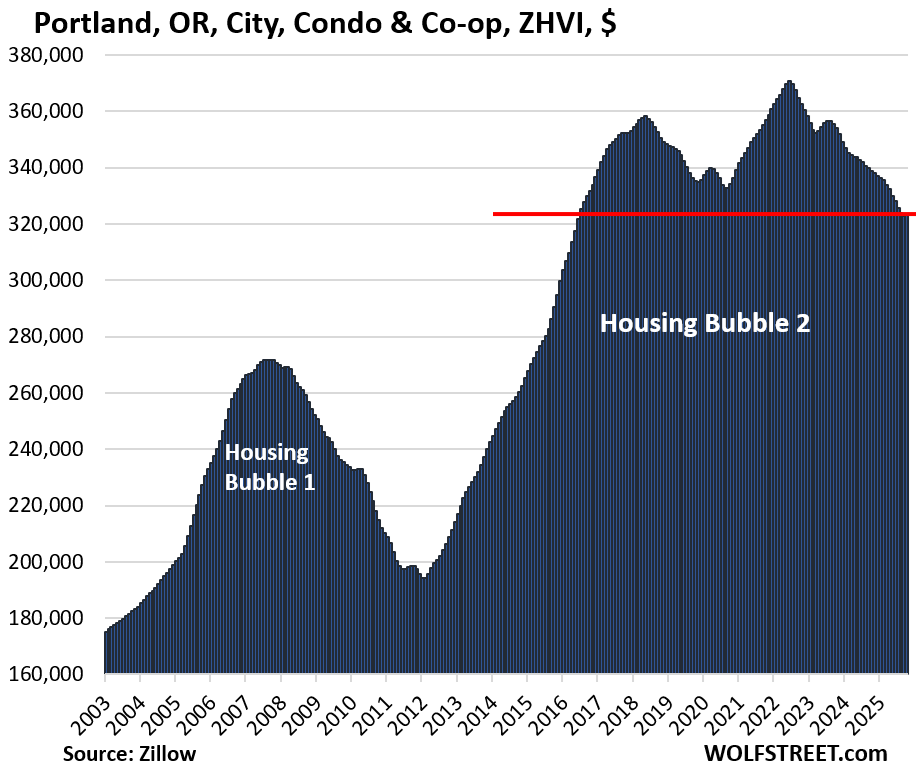
- Portland, OR: -13% (2022)
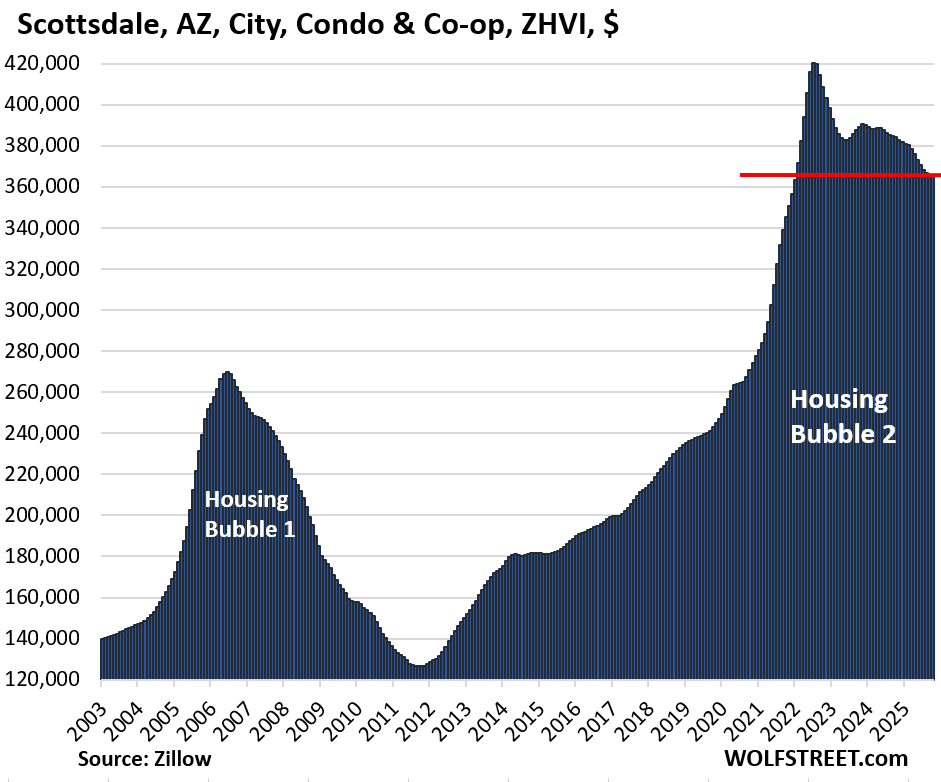
- Scottsdale, AZ: -13% (2022)
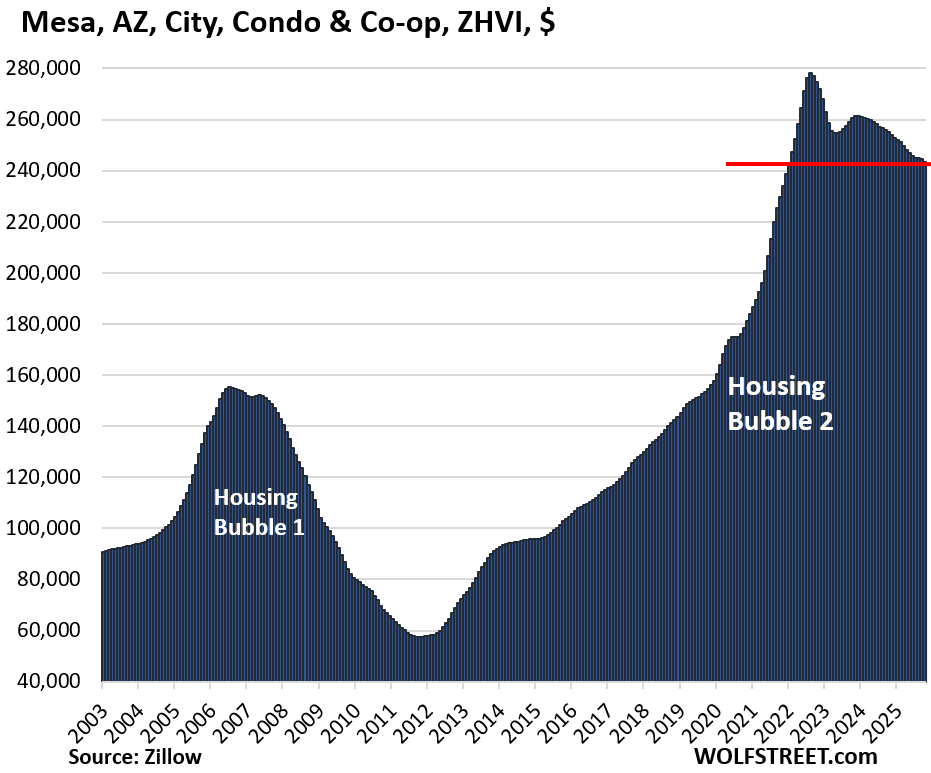
- Mesa, AZ: -13% (2022)
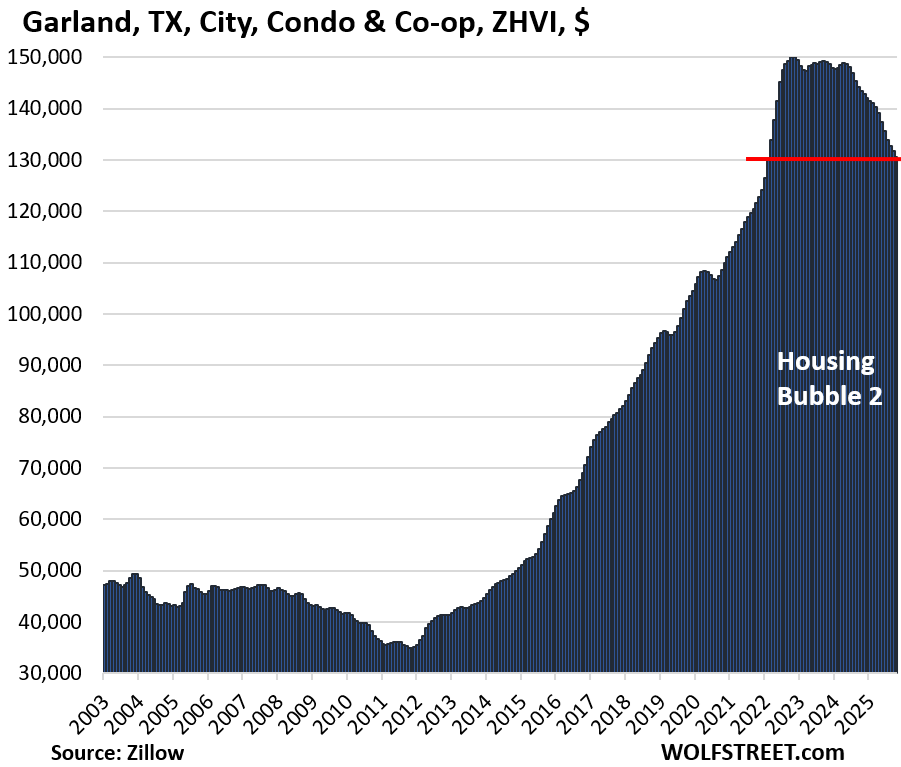
- Garland, TX: -13% (2022)
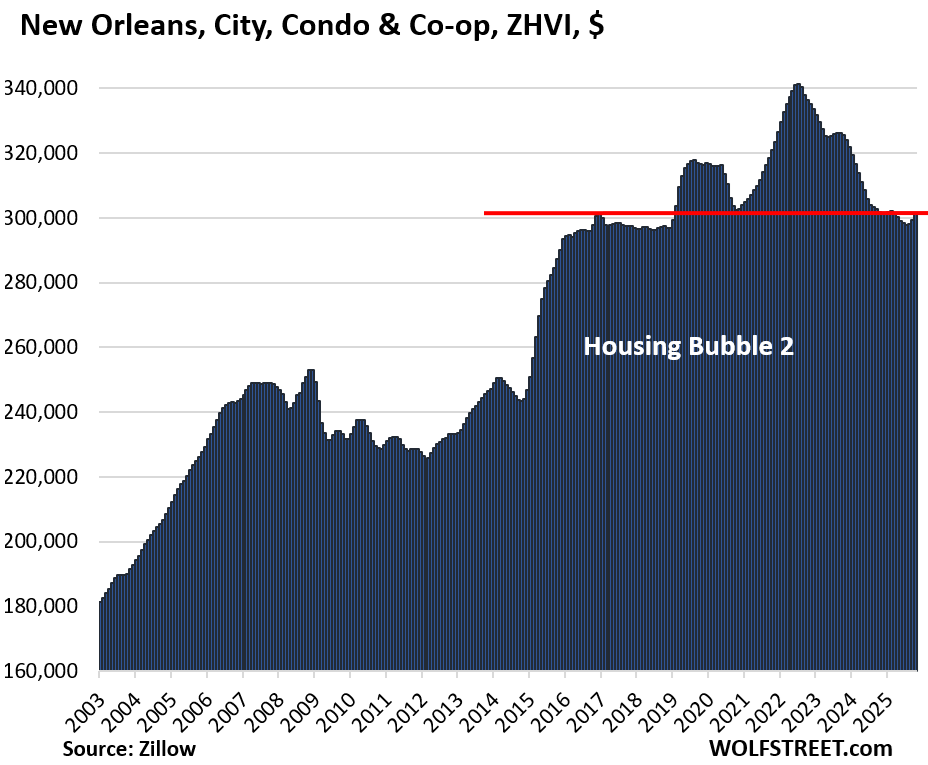
- New Orleans, LA: -12% (2022)
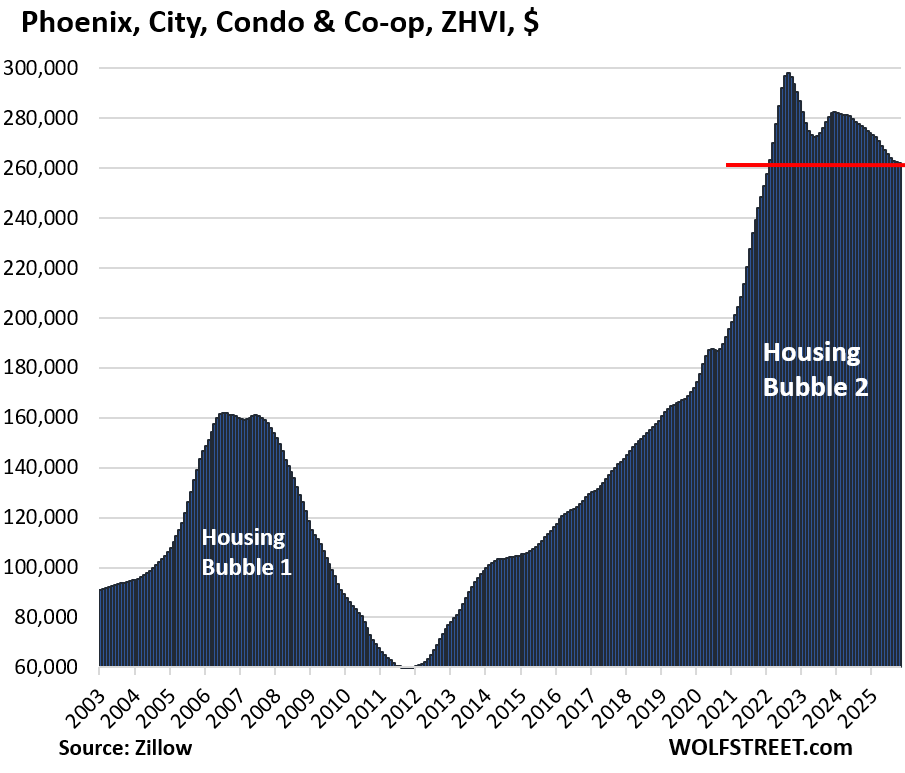
- Phoenix, AZ: -12% (2024)
- Chandler, AZ: -12% (2022)
- Port Saint Lucie, FL: -12% (2024)
- Fremont, CA: -12% (2022)
Cities that are too small to be included:
Florida has some cities that are well-known, high-priced, and are centers of big urban areas; but by population of the city itself, they’re too small to be included with the bigger cities. So they’re on the too-small list of cities with big drops of condo prices.
For example, prices from the peak in prior years:
- Killeen, TX: -44%
- Fort Myers, FL: -23%
- Lake Worth Beach, FL: -23%
- Sarasota, FL: -21%
- Bradenton, FL: -21%
- Naples, FL: -16%
- West Palm Beach, FL: -16%
- Boca Raton, FL: -14%
- Kissimmee, FL: -14%
- Clarksville, TN: -14%
- Lakeland, FL: -13%
- Hayward, CA: -12%
Cities that didn’t make the -12% cut-off:
There are many bigger cities where mid-tier condo prices have declined from their respective peaks in 2022, 2023, or 2024, but not enough to make the -12% cut-off. Here are some salient examples (year of peak):
- New York City, NY: -11% (2022)
- San Antonio, TX: -11% (2024)
- Plano, TX: -11% (2022)
- Corpus Christi, TX: -11% (2023)
- Glendale, AZ: -11% (2022)
- Raleigh, NC: -11% (2022)
- Houston, TX: -10% (2024)
- Colorado Springs, CO -10% (2024)
- Sacramento, CA: -10% (2024)
- Stockton, CA: -10% (2022)
- Salt Lake City, UT: -9% (2022)
- Dallas, TX: -9% (2023)
- Henderson, NV: -9% (2022)
- Spokane, WA: -9% (2022)
- Washington, DC: -8% (2022)
- Atlanta, GA: -8% (2023)
- Las Vegas, NV: -8% (2022)
- San Diego, CA: -7% (2023)
- Memphis, TN: -7% (2024)
- Fort Worth, TX: -7% (2024)
- Nashville, TN: -7% (2022)
- Oklahoma City, OK: -7% (2023)
- Gilbert, AZ: -7% (2022)
- San Jose, CA: -6% (2022)
- Miami, FL: -6% (2023)
- Los Angeles, CA: -6% (2022)
- Honolulu, HI: -6% (2022)
- Long Beach, CA: -6% (2023)
- Vancouver, WA: -6% (2022)
- Madison, WI: -6% (2024)
Year-over-year price declines of the 24 bigger cities.
Prices of mid-tier condos declined year-over-year in 23 of the 24 cities here in October (exception: Boise +0.3%). These are the cities with the biggest year-over-year declines in October:
- St. Petersburg: -16.1%
- Cape Coral, FL: -16.4%
- Arlington, TX: -14.4%
- Oakland, CA: -13.0%
- Jacksonville, FL: -10.9%
- Tampa, FL: -10.3%
- Orlando, FL: -10.2%
- Port Saint Lucie, FL: -9.1%
- Garland, TX: -9.0%
- Aurora, CO: -8.3%
- Denver, FL: -7.3%
- Freemont, CA: -6.4%
- Phoenix, AZ: -5.2%
- Seattle, WA: -5.1%
Condo prices in many of these cities had exploded from early 2020 through mid-2022 by 50%, 60%, 70% or more, amidst mindboggling buying behavior and investor-mania, fueled by Free Money.
In the 10 years to the peak, prices had soared by 180% (Oakland), 200% (Jacksonville, Tampa), 260% (Arlington, TX), 300% (Detroit, Aurora, Chandler), and 350% (Phoenix, Mesa). And by 500% in San Bernardino, CA, where prices have just started to decline and haven’t made any of the lists yet. Now these bubbles are deflating.
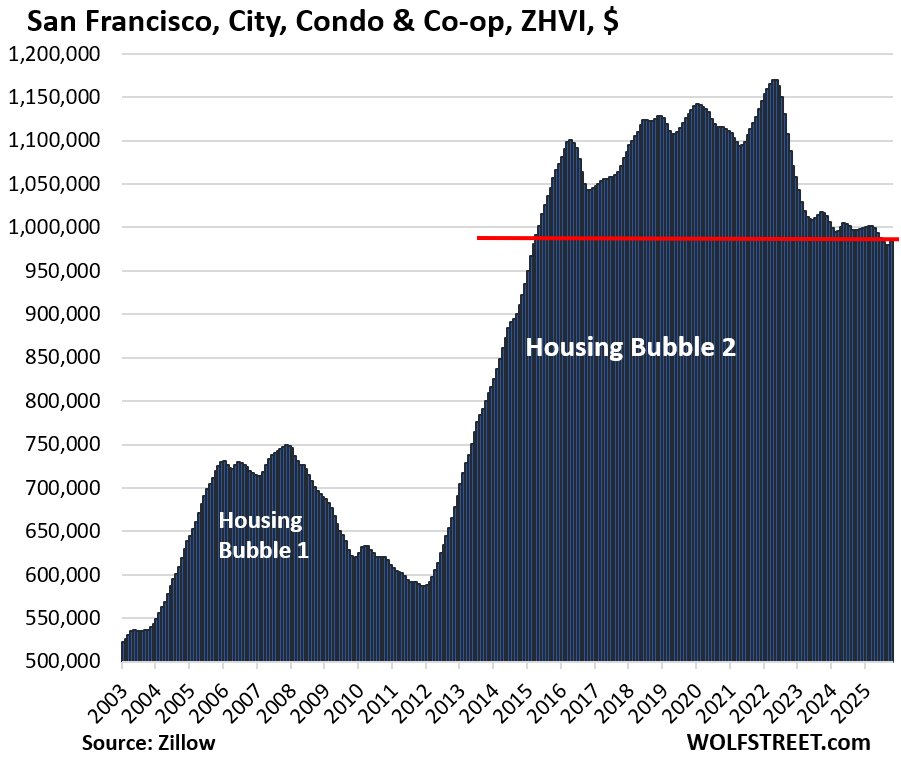
In some densely populated cities, such as San Francisco, condos make up a big part of home sales.
Methodology and data: These prices here are seasonally adjusted three-month averages of “mid-tier” condos and co-ops in “cities” (not in Metropolitan Statistical Areas) from the Zillow Home Value Index (ZHVI), which is based on millions of data points in Zillow’s “Database of All Homes,” including from public records (tax data), MLS, brokerages, local Realtor Associations, real-estate agents, and households across the US. It includes pricing data for off-market deals and for-sale-by-owner deals. These are not median prices.
The Condo Bust in charts:
In the little tables for each city below, the metrics from left to right: price decline from the peak, change from prior month (MoM), change year-over-year (YoY), and remaining increase since January 2000.
| Oakland, CA, City, Condo Home Prices | |||
| From May 2022 peak | MoM | YoY | Since 2000 |
| -29% | -1.0% | -13.0% | 150% |
Lowest since October 2015, nearly 10 years ago, and below the peak of Housing Bubble 1 in mid-2006, nearly 20 years ago!
| Cape Coral, FL, City, Condo Prices | |||
| From July 2022 peak | MoM | YoY | Since 2000 |
| -29% | -1.7% | -16.4% | 140.9% |
Back to October 2005, 20 years ago, well below the peak of Housing Bubble 1 in mid-2006. Free-fall comes to mind.
| St. Petersburg, Fl, City, Condo Prices | |||
| From Oct 2022 peak | MoM | YoY | Since 2000 |
| -26% | -1.4% | -16% | 190% |
Lowest since July 2021. These are massive month-to-month declines.
| Austin, TX, City, Condo Prices | |||
| From Jul 2022 peak | MoM | YoY | Since 2000 |
| -25% | -0.2% | -5.9% | 113% |
Lowest since April 2021.
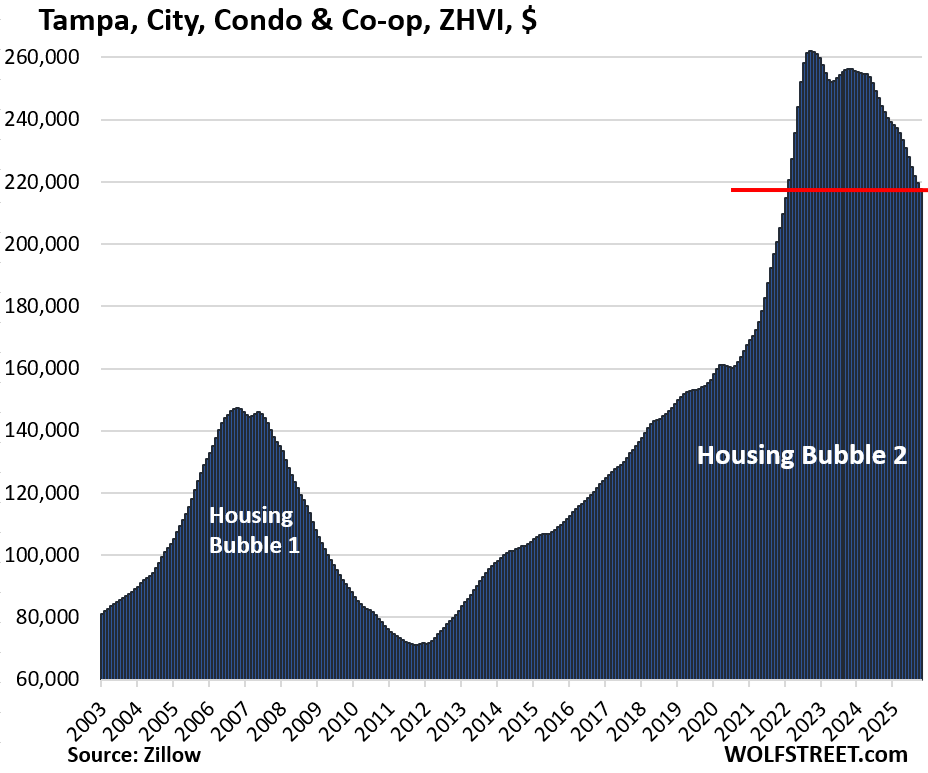
| Tampa, FL, City, Condo Prices | |||
| From Sep 2022 peak | MoM | YoY | Since 2000 |
| -17% | -0.9% | -10.3% | 263% |
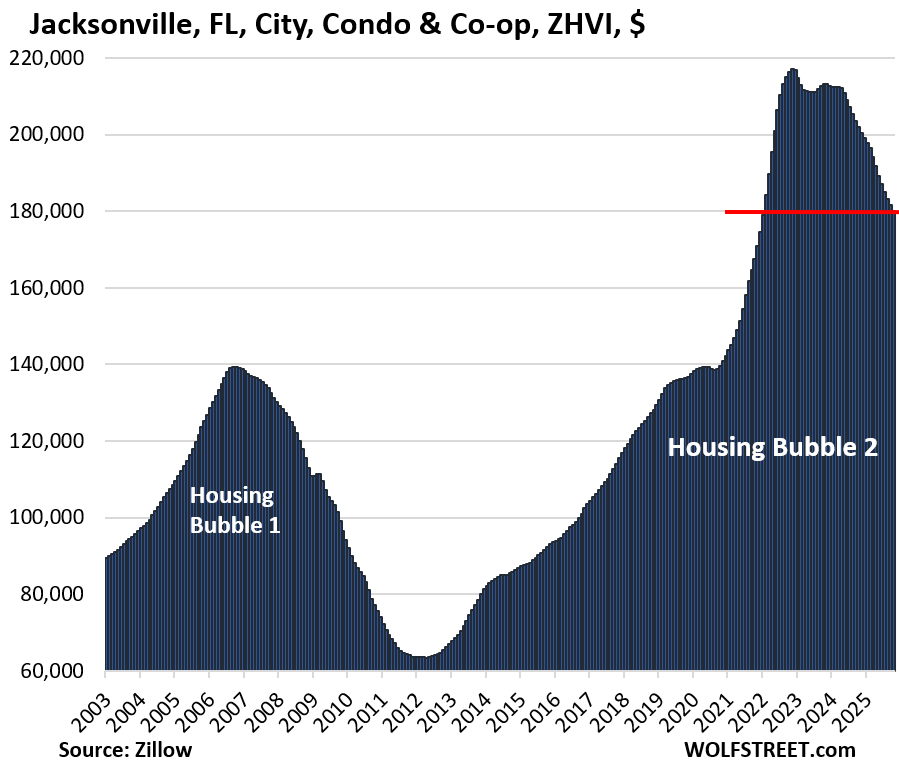
| Jacksonville, FL, City, Condo Prices | |||
| From Nov 2022 peak | MoM | YoY | Since 2000 |
| -17% | -0.8% | -10.9% | 151% |
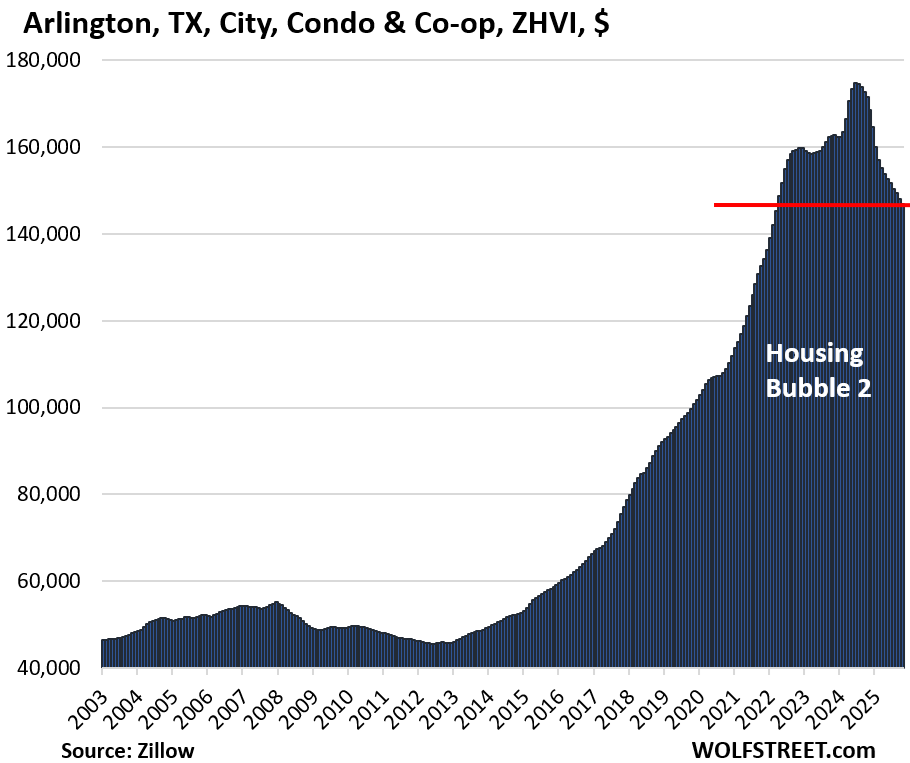
| Arlington, TX, City, Condo Prices | |||
| From Jun 2024 peak | MoM | YoY | Since 2000 |
| -16% | -0.9% | -14.4% | 233% |
Back to March 2022.
| San Francisco, CA, City, Condo Prices | |||
| From May 2022 peak | MoM | YoY | Since 2000 |
| -16% | 0.5% | -1.2% | 141% |
Back to mid-2015.
| Detroit, MI, City, Condo Prices | |||
| From Sep 2021 peak | MoM | YoY | Since 2000 |
| -15% | -0.9% | -3.8% | 261% |
Lowest since September 2018.
| Denver, CO, City, Condo Prices | |||
| From Jul 2022 peak | MoM | YoY | Since 2000 |
| -15% | -0.1% | -7.3% | 137% |
| Reno, NV, City, Condo Prices | |||
| From Jun 2022 peak | MoM | YoY | Since 2000 |
| -14% | -0.5% | -3.8% | 244% |

| Seattle, WA, City, Condo Prices | |||
| From Jun 2022 peak | MoM | YoY | Since 2000 |
| -14% | 0.1% | -5.1% | 136% |
Back to September 2017.
| Aurora, CO, City, Condo Prices | |||
| From Jul 2022 peak | MoM | YoY | Since 2000 |
| -14% | -0.5% | -8% | 204% |
| Orlando, FL, City, Condo Prices | |||
| From Jan 2024 peak | MoM | YoY | Since 2000 |
| -14% | -0.9% | -10.2% | 158.3% |
| Mesa, AZ, City, Condo Prices | |||
| From Aug 2022 peak | MoM | YoY | Since 2000 |
| -13% | -0.5% | -4.6% | 207% |
| Garland, TX, City, Condo Prices | |||
| From July 2022 peak | MoM | YoY | Since 2000 |
| -13% | -0.1% | -4.8% | 196.2% |
| Boise, ID, City, Condo Prices | |||
| From Jun 2022 peak | MoM | YoY | Since 2001 |
| -13% | 0.3% | 0% | 221% |
| Portland, OR, City, Condo Prices | |||
| From Jun 2022 peak | MoM | YoY | Since 2000 |
| -13% | 0.0% | -4.7% | 110% |
Back to mid-2016.
| Scottsdale, AZ, City, Condo Prices | |||
| From Jul 2022 peak | MoM | YoY | Since 2000 |
| -13% | -0.1% | -4.8% | 196.2% |
| Port Saint Lucie, FL, City, Condo Prices | |||
| From July 2022 peak | MoM | YoY | Since 2000 |
| -13% | -1.0% | -9.1% | 239.2% |

| Phoenix, AZ, City, Condo Prices | |||
| From Aug 2022 peak | MoM | YoY | Since 2000 |
| -12% | -0.2% | -5.2% | 236% |
| New Orleans, LA, City, Condo Prices | |||
| From Jun 2022 peak | MoM | YoY | Since 2000 |
| -12% | 0.6% | -0.2% | 102% |
Back to December 2016.
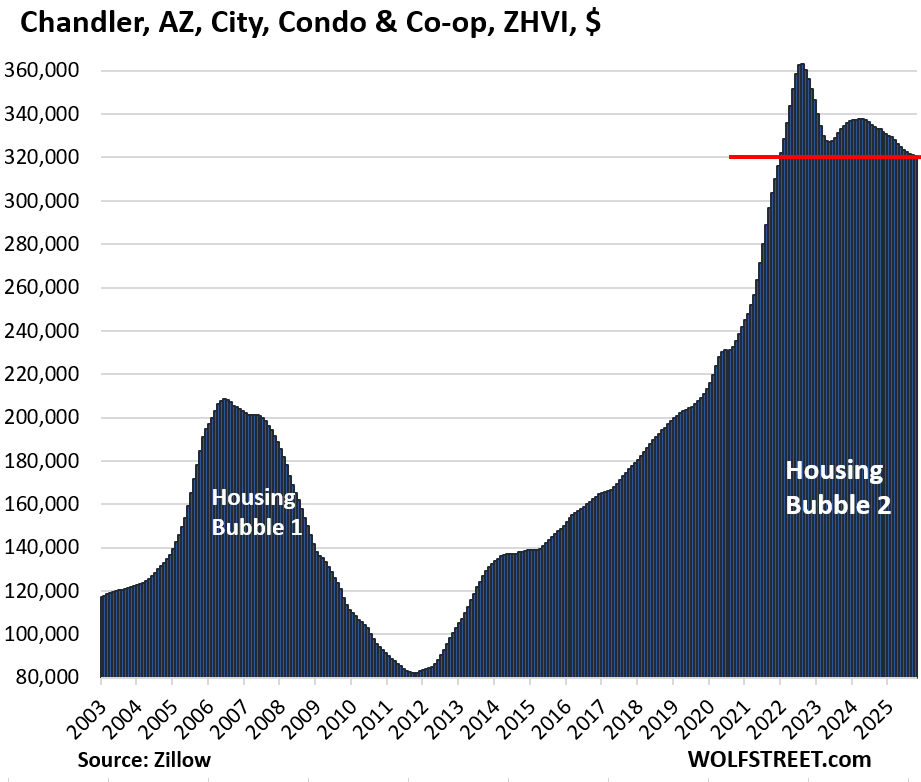
| Chandler, AZ, City, Condo Prices | |||
| From Aug 2022 peak | MoM | YoY | Since 2000 |
| -12% | -0.2% | -3.6% | 214.2% |
| Fremont, CA, City, Condo Prices | |||
| From May 2022 peak | MoM | YoY | Since 2000 |
| -12% | -0.3% | -6.4% | 208.5% |
Back to mid-2018. Tesla’s first manufacturing plant is located in Fremont.

Condos face some special issues:
- In real estate, and over the long term, the land appreciates, while most buildings depreciate to zero and are eventually torn down. The land some big condo buildings sit on can be very valuable, but each condo owner only owns a tiny slice of it. The rest of their investment is in the building. A single-family house may sit on less valuable land, but the homeowner owns 100% of it and benefits fully from any appreciation of the land.
- Prices that exploded over the past few years, driven by FOMO-addled buyers, including investors, and ended up being way too high.
- Hefty special assessments for long-neglected big repairs.
- Big increases in HOA fees at many properties, in part driven by spiking insurance costs.
- Fannie Mae’s ever-expanding Blacklist of condo buildings that makes financing a unit in one of those buildings very difficult, and sales may be limited to cash buyers.
- The end of Free Money: Mortgage rates are roughly back to a normal range.
- Foreign-based owners who’ve had it and want to sell.
- Investors in condos to rent them out are facing stiff competition from a wave of new higher-end apartment buildings that developers are trying to find tenants for.
And in case you missed it: Here Come the HELOCs: Mortgages, Housing-Debt-to-Income-Ratio, Serious Delinquencies, and Foreclosures in Q3 2025
Enjoy reading WOLF STREET and want to support it? You can donate. I appreciate it immensely. Click on the mug to find out how:

![]()
Why would anyone want to buy condo? No backyard or privacy. Ridiculous HOA rules, fees, and special assessments. It’s like renting an apartment where you’re responsible for all of the maintenance and repairs.
“Why would anyone want to buy condo? No backyard or privacy.”
There are people who don’t want a yard. They want to live above the ground so not every yokel can just climb through a window. They want to have views other than a back yard, the neighbor’s house, and the street. They like having people around (humans are social creatures). Condos are built where houses are not built. There are few single-family houses in Manhattan, for example. Nice condos there cost tens of millions of dollars. If you want to own in a central location in a big city, walk to work, walk to go out to dinner, walk to the gym, walk to the store, etc., you might want to own a condo. It’s not for everyone, nor are houses in the suburbs or small towns.
In terms of renting: there are millions of single-family houses for rent. Renting is always a choice, and maybe a good choice now, whether single-family house or in a multifamily building…
2. “It’s like renting an apartment where you’re responsible for all of the maintenance and repairs.”
You’re only responsible for the repairs inside your walls. Everything else is taken care of by the HOA and paid for via HOA fees. If it’s a huge project, it’ll require a special assessment.
In your house, you get to replace the roof and the HVAC unit. Then you’ll need a new water heater. Then your sewer line breaks. Then the foundation cracks… The never-ending joys of maintaining a house, especially an older house.
Wolf well phased . Having lived in 7 countries and 6 cities in USA I have experienced both .
CPH DK condo was my favorite experience of all. City center living friends with shop owners walking city very healthy and each day walk to work was a cruise ship excursion that probably cost 200.
I just finished repairs on my home in Tyler Tx
Roof replacement (25 yr old) 40k
Pool plaster tile coping (20 yr old) 40k
HVAC 4 ton 20 seer 9k
And added a discretionary standby gen set
More repairs are needed especially outside landscaping and lighting
If I did not do work myself small yard and pool maintenance runs 800 usd a month .
Condo living for me if I had my choice !!
I love the views as well.
Rooftop in CPH dk check them out from city center
A skyline view pic link from Wolf restaurant would be nice to see .
Copenhagen?
Haha…
I think ya’ll just jinxed me with all this homeowner maintence/repair cost talk. My A/C just stopped being A/C, which is not as much of a worry for me, but the Mrs. Says it is 90 degrees….
Haha….
Fingers crossed, wish me luck.
Think small.
“In your house, you get to replace the roof and the HVAC unit. Then you’ll need a new water heater. Then your sewer line breaks. Then the foundation cracks… The never-ending joys of maintaining a house, especially an older house.”
Oh yeah, last month I paid $9,000 to have my sewer line pressure-cleaned and have a sleeve-lining from my 105 year old house to the city main line installed. That is something my neighbors to the south have done recently, too. In September, a few house to the north, their sewer line did break; $12k to replace.
There’s no question that an older house has maintenance costs and surprises.
But the privacy, control and freedom that a SFH offers is such a quality of life issue for me, Wolf. For example: the yard with the apple trees I planted in the front; the raspberry forest in the back; and the two gardens for fresh food every day in the summer and fall.
Plus, one thing that’s not conducive to a condo: listening to music at a mid-80’s dB level late into the evening. When the Minnesota Orchestra was broadcast live on Public Television this past Friday, the concert finished at 10:00 pm. Having my own home and space allowed me to enjoy it at just a few dB below what would be the live sound level front-and-center at Orchestra Hall. Neighbors in a condo would not approve, I reckon.
Maybe there will be a day down the road when I’ll need to move out of the little house I’ve owned and loved for 30 years and go into a condo??? However, the plan is to stay two more decades at a minimum. I figure half a century is about right for me to be in my house.
Cheers.
P.S. There’s no HOA membership needed here in South Minneapolis!
“allowed me to enjoy it at just a few dB below what would be the live sound level front-and-center at Orchestra Hall.”
Epic!
I listen to me Tull/Zep ect.(albums of course)@ 11 thru me Klipcsh Speakers.
I can guarantee no one wants to hear me horrible guitar playing thru a Marshall Stack(tube…..,of course!),the upside of living far apart.
Buy a new house. Warranty for 1+ yrs and no renovations for 20+ yrs.
I too own a SFH so I can play loud music without getting a noise complaint. The setup needs to be in a basement because the bass easily travels through walls.
I can see condos for some people,having half owned one in Co. NEVER AGAIN.To those that do want a hands free maintenance lifestyle is a good option.
I am lucky in that I have the skills to do most home repairs and do not want to see neighbors,want a lot of land for shop/critters/small gardens ect.
Oh,as for folks coming thru me windows,well…..,that is were the Sheppards come into play until I with 1911 deal with the issue,that though possible is much rarer in rural areas,and,would be glad for it never to happen.
I have also found that folks in rural areas though separated by land do seem to have more “community’,just my experience.
Yokel – hahaha – I had to look that one up. Does San Francisco have yokels? Yokel-Ville?
I guess you can’t have yokels climbing in your window if you live on the 10th floor
What would these charts look like if HOA fees were included? It seems HOA fees have increased dramatically in the last couple years
HOA fees are a monthly expense, not a price level.
They’re like homeowner’s insurance and maintenance costs for owners of single-family homes.
I can bet a million dollar every time there’s an article on condo for someone who has never owned one to complain first. There are horror stories for SFH, everyone either has one or knows someone with it, but it doesn’t make the news or a meme.
Wolf has already nailed it. But let me add more color.
For the cost of an average SFH in my city you can live in an amazing condo in the downtown area. I can’t say what’s the situation in all urban cities, but condos have crashed in value since the pandemic in our city and SFH prices are out the wazoo. I could have never imagined the standard of living I’ve now, but thanks to herd of investors abandoning condos, I’m able to afford something I only dreamed about.
Condos are amazing when you value your time. When the investment is in your time back to yourself to do things that no SFH appreciation can provide. I’ve not commuted in years. I’ve not lost a package in years. I’ve never had to give up on working out for any reason within my control. I’ve green spaces on our rooftop. We BBQ all summer long – never have to maintain a grill, we clean-up after ourselves and that is it. We have hosted weddings, baby showers, birthdays, anniversaries etc. for our friends and family in the common spaces in our building.
I see miles long backups on freeway everyday from my window. I know there are some people who could enjoy a better standard of living close to work, but they have been brain washed into thinking they need a 4000 sq ft SFH.
It’s not all peachy, being in a condo downtown, but I’m sure someone else will be very eager to write all that for me.
Just some general notes/observations on the absurd volatility of housing prices over the years,
1) It is hard to believe that the US housing market used to be (pre-2000, pre-ZIRP) this absurdly volatile in terms of pricing,
1)a) I don’t know how hard the data would be to get, but the 20-25 years *before* the start of the charts might be very interesting
2) Housing prices are a *multiple* of post-tax household incomes, so the volatility is *killing* – thus American unrest. The US housing market has been turned into an interest rate casino.
3) This killing volatility is almost certainly related directly to the unprecedented ZIRP policies post-2000,
4) Because new home builders and existing home buyers/speculators used ultra low cost financing to fuel their investments/speculations/changes in mix of homes.
5) Similar volatility has likely been seen in the bond index markets for essentially the same reason – base interest rate volatility drives bond price volatility mathematically and historically low (ZIRP) interest rates drove historically high speculation/price volatility.
Lotta truth to that.
Value of the dollar has something to do with it (as has demand). Only a single datapoint from a Federal gov’t employee saturated area – my parents purchased a new home in Bethesda, MD in 1964 for $45K. It was sold in 2001 for $600,000+ (can’t remember exact amount).
Another note on the rapid rise of HOA fees (in terms of both amount and commonality),
The US Census very recently said that about 25% of US homeowners (22 million out of 88 million) paid either an HOA or condo fee – in addition to their mortgages.
The median fee in the US as a whole was $135 per month but the dispersion across states was incredibly wide ($47 in Arkansas, $739 in NY)
https://www.census.gov/library/stories/2025/09/condo-hoa-fees.html
HOA fees include homeowner’s insurance, some utilities (usually water and trash), repair and maintenance costs of the commons, upkeep of the grounds, the pool, the gym, etc. When you own a house, you pay homeowner’s insurance, water, and trash, and you have to do yardwork or pay someone else to do it, and you’ll eventually have to pay for a new roof, a water heater, sewer line problems, foundation problems, painting the exterior, etc. So ask homeowners how much they pay for these items, including homeowner’s insurance. The difference is that they pay most of them in big lumpsums, not in small monthly increments.
Another line item….I own a condo in Jax area of FL…..since the collapse of the apartment building in Miami a few years ago the state has increased HOA capital reserves requirements substantially, annual state reviews of HOA balance sheets have increased, state approval now needed for new home and condo development as well as some upgrade projects.
My combined (building, complex/community) HOA rates have moved from $600 in 2020 to $1086 this year.
By state approval I mean some inspector has to show up and approve every major line item (wiring, driveways, power, etc.). It can take mos for the state to respond to requests for certification – raising costs further. Along with that, the turn-over (and reliability) of small businesses that do all the work building a home is eye opening. I have a friend who is into year 3 building a million dollar plus home in Ormand Beach, FL. Supply chain issues, state approvals, capital availability for developers, small businesses whose attention-to-detail and reliability isn’t all it could be be, and many other issues have made this a project from hades.
ouch!
Residential real estate will never go down !!
Because….reasons !!
Back to the old saying…….
Something is only worth as much as someone is willing to pay.
Looks like people are figuring out how much they are willing to pay.
Or not pay.
People are willing to pay good money for Fart Coins, and they don’t even have real smell.
I don’t think they even have digital representation of a smell. But some people, for whatever reason, smell a certain price per Fart.
the world is a big place. human primates seem to like varied living. some deep in forests, or on top of mountains, or on the seashore. some like the manicured suburbs. some like city life. the idiots out there think their preference is the only way. i’ve lived in many different places including all, i listed. enjoyed them all. look up the root meaning of the word idiot, idiotes.
The reality is that the big boom is over in real estate. Was looking at a older house, and the math was totally rent vs buy. By 25%. So, one has to wonder who is going to buy all the inventory coming? Condos are just leading the way to the future, plus special problems in tourism destinations. Sing a few lines of Oh Canada for Scottsdale and Florida.
Just the fact that housing bubbles need to be numbered relieves me of the burden of being optimistic about our civilization.
I was just seeing a GDP chart yesterday, showing that GDP has risen from $21.4T in 2019 to $30.5T in 2025, despite the short pandemic recession. Thats roughly a 7% average increase in GDP each year, most of which is inflation.
If your income/wealth did not increase by 7% per year, your piece of the economic pie shrank. Both condo and home owners probably did OK in this environment.
7:35 AM 11/20/2025
Dow 46,794.32 +655.55 1.42%
S&P 500 6,760.95 +118.79 1.79%
Nasdaq 23,102.38 +538.15 2.38%
VIX 19.71 -3.95 -16.69%
Gold 4,090.70 +7.90 0.19%
Oil 60.20 +0.76 1.28%
That didn’t last long…
Yep!!!
The fed minutes and a decent September payrolls number basically nuked any chance of a December rate cut. It was like 90% on a 25bps rate cut on kalshi. Now it is at 35% for a 25 bps cut.
VanEck Gold Miners ETF (GDX) $76.39 +0.76 +(1.00%) YTD 126.21%
Baby boomers are net sellers and gen z is sitting on the sidelines. The carry cost of carrying a condo is going up and prices are going down. Talking about carrying cost, did the yen just bottom? can we get back to de leveraging and selling equities? The yen weekly fall has been the liquidity to keep the sky falling. Atlas is getting tired!!! Really tired
No bottom in the Yen.
The USD:YEN pair has been climbing since the April Tariff Tantrum and moved through resistance with authority!
I see no reason why it wouldn’t revisit, and maybe move past the 160 handle? Of course, WITH extreme volatility.
Cryptocrap total cap is also deflating, but it may (or may not?) have some support. Although the BTC:USD pair may see $82k… “or below.”
The ICE BofA high yield spread has risen back above (a paltry) 3%, but has not remained above that for very long in recent years. If that changes: you Know that the smart money is repositioning.
I am amazed at how silent the real estate appraisal industry is on the issue of declining prices.
Things are worse than they might seem as many sales are being Propped Up by the Stilts of Concessisons.
Meaning once Concessions are taken out, prices are actually down another 5%-10%.
@ wolf, great stuff as usual. Any chance you could add a percent axis on y2 in future iterations. Perhaps you’ve already looked at this and it ruins the plot.
Some of these drops are entering truly eye-watering territory.
The percent drop from peak is in each of the little tables above each chart, left-most figure, along with the date of the peak. All you have to do is look at it.
Condos used to be without monthly fees back in the late 60’s,early 70’s.We bought a couple of them made decent money but then came in the monthly fees and we said no way get out sold them never looked back.
We bought US treasuries and CDs year after year and are now have over $3 million in IRAs,roth IRAs,CDs,treasuries and are quite happy now with ditching condos and renting a modest house.
Home builders are aggressively slashing prices on new homes— but buyers aren’t biting
America’s heartland is the epicenter of the housing-affordability crisis
Wall Street stunned as stocks suddenly drop like a stone and turn red despite string of good news
After spending the morning in the green – boosted by Walmart and Nvidia’s banner earnings and a surprisingly positive jobs report – the market dropped like a stone.
Seemed like market fully priced in a December rate cut
More likely in my opinion that the explosion of margin debt that Wolf has written about caused some forced selling. Who knows though?
I am firmly convinced that the Housing Bust # 2 is going on HERE and NOW. I have been perusing a real estate website – some areas are almost a bargain right now. Others are moving slower in their price declines, but make no mistake about it – the bust is HERE and it’s NOW.
And yes, it’s very nauseating to see a not-so-cheap condo (there are lots of them) with $600 per month HOA fees. That is insanity! If I wanted to get robbed, I’d go to Oakland or San Fran wearing shiny chains, and $100 bills hanging out of my pockets.
Maybe a bit off topic, but would a townhome lean more towards SFH or towards a condo?
Condo (“condominium”) is an ownership structure of apartments in a bigger building where the owner owns everything from the inside walls of this unit, and owns a proportionate share of the commons, which includes the building and land. When I owned my condo (1,800 sf), I owned my unit plus 1% of the commons (a tower with pool and garage, plus the land).
There are other ownership structures for apartments, such as a co-op (a corporation where owners own shares of the corporation) and tenancy-in-common (TIC) which is rare for residential buildings, but is common for some reason in San Francisco.
A townhome is a type of building where the side walls touch another building (“single-family attached”). It has nothing to do with ownership structure. Ownership structure is generally the same as a single-family detached home, where an owner owns the land (the lot) and the entire building. But ownership could also be structured as a condominium, in theory.
Hi Wolf – what is your take on San Diego? Prices have leveled off for the last year but prior to that I saw condos go up $100k/yr for 4 or 5 years. Is it a delayed bubble or is it protected by the ample supply of new comers wanting to live here?
It’s on the list of those that didn’t make the 112% cutoff.