Core goods prices rise as companies distribute the tariffs amongst each other.
By Wolf Richter for WOLF STREET.
The Producer Price Index does not track import prices. It tracks prices that companies charge each other; so it does not directly track the costs of tariffs that companies pay on imported goods. PPI indirectly tracks how companies shuffle the tariffs around amongst each other, as companies have had trouble passing them on to consumers, and consumer-facing companies have therefore resisted their suppliers’ efforts to pass on the tariffs to them. And we can see some of that percolating through the PPI segments.
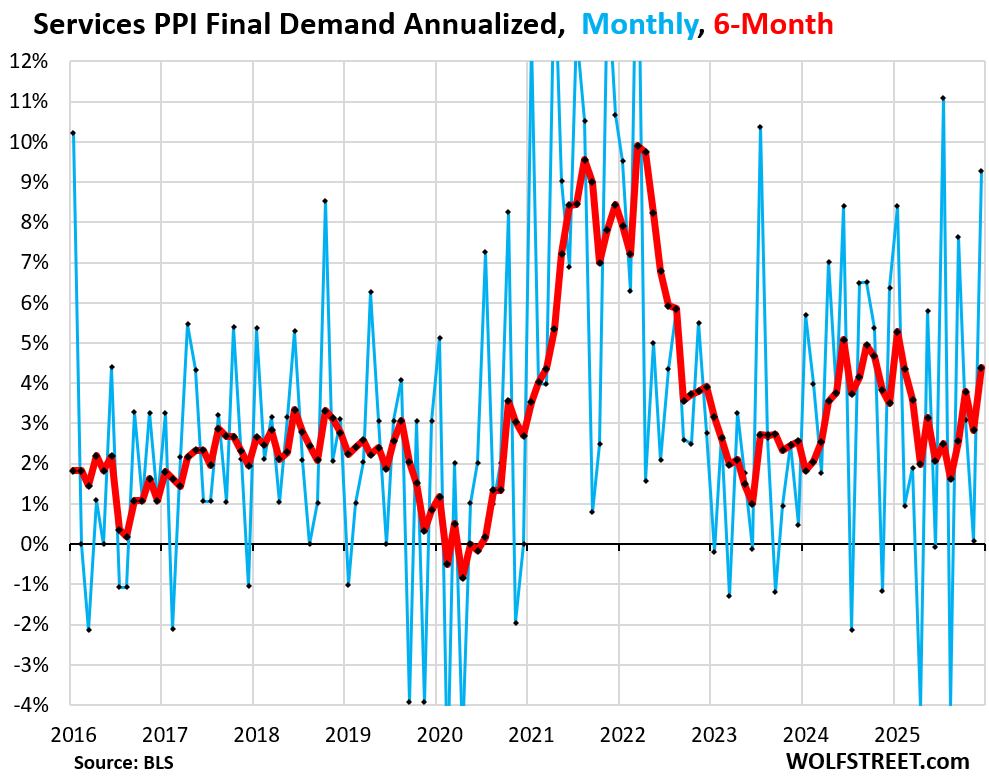
But the services PPI spiked, and services are not tariffed, and they dominate the US economy. The services PPI weighs 68% of the overall PPI. And this big increase is bad news for inflation.
The overall PPI Final Demand jumped in December by 0.49% from November (+6.0% annualized), seasonally adjusted, according to data from the Bureau of Labor Statistics today.
This was driven by a big spike in the services PPI of +0.74% month-to-month (+9.3% annualized).
The goods PPI was unchanged for the month, on big drops in food and energy prices. But beyond food and energy, there were some substantial increases, and the “core” goods PPI, which excludes food and energy, rose by 0.42% (+5.2% annualized).
The 6-month average of the overall PPI, which irons out some of the huge ups and downs and gives a better image of the trend, jumped by 4.2%, the second-highest since September 2022, behind only January 2025 (bold red line).
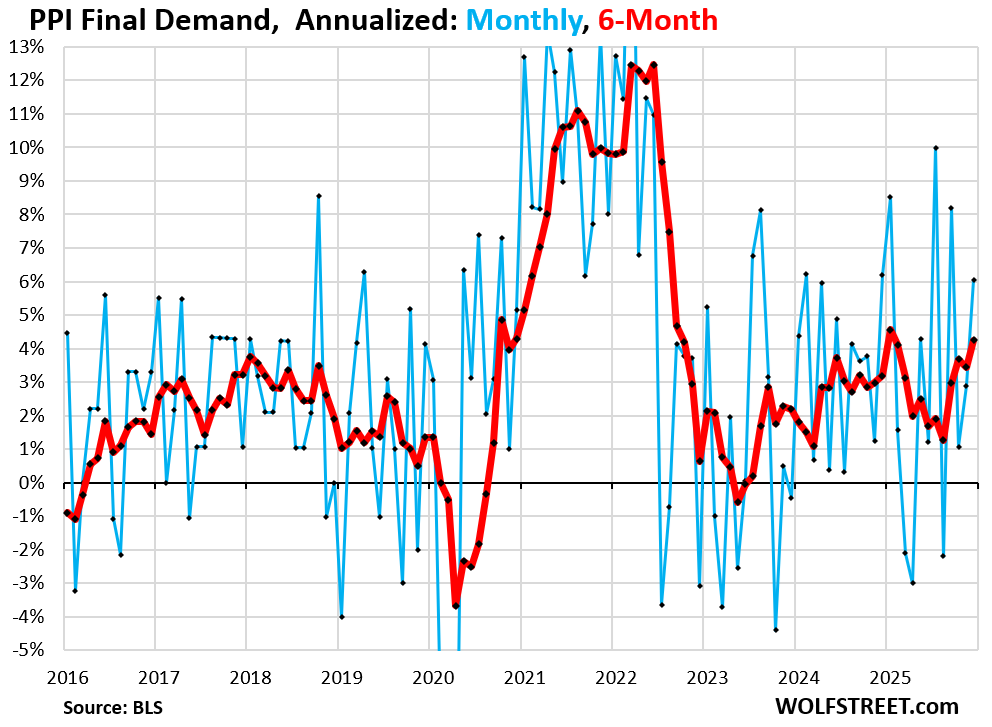
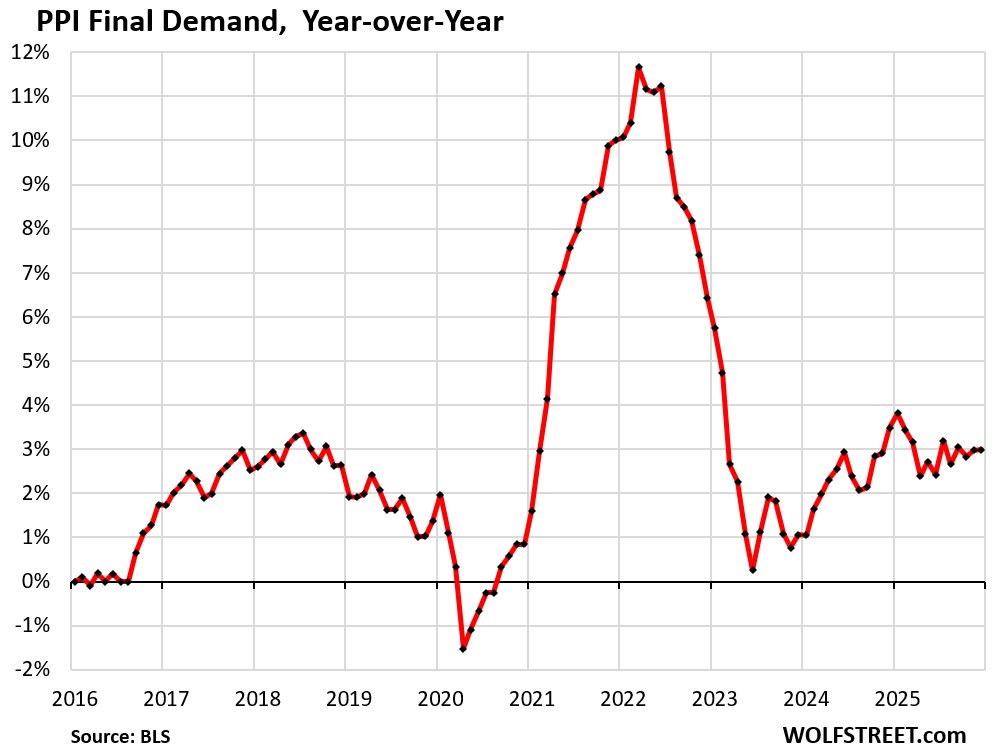
Year-over-year, the PPI Final Demand rose by 3.0%, same increase as the month before, and has been in this range since July.
The Services PPI spiked by 0.74% (+9.3% annualized) in December from November. The 6-month average rose by 4.4% annualized.
- Trade services PPI (19% of overall PPI): +1.7% month-to-month not annualized! Some highlights; not all services rose, some fell:
- Machinery & equipment parts & supplies wholesaling: +3.0%
- Machinery & vehicle wholesaling: +5.8%
- Professional & commercial equipment wholesaling: +3.7%
- Health, beauty & optical goods retailing: +4.2%
- But apparel wholesaling: -6.1%
- Chemicals & allied products wholesaling: -1.1%
- Fuels & lubricants retailing: -4.7%
- Transportation & warehousing services PPI (4.9% of overall PPI): +0.5%
- Finished services less trade, transportation & warehousing (38% of overall PPI): +0.3%
PPIs rose for guestroom rental; food & alcohol retailing; health, beauty, & optical goods retailing; portfolio management; and airline passenger services.
PPIs fell for bundled wired telecommunications access services, and for automotive fuels and lubricants services.
In terms of the Fed favored PCE Price Index: The PPI for Portfolio management feeds into the PCE Price Index, the inflation index that the Fed prefers. It jumped by 2.0% month to month in December, not annualized, after jumping 1.4% and 3.8% in the prior two months.
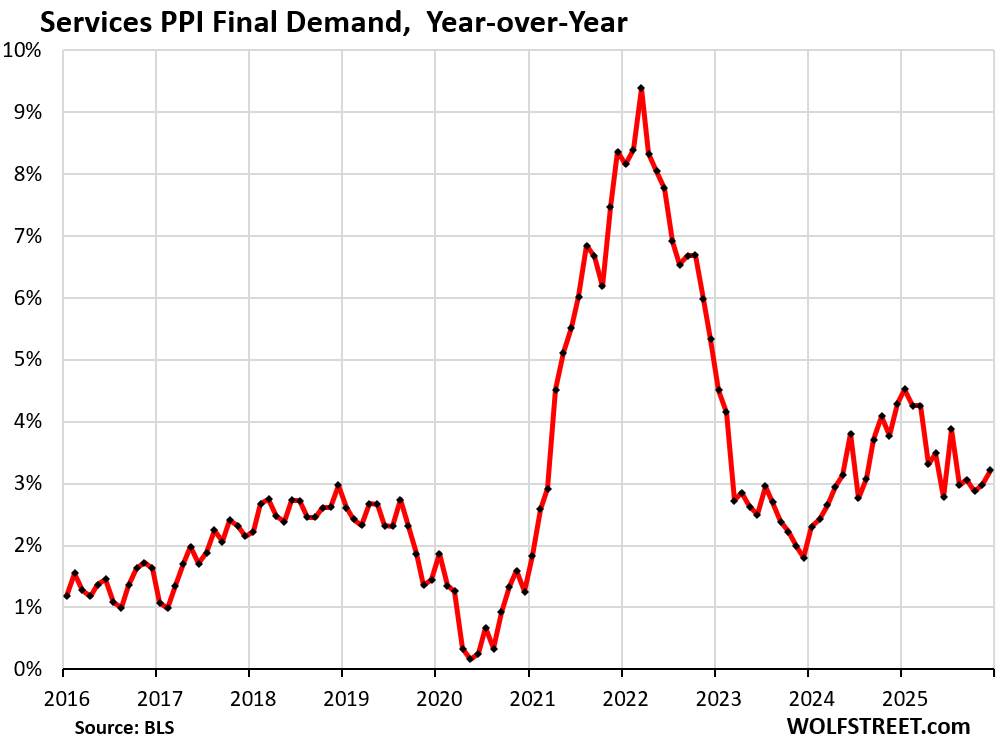
Year-over-year, the services PPI rose by 3.2%
Goods prices.
The PPIs for both food and energy fell month-to-month:
- PPI for Food: -0.3%;
- PPI for Energy: -1.4%.
These declines kept the PPI for overall goods unchanged. But goods prices without food and energy rose.
The Core Goods PPI (excludes food and energy) rose by 0.42% month-to-month (+5.2% annualized). The 6-month average rose by 4.2%.
The tariffs are percolating through the goods categories at various stages that the PPI tracks as companies try to pass them on to each other, while consumer-facing companies resist price increases because they’re having trouble passing them on to consumers without losing sales.
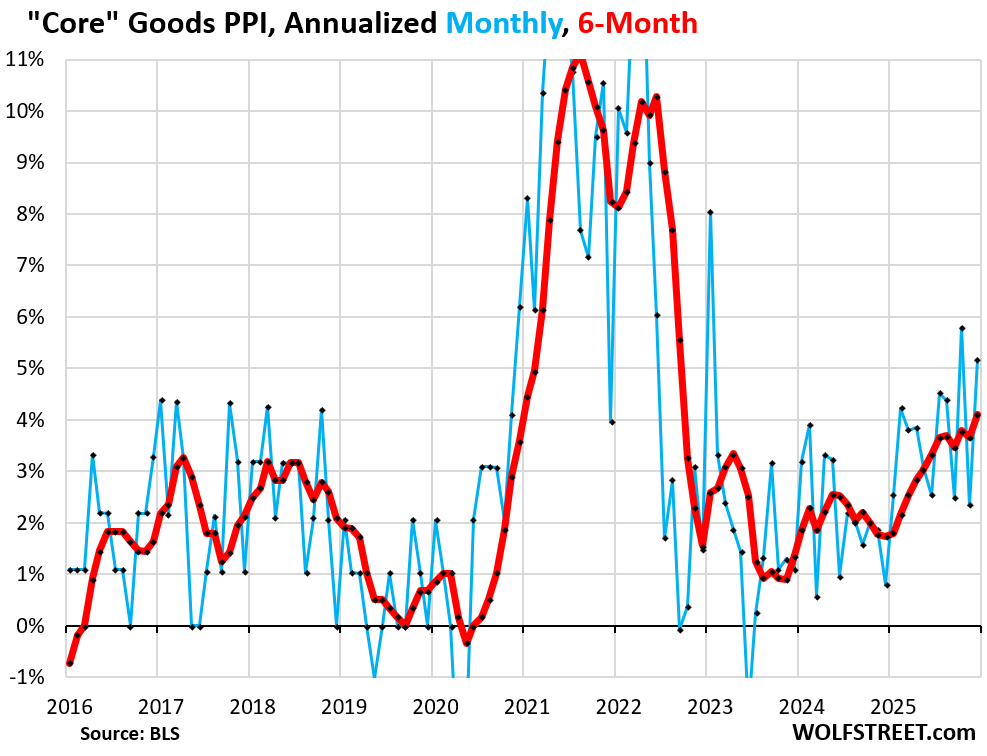
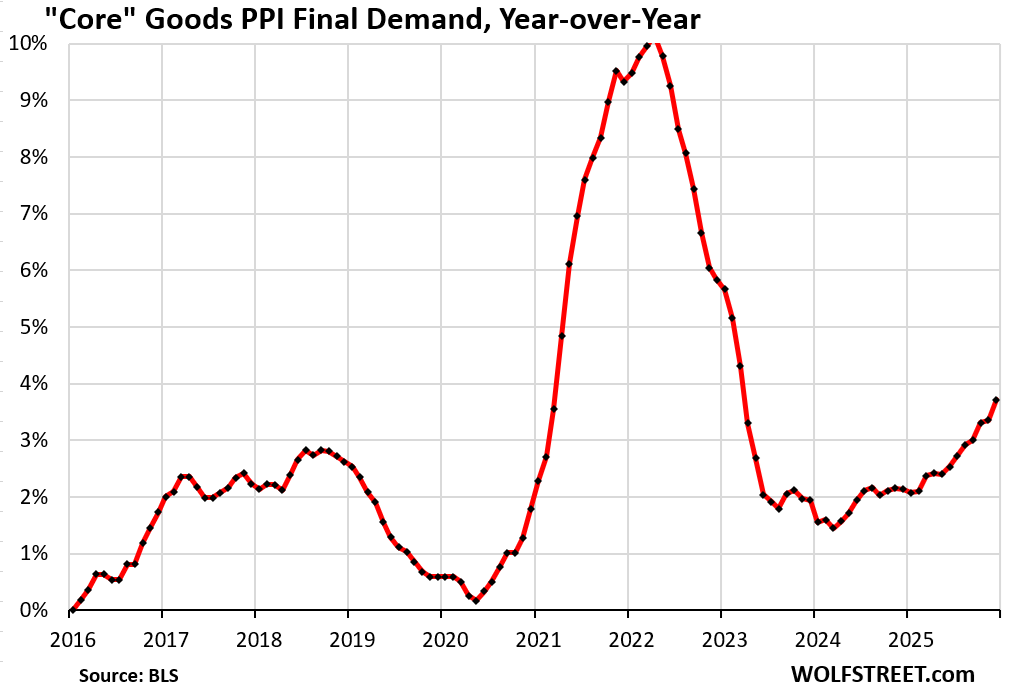
Year-over-year, the core goods PPI rose 3.7%, the worst since March 2023.
In summary, without food and energy:
“Core PPI Final Demand, which includes all goods and services except food and energy, and which is dominated by services, spiked by 0.66% month-to-month (+8.2% annualized).
This pushed up the 6-month average to +4.3%, the worst since January 2025.
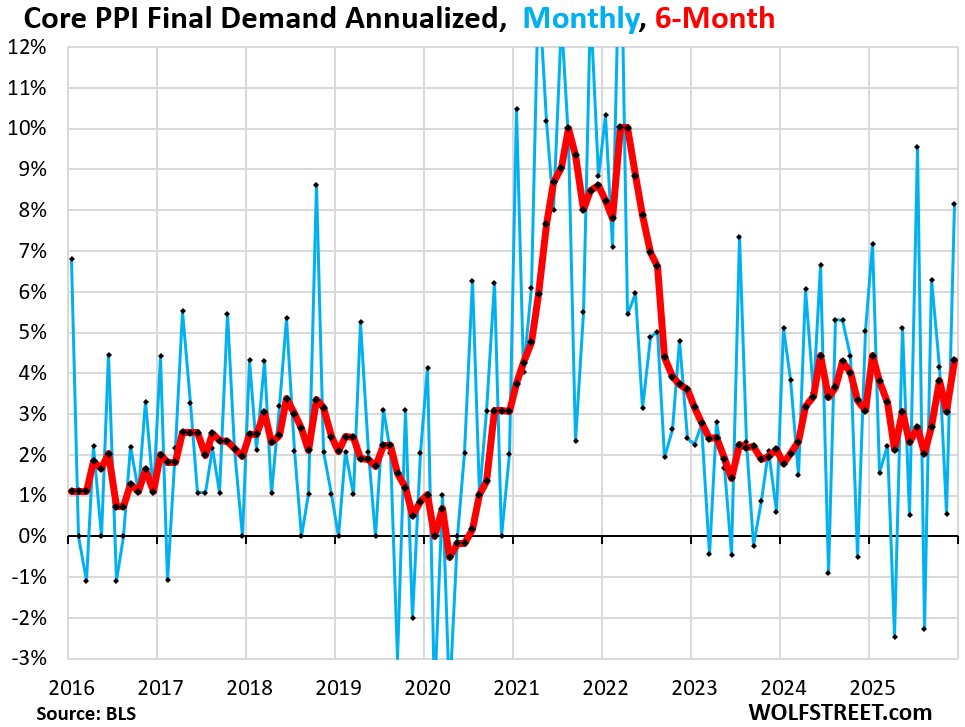
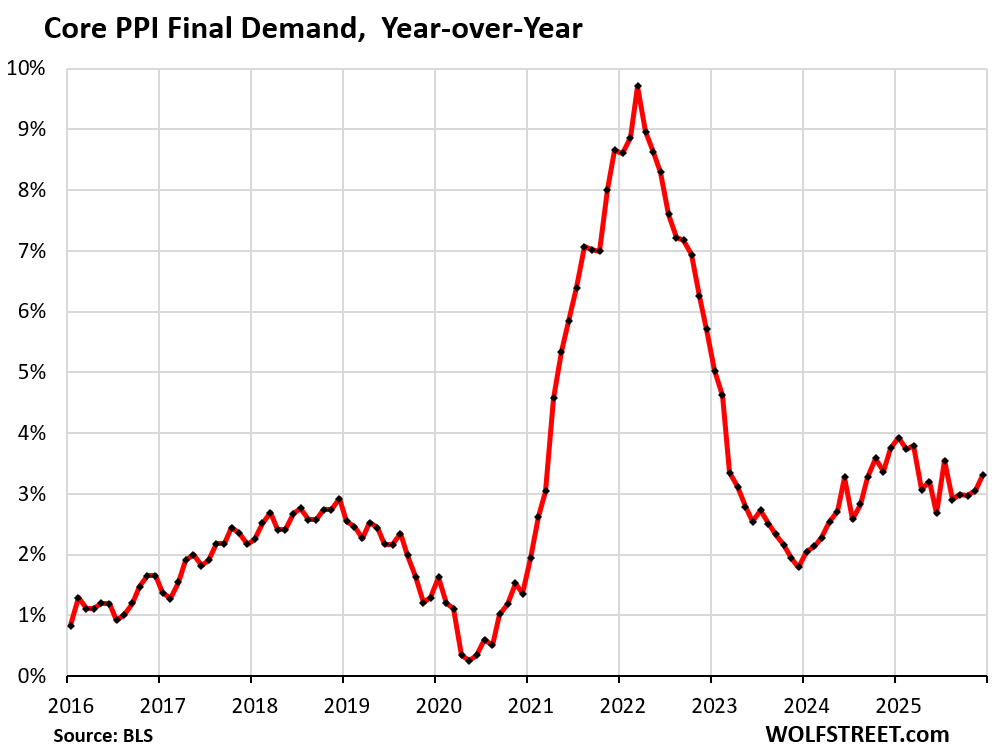
Year-over-year, core PPI accelerated to +3.3%:
Enjoy reading WOLF STREET and want to support it? You can donate. I appreciate it immensely. Click on the mug to find out how:

![]()
Good news depending on your perspective
What if anything can the federal government do through policies to lower services inflation?
Warsh would say: slow down spending and reduce the balance sheet to bring down money supply. I’m not sure that would work in reducing services inflation, but that’s his theory, and it’s worth a try.
https://wolfstreet.com/2026/01/30/markets-reaction-to-warsh-silver-collapses-gold-plunges-dollar-jumps-treasuries-yawn-stocks-drop-already-battered-cryptos-sink/
For starters, short term interest rates set by the Fed, should be at least 5%, as they were prior to the fall of 2024, if there is actually intention to keep inflation at 2% ish anyway, a goal the Fed has not met for 5 years running.
Thanks! It was my favorite interpretation that I read today.
The fed futures for 25 point cut went slightly up as a result~ 325-350 today 15.4% vs yesterday 13.4%
Logic says it should have went down after Todays report and revisions. I really question how smart people are lately.
Is there a main theory for why non-tariffed services prices are rising?
Isn’t that the definition of inflation? For example, fast food workers need to make more money because cost of living goes up.
Broadly agree with that “definition of inflation” explanation –
1) if you pump a sh*t-ton (technical term) of incremental fiat into a macro-economy,
2) divorced from any immediate increased supply of real goods or increased supply of service providers,
3) you are highly, highly likely to ignite a bidding war (for limited supply) using that incremental fiat as fuel,
4) creating the very definition of inflation – asset or real goods or services.
And the inflation will then “move around” as each sector tries to regain some relative equilibrium.
Only true net result – conservative savers (versus speculators) get incrementally expropriated (just like ZIRP).
I’m gestating an idea that, perhaps, the tariff drama is hiding the establishment of a flat tax system to replace the progressive tax philosophy that has been the guiding principle these past 250 years.
Wolf, a few months back I asked you about Kevin Warsh. You said he’d probably be a good choice, but for that reason he “probably wouldn’t get picked” LOL!…do you still feel the same way?
I still feel he is a pretty good choice due to his hostility to QE and to the large balance sheet. But I was obviously wrong about him not getting picked.
I discuss some of the reasoning here:
https://wolfstreet.com/2026/01/30/markets-reaction-to-warsh-silver-collapses-gold-plunges-dollar-jumps-treasuries-yawn-stocks-drop-already-battered-cryptos-sink/
That Gold and Silver and Crypto have all been behaving this way over the last couple days is manic. Unrelated to the PPI but there’s clearly some segment of the population losing its mind right now
Might have contributed to the metals correction today, along with the Fed news, as rates seem more likely not to be lowered significantly any time soon
Too many pieces of paper chasing too few actual ounces,keeps up see a buying opportunity to increase my stacks.
“ In summary, without food and energy:
“Core PPI Final Demand, which includes all goods and services except food and energy, and which is dominated by services, spiked by 0.66% month-to-month (+8.2% annualized).”
Not too many data points at or above that level on the chart. Most of them were “transitory” for 1-1.5 years between 2021-22.
Food? Have not seen much relief here in the city.
Wolf said, “the Producer Price Index does not track import prices. It tracks prices that companies charge each other; so it does not directly track the costs of tariffs that companies pay on imported goods.”
What we are talking about is what is the inflation rate in an obviously inflationary monetary economic environment
what is the correlation between the mechanical PPI measurement and the well being of the every day people. Of which I am proudly a member.
We have CPI for that.
It is a fools errand to try accurately to imagine oneself
Financial bubbles are impossible to discern from the normal chaotic back ground
Like the geophysical corollary, the earth quake
I live with the realization that Bob Dylan is from Hibbing on the shore through which millions of tons of iron ore pellets were shipped to the blast furnaces for reduction to elemental iron
Wolf,
Thanks for smoothing out a very noisy data series and showing the trend of rising inflationary pressures.
December was also the nadir for crude oil prices, which had been falling since June. Now crude oil is up 7% MoM.
I wonder to what extent lower petroleum product prices affected PPI for goods, and could they have mostly offset tariffs?
I’m long oil.