OER weighs 26% of CPI, 33% of core CPI, 44% of core services CPI. It moves the needle. CPI inflation would have been a lot hotter without this outlier situation.
By Wolf Richter for WOLF STREET.
The delayed release of the Consumer Price Index today, cobbled together with perhaps not all the staff and means that the Bureau of Labor Statistics has normally available due to the government shutdown, was perhaps the best that could be done under the circumstances.
But there were a few things that were off, the most important of which was Owner’s Equivalent of Rent (OER), a huge component in CPI, accounting for 26% of overall CPI, for 33% of core CPI, and for 44% of core services CPI: It was a massive historic outlier.
OER rose by only 0.13% in September from August (blue line in the chart), according to the BLS today, compared to 0.38% in the prior month, and compared to the 12-month range between +0.27% (May) and +0.41% (July). Something went wrong there, and given its huge weight, OER significantly pushed down the month-to-month readings of overall CPI, core CPI, and core services CPI.
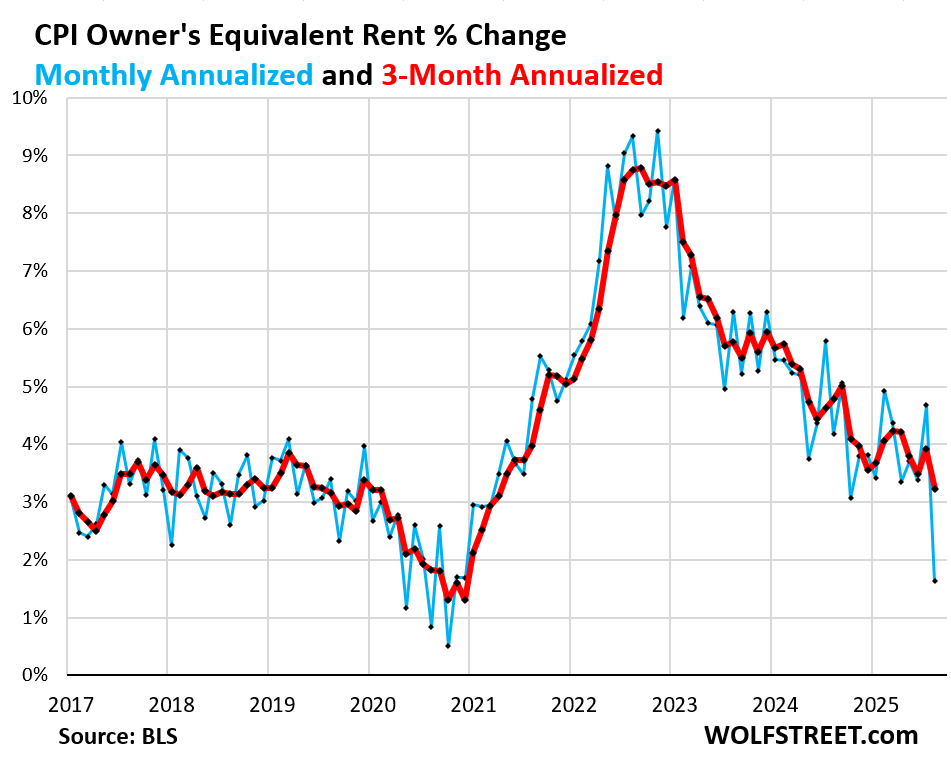
If this situation with OER hadn’t happened, the inflation readings today would have been a lot hotter than they were, particularly core services CPI where OER weighs 44% and core CPI where OER weighs 33%.
OER is not a measure of rent. The measure of rent is the Rent CPI. OER is a stand-in for the costs of homeownership. OER indirectly reflects the expenses of homeownership such as homeowners’ insurance, HOA fees, property taxes, and maintenance. It’s the only measure for those expenses in the CPI. It is based on what a large group of homeowners estimates their home would rent for, with the assumption that homeowners would try to recoup their cost increases by raising the rent.
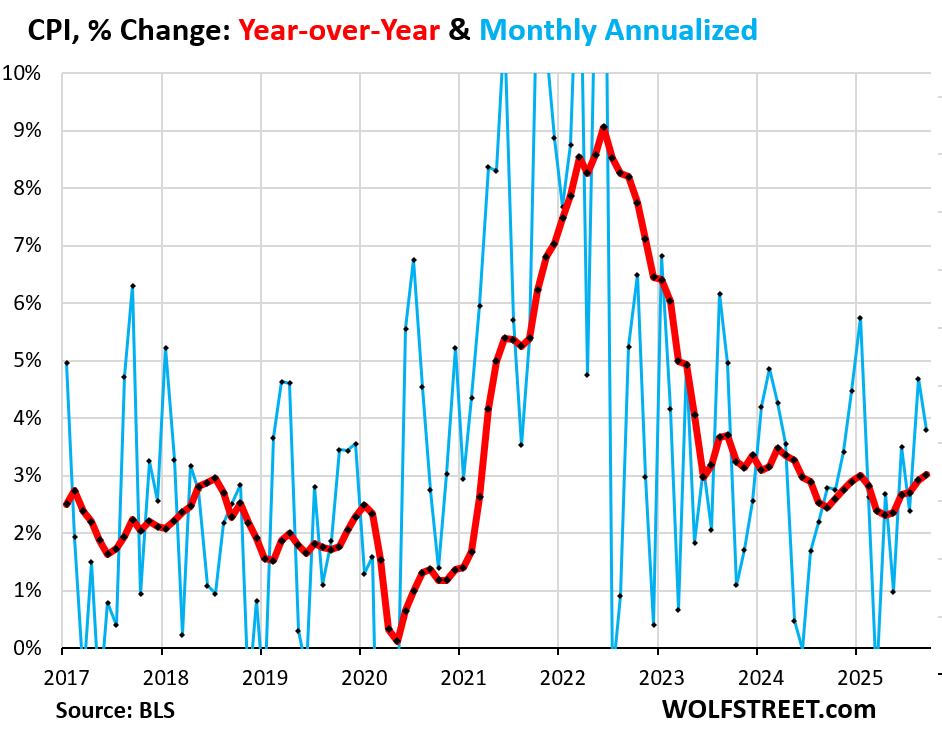
Overall CPI rose by 0.31% (+3.8% annualized) in September from August. So not a benign inflation reading, but the second worst since January. And yet it was pushed down by the OER outlier situation (blue in the chart below).
Year-over-year, overall CPI rose by 3.01%, the worst increase since May 2024, and the sixth acceleration in a row.
It would have risen more without the OER outlier (red).
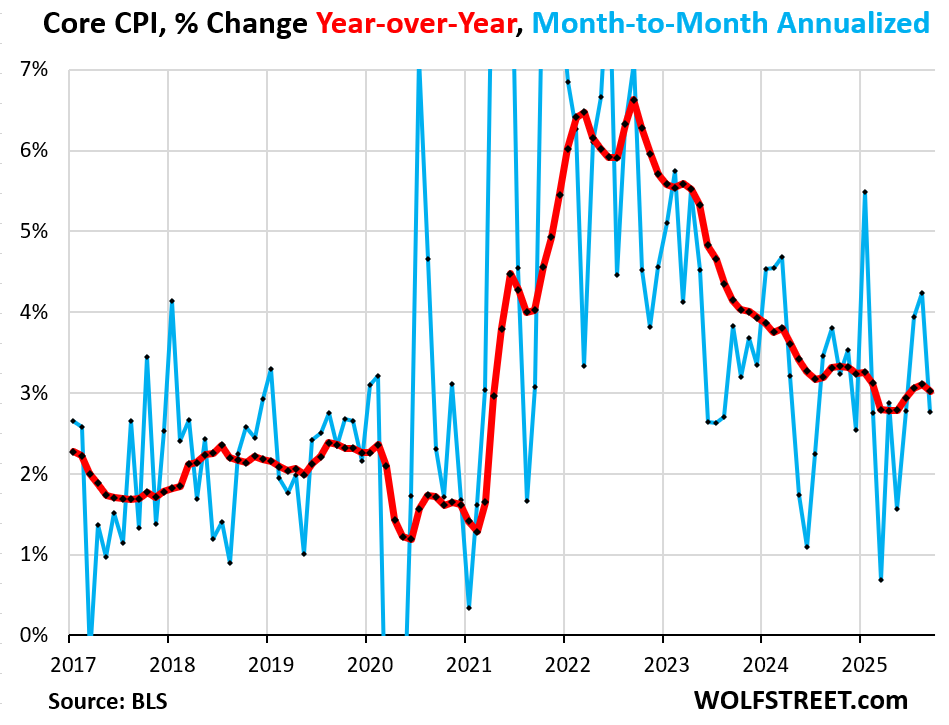
“Core” CPI, which excludes food and energy components to track underlying inflation, clearly showed the massive push-down from the OER outlier.
It rose by only 0.23% (2.8% annualized) in September from August (blue) which caused the year-over-year increase to decelerate to +3.0% (red).
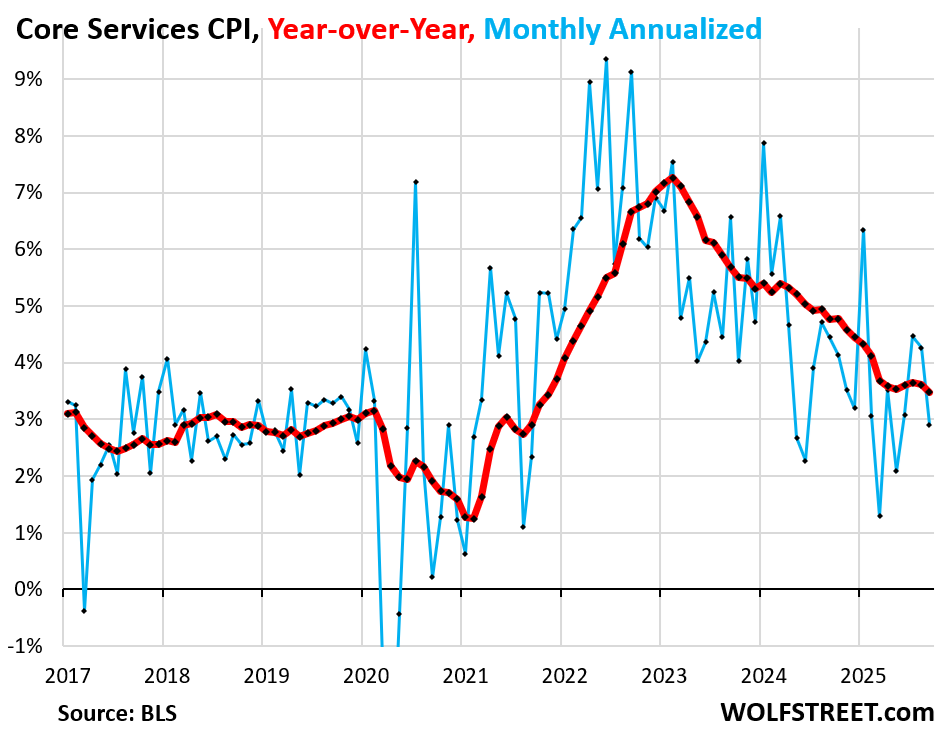
Core services CPI, where OER weighs about 44%, was heavily impacted by the OER outlier: It rose by only 0.24% in September from August (+2.9% annualized).
Core services are about 60% of the overall CPI. They include many of the essentials that consumers cannot do without – housing (OER!), medical care, health insurance, auto insurance, tenant’s insurance, subscriptions; telephone, internet, and wireless services; lodging, rental cars, airline fares, education, movies, sports events, club memberships, water, sewer, trash collection, motor vehicle maintenance and repair, etc.
But with 44% of it gone haywire in some way, it doesn’t really indicate anything for September.
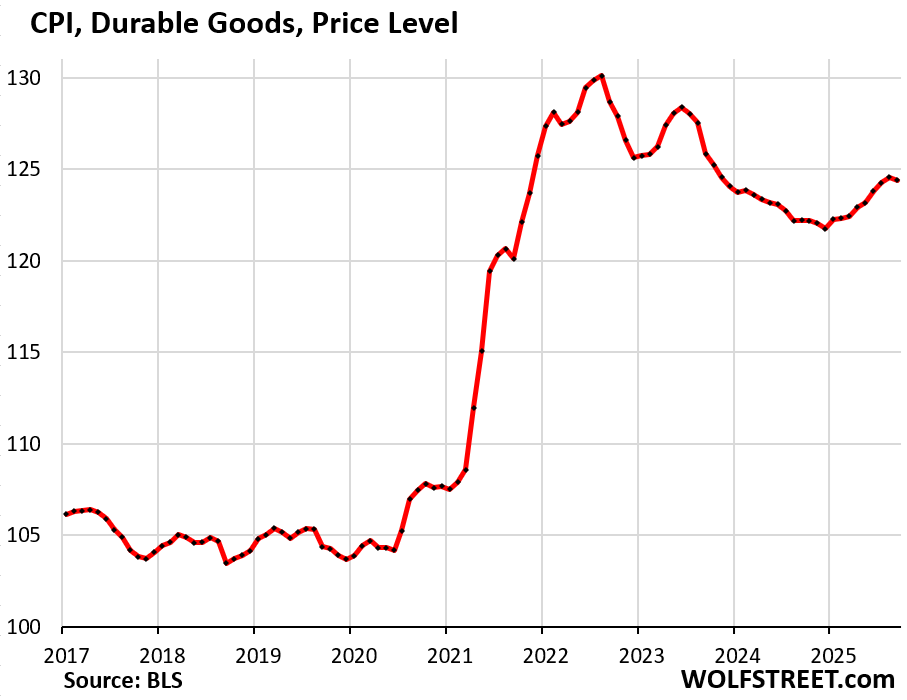
The CPI for durable goods dipped in September by 0.13%, and year-over-year, decelerated to +1.8%.
| Major durable goods categories | MoM | YoY |
| Durable goods overall | -0.1% | 1.8% |
| New vehicles | 0.2% | 0.8% |
| Used vehicles | -0.4% | 5.1% |
| Household furnishings (furniture, appliances, floor coverings, tools) | 0.2% | 3.0% |
| Sporting goods (bicycles, equipment, etc.) | 1.0% | 0.0% |
| Information technology (computers, smartphones, etc.) | -0.8% | -5.1% |
The chart below shows the price level, not the percentage change, of the durable goods. The index had spiked by 25% during the pandemic and then prices came down some from those highs, starting in mid-2022. The index is dominated by new and used vehicles. Used vehicle prices had spiked by 55% from mid-2020 to mid-2022, then declined. But 13 months ago, in August last year, used vehicle prices started zigzagging higher again on tight supplies.
Given how messed up the core services CPI is due to the outlier situation of OER, it doesn’t make much sense to delve into services inflation further at this point.
I will post a special and detailed analysis on food inflation and on energy inflation later today. Lots of interesting stuff happening there. Stay tuned.
Enjoy reading WOLF STREET and want to support it? You can donate. I appreciate it immensely. Click on the mug to find out how:

![]()
Bad situation. Either the government released data with a major error, or the government released manipulated data to get an inflation reading it wanted.
Let’s see what the “fake government data” hawks that have circled for a few years say about this one.
This really doesn’t look good.
There are other things that I noticed. For example, there were no revisions of prior data at all. None. I’m not sure I have ever seen that happen before. Since revisions go in both directions, this surely was due to a shortage of staff and time due to the government shutdown. They just did what they could to get something out.
It would be prudent for the government to disclose this frankly, right? All they need is a one-liner stating something along the lines of “Data provided in this CPI report will be revised in the future; due to shorter staffing during the government shutdown, various inflation-related measures and indices, in addition to evaluations of prior published CPI reports, should be considered preliminary.”
This could very well be a case of negligence rather than deliberate data manipulation. I am basing that off the absence of prior data revisions or seasonal adjustments. Tight deadlines with short staffing produce reports with these kinds of errors and omissions.
I looked for this one-liner but didn’t find one. But instead, I found that the BLS said that, due to staff shortages, contacting it and getting responses via email was limited. So it’s hard to reach out to them and get a reasonable answer. I have reached out to them before on a technical issue for durable goods, and they did reply back with a good answer. But I guess not today.
«It would be prudent for the government to disclose this frankly, right?»
It may be just happenstance or it may be that after decades of appointments by globalist expansionist administrations since Reagan and Clinton most of government managers are loyal to the globalist faction and are part of the #Resistance against nationalist consolidationist politics.
«This could very well be a case of negligence rather than deliberate data manipulation.»
Underestimating inflation one time can lead to a massive revision upwards next time thus delivering a shock, whether intentional or not…
Hello Dumb Boneheads. Rents in California went down which is likely a huge component of this big compenent. So tired of people of the internet that can only see their tiny little world and try and extrapolate meaning from it.
Rick,
“Hello Dumb Bonehead” …
Rents did NOT go down in California; they’re currently rising and have been rising all along.
These are actual rents paid by actual tenants (CPI Rent) and also OER (CPI OER):
In the San Francisco-Oakland-Hayward metro, and both CPI for rent and CPI for OER are surging:
Rent:
https://data.bls.gov/timeseries/CUURS49BSEHA?amp%253bdata_tool=XGtable&output_view=data&include_graphs=true
And OER:
https://data.bls.gov/timeseries/CUURS49BSEHC?amp%253bdata_tool=XGtable&output_view=data&include_graphs=true
This is for the Los Angeles-Long Beach-Anaheim area, and both CPI for rent and CPI for OER are surging:
Rent:
https://data.bls.gov/timeseries/CUURS49ASEHA?amp%253bdata_tool=XGtable&output_view=data&include_graphs=true
And OER:
https://data.bls.gov/timeseries/CUURS49ASEHC?amp%253bdata_tool=XGtable&output_view=data&include_graphs=true
This is the rent and OER data for those areas in CA that went into CPI.
I would agree that the OER would not be accurate during the government shutdown. However, as a real estate broker in Central California, I would not be surprised to see OER declining. With the new home and resale markets being soft, it is historically true that rents will soften too. I am seeing asking rent reductions and special offers (free months rent.)
I had this consideration also. I am seeing a lot of price drops on the Zillow (somewhat unrelated).
Just looking at indicators of conditions and sentiment.
If the sentiment soured, could this be a real data point? Any “survey” based data is ultimately subjective (even if it is consistently so).
No wait a minute. OER has ALREADY cooled a lot over the past two years, reflecting what you say. That was already in it before today.
The housing market is slow moving. There are NO BIG CHANGES month to month. It’s like watching paint dry. Which is why today’s OER is such a historic outlier.
One should never read too much into the month to month data but looks more at the long term trend. I think you said it.
Anyway, inflation should be tamed down from money tightening but also at the same time propped up by data center spending. The malinvestment of data centers will lead to trouble at some point.
Perhaps they should change BLS to BSL and lose the L.
So if you just lose the L without rearranging you still arrive at the same place.
Wolf, couple typos I think. “ It rose by only 0.23% in September from August (blue) which caused the year-over-year increase to decelerate to +2.8% (red).” The graph shows 3.0% for the red line.
Also, CPi in the graph has a lowercase “I”.
As always, greatly appreciate your work and speedy reporting + analysis!
Using OER is the most ridiculous measure of rent there is. It should be removed entirely.
OER is NOT a measure of rent. The measure of rent is the Rent CPI.
OER is a stand-in for the costs of homeownership. OER indirectly reflects the expenses of homeownership such as homeowners’ insurance, HOA fees, property taxes, and maintenance. It’s the only measure for those expenses in the CPI. It is based on what a large group of homeowners estimates their home would rent for, with the assumption that a homeowner would try to recoup their cost increases by raising the rent.
Right, but it’s still a crap measure. Most homeowners have no intention of renting out their homes, and don’t have a clue what they would rent for. They literally just make shit up when asked this.
Maybe in some places TS, but not in our current hood in the saintly area of TPA Bay area where we have owned 10 years this month.
ALL, repeat ALL the older houses have exactly the same beginning footprint, and LLs we talk to are clear when discussing why they ask the rents they do.
Vintage, but you are talking to other landlords. They don’t limit this question when calculating OER to landlords, but to homeowners who live in their houses too. If you buy a house in 1999, are you really thinking about in 2017 what you could theoretically rent it out for?
Wholeheartedly agree. If the purpose is to estimate home ownership costs for home owners, why not track actual home ownership costs instead of a theoretical rent amount?
If I’m a homeowner, I don’t care what my home would rent for because it’s not rented. What I would care about is utility costs, maintenance, property tax, insurance, etc. Whether I could recover any of that in a theoretical rental arrangement is irrelevant and highly subjective.
I’m all for including HOA fees, property taxes, homeowner’s insurance, and maintenance & repairs.
But if you include measures that track home prices and interest rates, you get into serious trouble.
1. Including home price changes: When home prices plunged during the Housing Bust, CPI would have been steeply negative for several years even though consumer prices kept rising, and CPI would have lied about it. So that’s a total no-no. Assets are NOT consumables and don’t belong into a consumer price inflation index.
2. Including interest rates: The plunge of mortgage rates during the pandemic (something like -50% yoy) would have turned CPI negative even though consumer prices were beginning to explode.
In Canada, the CPI component that tracks the costs of homeownership includes subcomponents for homeowner’s insurance, mortgage rates, maintenance, replacement costs, HOA fees, etc.
The mortgage rate component has been a contributor to the decline in the CPI as Canadian mortgages track short-term interest rates. So the rate-cut decision by the BOC mathematically reduced CPI regardless of what consumer prices were doing.
The component for replacement costs, which has declined with falling home prices, is also a contributor to lowering CPI despite rising consumer prices.
So these two elements — changes in home values and mortgage rates — have got to stay out of a consumer price inflation index.
Here’s what the BLS says on the factsheet:
“The shelter service that a housing unit provides to its occupants is the relevant consumption item for the CPI. Most of the cost of shelter for renter-occupied housing is rent. For an owner-occupied unit, most of the cost of shelter is the implicit rent that owner occupants would have to pay if they were renting their homes, without furnishings or utilities.
Owned housing units themselves are not priced in the CPI Housing Survey. Like most other nations’ economic statistics programs, the CPI program views owned housing units as capital (or investment) goods distinct from the shelter service they provide, and therefore not as consumption goods. Spending to purchase and improve houses and other housing units is treated as investment and not consumption in the CPI. Interest costs (such as mortgage interest), property taxes, real estate fees, most maintenance, and all improvement costs are part of the cost of the capital good and are also not treated as consumption items. These non-consumption costs of owned housing are out of scope for the CPI under the cost-of-living framework that guides the index.”
While well-intentioned, I do not believe it makes sense. The bit about how interest, upkeep, property taxes and other “homeownership” costs are really “capital good” expenses and not consumer price items is farcical.
Alternatively, if the BLS really wants to distinguish “consumption” vs. “investment” costs for housing, it needs to recognize that everyone needs to maintain an ongoing “investment” in their housing, in order to have a place to live. So in addition to a “consumer price index” there would also need to be a “residential housing investment price index” to properly account for the real-world costs of housing.
improvements or increases in lifetime would be capex. simple maintenance gets treated as opex
“Most of the cost of shelter for renter-occupied housing is rent. For an owner-occupied unit, most of the cost of shelter is the implicit rent that owner occupants would have to pay if they were renting their homes, without furnishings or utilities.”
This is ridiculous. If they are looking for what owned homes would rent for, absent furniture and utilities, why not reference ACTUAL rents in the home/condo rental markets, which exclude furniture and utilities as well as investment components.
Why not just create a new rental index for homes/condos that are actually rented?
This checks out. Anecdotally just in August and September my homeowners insurance increased 15% y/y, my property taxes went up 10% y/y and my HOA contribution went up 20% y/y. The increases are not relenting. I’ve had to up the amount I save each month to cover these payments twice now this year.
Maybe house prices are decreasing but ownership costs are going up.
Thanks for reporting this, this tid bit seems to have gone over everyone’s head on Wall Street today.
Please forgive if I missed it, but does OER include utilities (water, sewage, gas, electricity)…if not, then where does CPI capture it?
These are separate line items in CPI:
Under energy:
-Electricity service
-Utility natural gas to home
-Heating oil, propane, kerosene, firewood
Under core services:
-Water, sewer, trash collection services
Excellent find, I was skeptical when print originally released due to staff shortages, now I know why.
Yes b/c of Government Shutdown, accuracy of data is questionable.
But Wolf, if the OER did not show such an outlier low number, and came typically in the range or like it did in August, what do you think the Nominal CPI Inflation and Core CPI Inflation would have been ?
Good question. I got my calculator out and I think the right answer is, if there was no change, the CPI would be about 0.6% higher and the core services would be 0.8% higher.
I would think that if the administration were going to fudge the numbers, it would be in ways difficult to notice — a nip here, a tuck there. Then again, when I think back to the ridiculously poor quality of the Liberation Day chart….
A lazy kid in junior high with an understanding of percentage and CPI weights would have done it exactly this way, if asked to manipulate CPI. A hard-working kid would have tried to hide it a little.
Wolf – we could borrow (no interest) ten clowns from the circus who could give us information that was just as, or more reliable and accurate.
The aforementioned clowns have a high school education at best, some of them dropouts.
You get the idea – no geniuses putting out these reports.
What is happening with all of those corporate profits?
I thought prices weren’t going to spike with tariffs and consumer pullback because record profits were going to eat the tariff costs.
Why are prices going up now? Are we back to profit padding?
Rich people and retirees are still spending like there is no tomorrow, and poor people don’t have anywhere else to cut and don’t really matter in the aggregate anyways due to wealth inequality, so what is going on here? Are the wealthy consuming so much that they are pushing prices up?
Services prices are going up. Services are not tariffed.
Yes that’s exactly what’s happening, in my opinion. Inflation is being stringent by the top 5% who are spending with abandon as they have plenty of wealth effect mentality from their stock and housing gains.
Since the July through September data sets the 2026 COLA, an inflation number skewed lower than actual inflation will shortchange millions of people with wages or benefits tied to the number.
Yes, but the good thing is the the COLA is based on a three-month average, so only one-third of whatever error was introduced today would apply to the COLA.
If one assumes OER was actually in the middle of its range for the past 12 months (+0.34%) instead of the reported outlier (0.13%), then:
(1) Core CPI (with 33% OER weight) would be up 0.30% instead of 0.23% over the month, and up 3.07% over the past year instead of 3.0%
(2) Core Services CPI (with 44% OER weight) would be up 0.33% instead of 0.24% over the month, and up 2.99% or 3.0% over the past year, instead of 2.9%.
And the Fed might not be so enthusiastic about rate cutting.
Bagehot’s Ghost 👍
In that scenario:
Core cpi mom annualized 3.6%
Core services mom annualized 3.96%
Hmm…
Lack of staff? Deliberate manipulation? Banana Republic stuff.
Hopefully some like minded individuals can get the word out. Won’t hold my breath. Fox News covering the important stuff on their front page, this time its the Clintons and Amy Schumer’s abs.
“Lack of staff?”
Didn’t you hear? government shutdown, government employees included at the BLS got furloughed.
So then the BLS hastily recalled some but not all of its employees to start belatedly working on the CPI report. But surveyors are still not in the field, and many roles that work on the CPI data are likely also unmanned currently. This has got to be a huge mess.
It is much easier to manipulate a huge mess, than a well executed report. I am not saying it was, just that ‘mistakes’ can happen in ‘huge mess’. This possible (likely?) mistake was in favor of the current leaders. It is pretty easy to ‘jump to conclusions’ that may or may not be correct.
If the OER number is a mistake or a lie, then the Dow just hit a record high based on a mistake or a lie. If the OER number is real, and is in fact data accurately reflecting reality, then homeowners appear to be on their way to a world of hurt. The OER number needs to be explained by BLS, which apparently won’t happen. To see if this OER is indeed an outlier, or the beginning of a sharp downward trend, we will just have to wait for the next report, which, oh BTW, may not happen for quite while.
Without government-generated economic data, which wasn’t all that good to begin with, we are flying blind. The best course of action for the Fed is to stand pat until data starts flowing again. Powell’s favorite term, “data-dependent”, does not mean much if there is no data. Of course, the Fed will, in all its stupidity, lower rates at the next meeting.
They had to get this out so they could have a number for the COLA adjustment for next year. If it werent for that they wouldn’t have done it at all. And with about 40% of numbers imputed, along with these outliers, it looks like they could have easily found a way to bring that number in low to save a few bucks on next years SS outlays.
In the past shelter was raising the CPI calculation, this is the first time that shelter being doing pushed the CPI down.
After firing and/or furloughing all of the serious people at BEA, I’m not sure why much stock is still being put in these releases. That the topline number came in lower than expectations on account of the OER number being light (an imaginary metric to begin with) just reinforces the point.
The CPI is now little more than state-sponsored propaganda.
But leave it to the MSM to run with the government’s preferred takeaway… Inflation is under control, and the Fed should make another rate cut soon.
I’m sick of it.
The MSM is a tool of the Democrat Party and of Wall Street. Makes you wonder who composes the Democrats.
Lol Fox News is the most watched mews channel and therefore IT is by definition the most mainstream media. Obviously a democrat controlled insitution.
Of course they still play the outraged victim because thats what keeps them #1
This postreality world really sucks sometimes.
For those waiting with bated breath for the next inflation report, your breath is likely to get more bated:
“WASHINGTON, Oct 24 (Reuters) – The White House said on Friday it had learned there likely will not be a release of inflation data next month due to the U.S. government shutdown, which could leave a gap in a data series stretching back more than a century.
Because surveyors cannot deploy to the field, the White House has learned there will likely NOT be an inflation release next month for the first time in history,” the White House said in a statement.”
What a convenient time for the government to shutdown. I don’t think I’ve ever seen you question data before. So for you to question it, that really says something about what is going on.
I have “questioned” a lot of data, including cussing out publicly and multiple times the method for the health insurance CPI. To see that, google:
health insurance CPI chickenshit
My stuff on it comes up right at the top. Even AI is speechless on this topic 🤣
The health insurance CPI continues to be chickenshit.
Beginning next year, I believe household health insurance pemium costs will surpass annual rent. The PCE weights are FUBAR. They will never be able to close the gap in a way that maintains time averaged continuity with previous weights.
“household health insurance premium costs will surpass annual rent.”
For the overall US population on average, that’s just nonsense. Companies pay a big portion of health insurance for their employees and sometimes for their families. The portion that companies pay doesn’t go into CPI/PCE. People over 65, on Medicare, pay relatively little in terms of health insurance. People on Medical pay little in terms of health insurance. There are many cheaper plans under the ACA. People with high-deductible plans with Health Savings Accounts have relatively manageable premiums (we’ve had them since 2006, so don’t give me any shit about them). All this is what CPI/PCE health insurance attempts to capture.
CPI/PCE health insurance is chickenshit, but your comment is nonsense.
Enron math today! If we keep increasing debt and failing to control inflation we will end up like Argentine. Speaking of cryptocurrency ponzi Milei, his country midterms are the next data drop coming up. I read no cpi inflation data coming out in November, regardless of government shutdown or opening. The trend up is intact! Have a good weekend!
OER – a very strange and hard to measure connotation (Owners equivalent of rent).
If such a factor can be included for housing it can also be included for a car or a truck.
Pretty straightforward to calculate. It would increase the year over year inflation rates by approximately 0.05-0.1% and the annualized month over month rates by between 0.6 and 1.3% (smaller for the CPI overall, larger for CPI core services).
Didn’t Trump fire the head of the BLS a couple months ago? Why is anyone surprised the data is “good” now? Of course this was going to happen. In 6 months time inflation will be at .00005% annually according to the BLS, Powell will be gone, the Fed will have the money printer glowing red hot again.
The White House withdrew its nomination of E.J. Antoni, and so Trump’s man at the BLS is not at the BLS.
William Wiatrowski is the acting commissioner of the BLS. He is a long-time senor BLS employee who has been acting commissioner before.
So there has been no change of the guard at the BLS.
Wolf, that’s only half the picture. The acting commissioner has seen the previous boss get shafted for delivering bad news, so whether he’s Trump’s loyalist or not, the effect is still there.
i wish people quit spreading homemade BS here. You have no f**king idea why this happened. So don’t spread your homemade BS about it. I’m so sick of this homemade BS. This is not X.
To be clear, Trump himself said publicly that he fired McEntarfer because she had “rigged” the numbers. So he made it pretty clear what he expects BLS leadership to do.
The unemployment numbers from August were very suspect, not just shutdown issues at fault.
Whatever faults you had with the system before, it was at least consistent in the way it was reported. Now it’s just random numbers. Check with your county’s actual economic data this summer.
So based on this low-ball data, Social Security released the 2026 COLA today. So 40 million Americans will be underpaid throughout 2026 due to faulty data. A big savings for the federal government. Deliberate?
Thanks for the analysis. Everywhere I look I see contradictory headlines; up, down accelerating, decelerating. This is actual information that I can trade on. The Wolf dividend grows!
I have an idea for trading. Please do not laugh. $BND is going to go up anyways. Buy 400 shares of $BND, say for $30,000 at a price of $75. If it goes up to $75.25, then sell the ETF for a profit of $100. Now there will be fluctuations and just buy the BND whenever it dips. The feds are going to cut rates anyways. So BND will for sure go up! or even it goes down, just hold it for a while to get the dividends. A profit of $500 a month is a lot. What you all think?
At some point, the loss of illegal immigrants (2 million so far) is going to impact vacancies and rents, bleeding into the CPI numbers.
True, but it will also impact the cost of home construction and maintenance, as many of the workers are immigrants. Some may not be legal, but many others are threatened by ICE’s indiscriminate arrests.
True, but it will also impact the cost of home construction and maintenance”
it will balance out due to “maintenance” will now not including ongoing repairs to leaking wall, roofs, ducts etc. due to faulty sloppy installation.
I have personally inspected 100’s of projects under construction (CA.) and many of the esl crews are beyond incompetent with no one on site with even the most basic understanding of codes and techniques and the city inspectors just glance from the road to make sure the address on the permit matches the mailbox, sign it and drive off…
…in terms of the labor, then, ‘…you get what you’re willing to pay for…”? (…or, similarly, ‘…a poor craftsman blames his tools…’).
may we all find a better day.
They have NOT deported 2 million people so far.
Bond market might become unhappy if good inflation data is hard to come by…
The 10 year didn’t drop today (actually went up a bit), so clearly it wasn’t as excited as the media was.
CPI is in long term contracts, such as utility scale solar developers with 25-50 year lease of ag land. As far as homemade bs goes, is this all not getting into Richard Pryor territory?
Thanks for this report. It confirms my suspicions; the government is going to lower interest rates and inflation be damned. Inflation makes our national debt worthless. Bonds are not worth owning long term. Gold looks good long term
Wolf,
I agree with your point. This outlier is historic and simply doesn’t make sense. I also wonder how come market just kept on going up on Friday and no analyst looked at it and questioned data.
Common sense, if government is shutdown then why not use average number of OER for past 12 months and be on the safe side but as you pointed out, plugging average number would have made CPI hotter than normal. Go figure!
Is the seasonal adjustment for September usually such a big reduction? They went from 0.199% (if you calculate the raw change) to 0.13% which implies a 35% seasonal adjustment. That seems big.
If you take the annual change in OER it averages out to be 0.31% per month, and if you use 0.31% instead of the 0.13%, the annualized September CPI comes out to 4.28%. Wow! 4.28% would have changed headlines all over the world… good catch, Wolf.
right or wrong, it stinks, since third quarter CPI is used to compute annual COLA increases for Social Security…
From Google Slop Engine:
“Contrasting indicators: This figure was seen as a statistical anomaly because other data in the same report still showed significant shelter inflation. For example, the related “rent of primary residence” index increased by a higher 0.2% in September.
Analysts’ reactions: Analysts noted that the disparity between the OER and other shelter data was unusual and created a “wedge” that exaggerated the cooling of underlying inflation trends.
According to Wolf Richter of Wolf Street, the outlier OER figure had a disproportionate effect on the core CPI, which would have been higher otherwise.
This can’t be wrong, right?
The transaction’s velocity of money is down in Sept. according to the H.8 assets and liabilities of US commercial banks. Total assets of the commercial banks are down -2.3 percent in Sept. That stopped the rise in Gold.
Wolf, thank you for bringing this data point to your readers. As a COM RE professional it forced me to chase down the source of all such reporting: the US Census Bureau’s Consumer Expenditure Survey (Quarterly). I then scrolled to the How Was I Chosen section…..I guess I’d just say that if that is really how the data is collected….(at least for this subject) it’s probably worth what folks (herein) paid for it. Having read USB of Labor Stats pages on the same subject….wow…let’s just say there are a several more accurate means of obtaining that number in real time in every zip code in America; and none of that requires Gov FTEs.
This could be just an outlier. If something that is sitting still gets measured through sampling hundreds of times, the expected result is a distribution around the true value of the whole population. Pick a measurement from that distribution and there’s a chance it will be way out in wings of the curve.
If the sample size was smaller than normal, or if the procedure changed in some other way, such as in the timing, then the odds of an outlier increase.
This is probably a metaphor for how the whole debt ceiling / periodic shutdown disrupts all the well-oiled machines that have been built by hundreds of thousands of government employees under the assumption that someone would always be available to do it.
Trump’s policy of shutting the border and removing illegal aliens may be having the effect of reducing upward pressure on rents. It’s been widely reported that the cessation of the flow of people seeking places to live, and now the reversal of that phenomenon has caused rents to soften in some places. Am I the only one connecting these dots?
Great to see the focus on Shelter’s (distorted) impact on CPI, but IMO, it is masking the more benign trend of inflation and delaying a needed (by real estate sector) normalization of short term rate policy (which also impacts MBS rates, due to monthly cash flows). CPI x Shelter was 2.7% YOY in Sept, higher than its 2.0 as recent as June, but WAY below the peak that led to the Fed’s massive rate hikes. Yes, the Sept, seasonally-adjusted OER figure .1 seems low, but this followed a .4 print in Aug, while the unadjusted figures for Sept were .2 and 3.8 YOY (i.e. OER still boosted YOY CPI). Other monthly figures seem distorted in the opposite direction, for example Gasoline was up 4.1 (mom !) seasonally adjusted for Sept, vs 1.4 unadjusted, while the YOY was actually negative .5. The shelter component overall seems flawed, at very least with a serious lag, but is forecast by Zillow to come down dramatically in ‘26, pulling overall CPI with it. If you believe actual rents, once accounting for concessions, are actually flat (BLS data is based on surveys of ask/list prices) and/or that the primary expense of owning a home (interest) has been unchanged due to fixed rate mortgages, try plugging a zero rate into the 35% weight for Shelter and see what it produces for CPI (hint: well under Fed’s 2% target). The LEVEL of housing costs are too high (thus low transaction volume and prices rolling over), but lower short term rates could help this, by fueling new supply (i.e. construction lending often based on SORF) and lower mortgage rates would help turn renters into homeowners – the Fed’s slow action is delaying this and sustaining a liquidity crisis in both residential and commercial RE.