Prices fell YoY in 22: Tampa, Austin, Miami, San Diego, Los Angeles, San Jose, San Francisco, Dallas, San Antonio, Houston, Phoenix, Orlando, Atlanta, Denver, Raleigh, Seattle… But rose in Chicago, Boston, New York, Philadelphia…
By Wolf Richter for WOLF STREET.
Prices of mid-tier homes in September declined year-over-year in 22 of the 33 large and expensive metropolitan statistical areas (MSAs) that we track here, up from 21 in August, and up from 6 at the end of 2024. MSAs are Census Bureau designated large urban areas often with multiple cities.
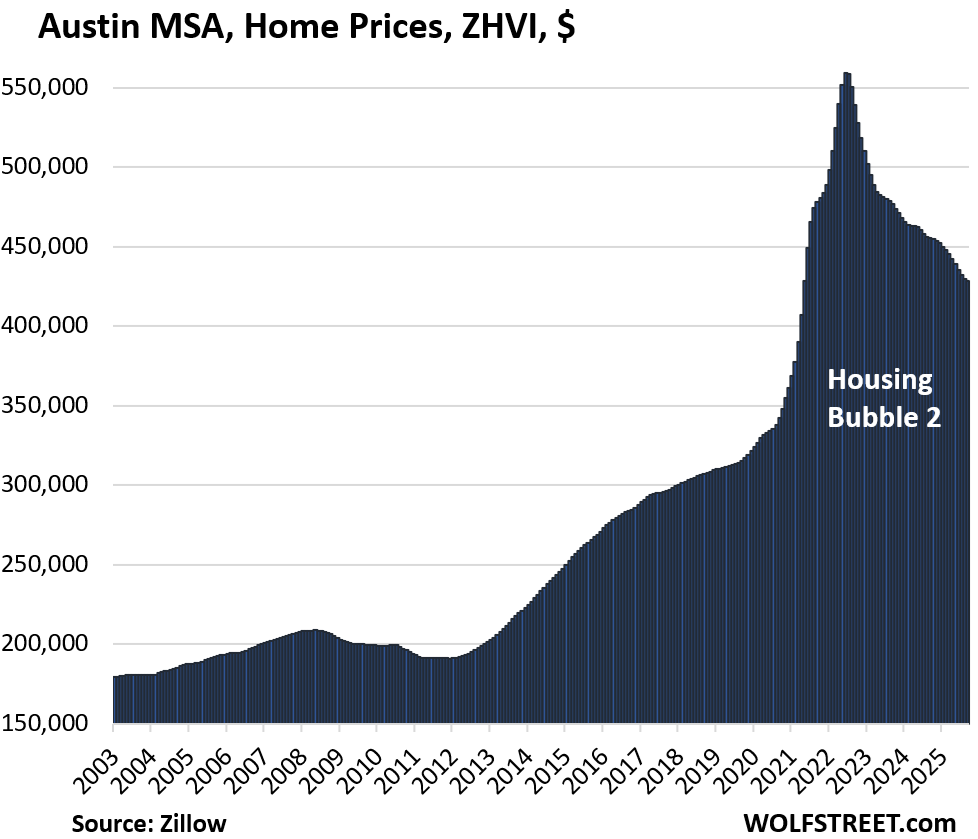
Prices were down from their peaks in 2022, 2023, or 2024 in 23 of our 33 metros, amid ballooning supply and low demand. The top entry among the 33 metros here is Austin-Round Rock-San Marcos, TX, where prices of mid-tier homes have plunged by 23.4% since mid-2022, and inventory has piled up massively.
Prices continued to skid in these markets because demand for existing single-family homes and condos has plunged while supply has surged.
In a few other metros of our 33 here, prices inched up to new records amid very tight supply. The top entry here is Chicago-Naperville-Elgin, IL-IN, where prices rose 3.5% year-over-year, the most in this lineup, amid very tight inventory.
Prices declined YoY in September in 22 metros of our 33 metros:
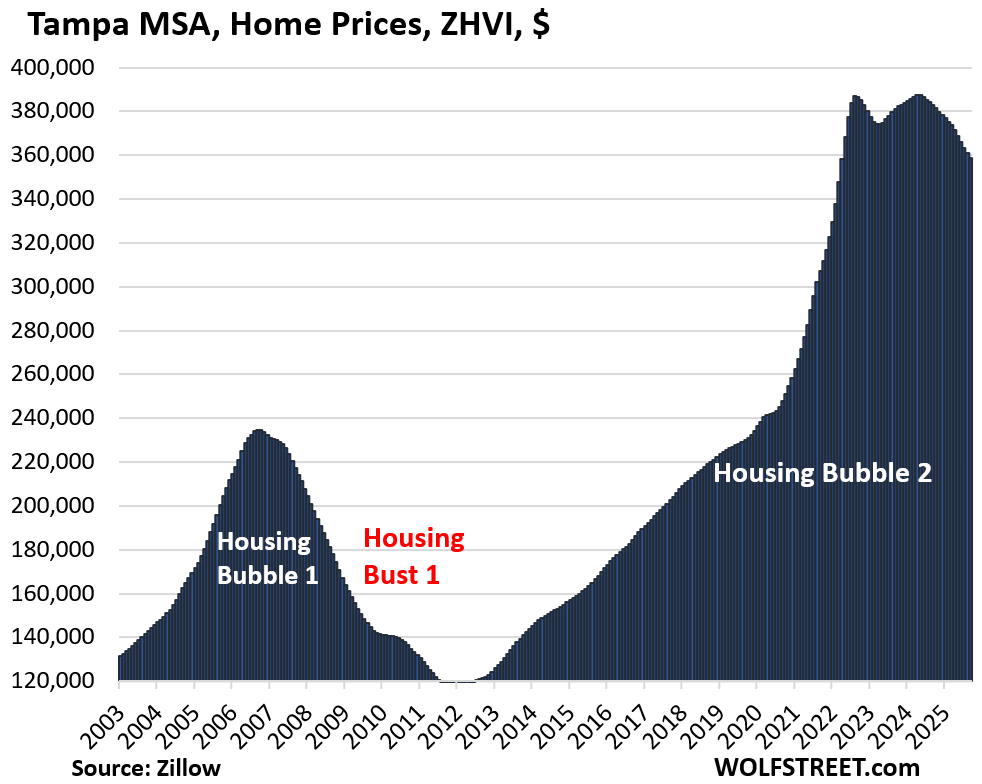
- Tampa, FL: -6.3%
- Austin, TX: -5.9%
- Miami, FL: -4.7%
- Orlando, FL: -4.4%
- Dallas, TX: -3.9%
- San Francisco, CA: -3.8%
- Phoenix, AZ: -3.6%
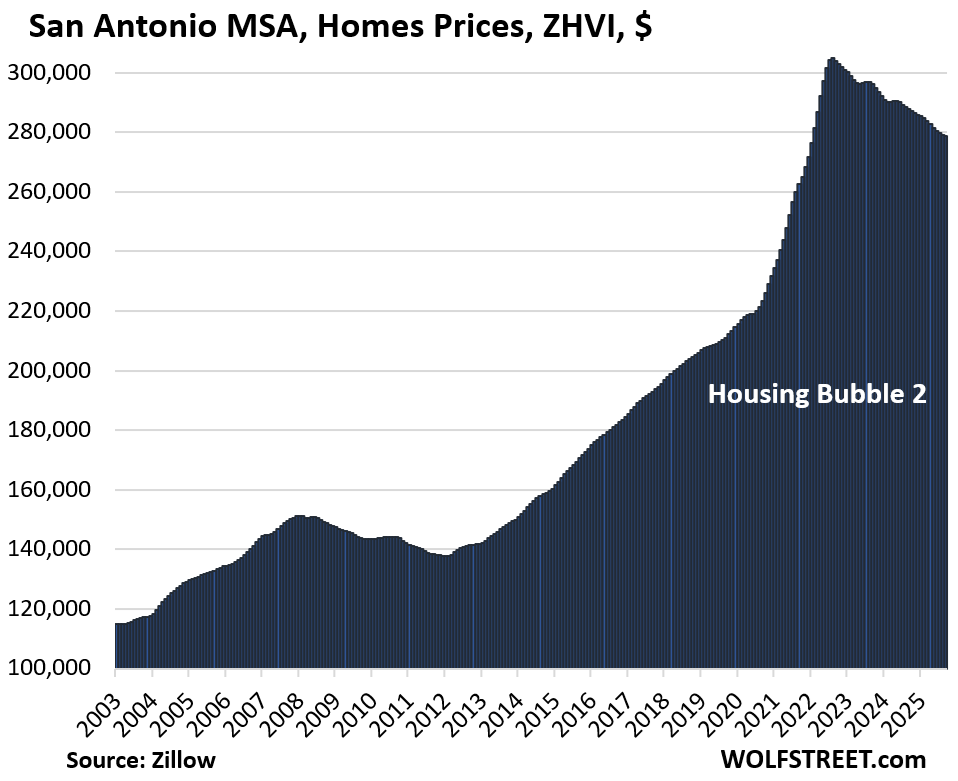
- San Antonio, TX: -3.1%
- Atlanta, GA: -3.1%
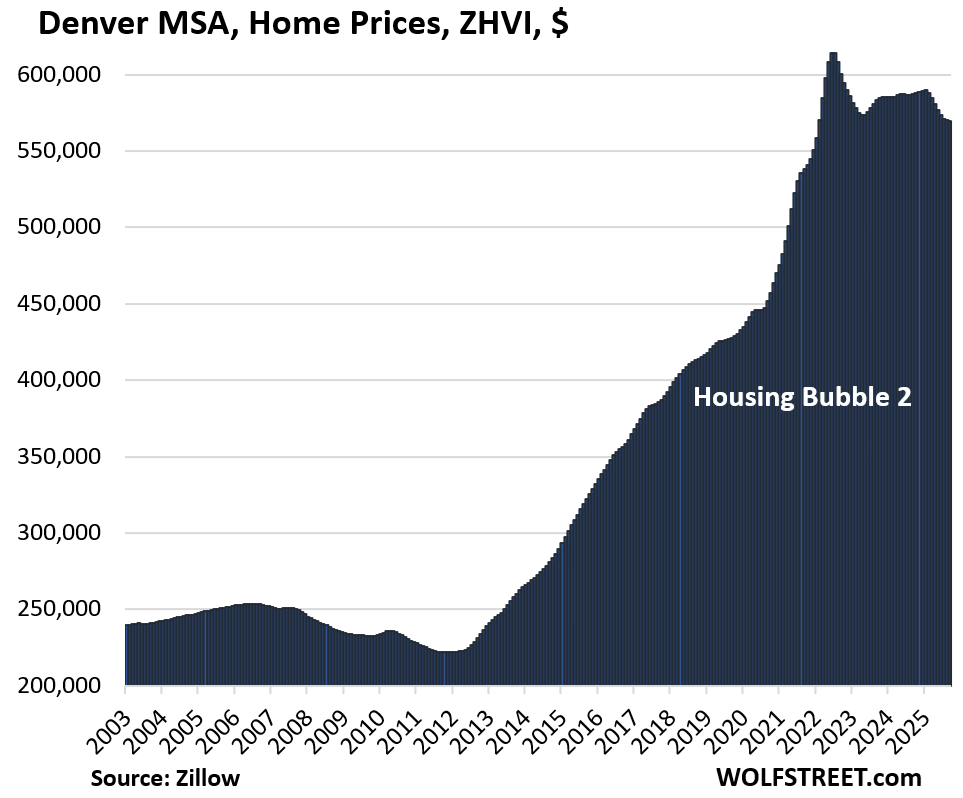
- Denver, CO: -2.9%
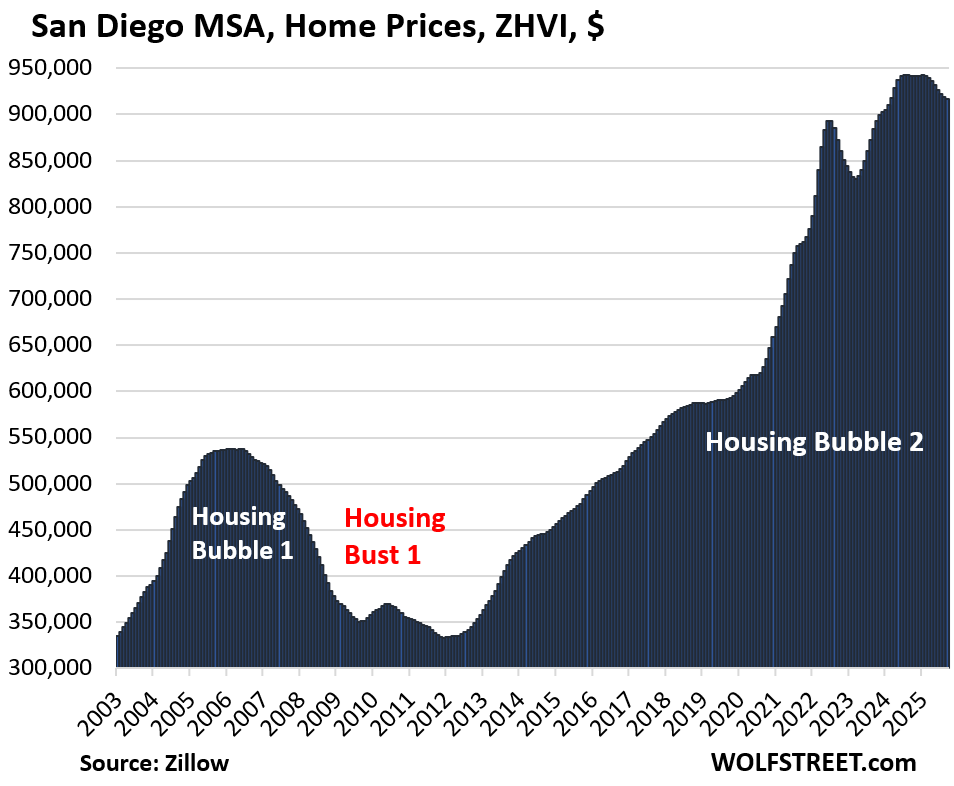
- San Diego, CA: -2.7%
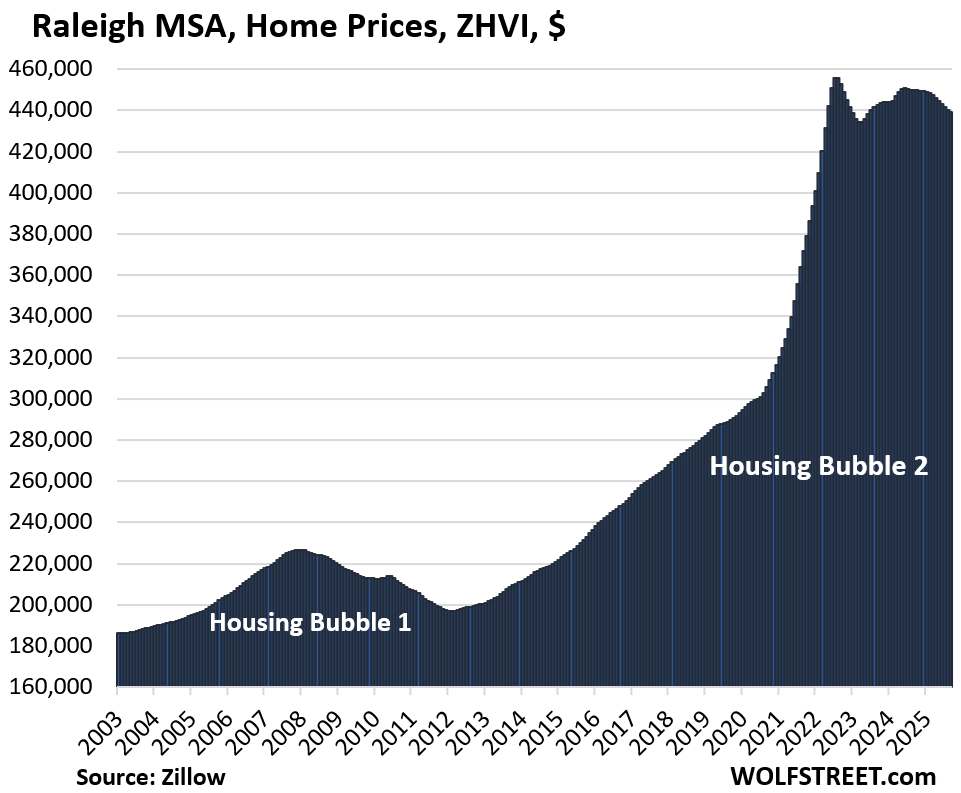
- Raleigh, NC: -2.3%
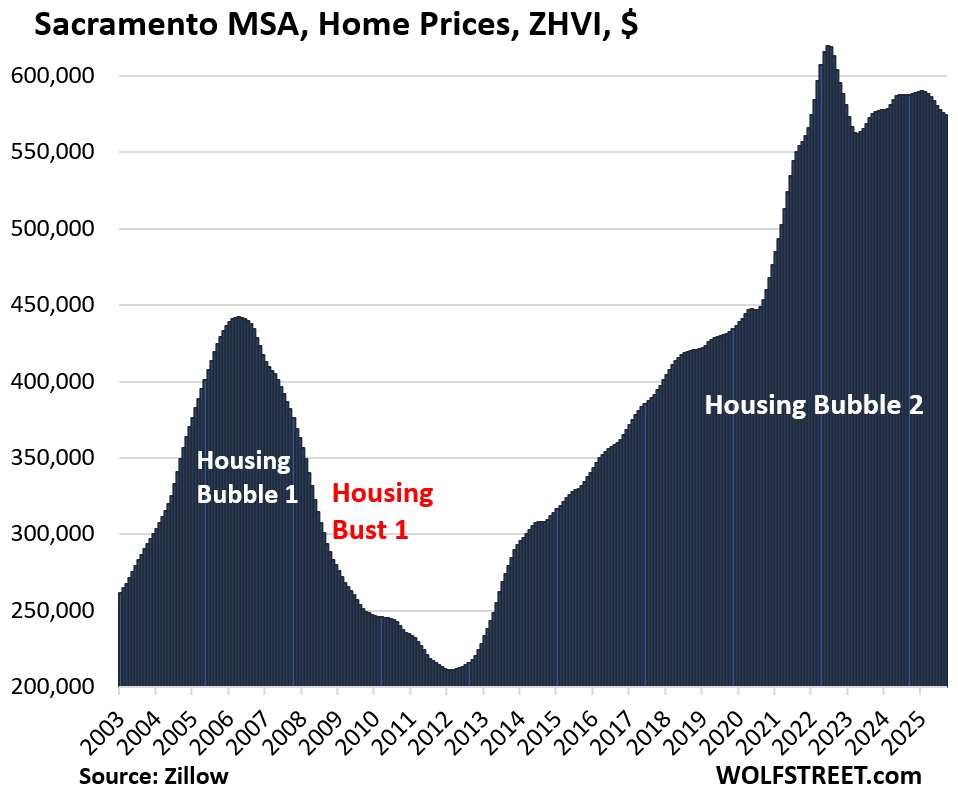
- Sacramento, CA: -2.2%
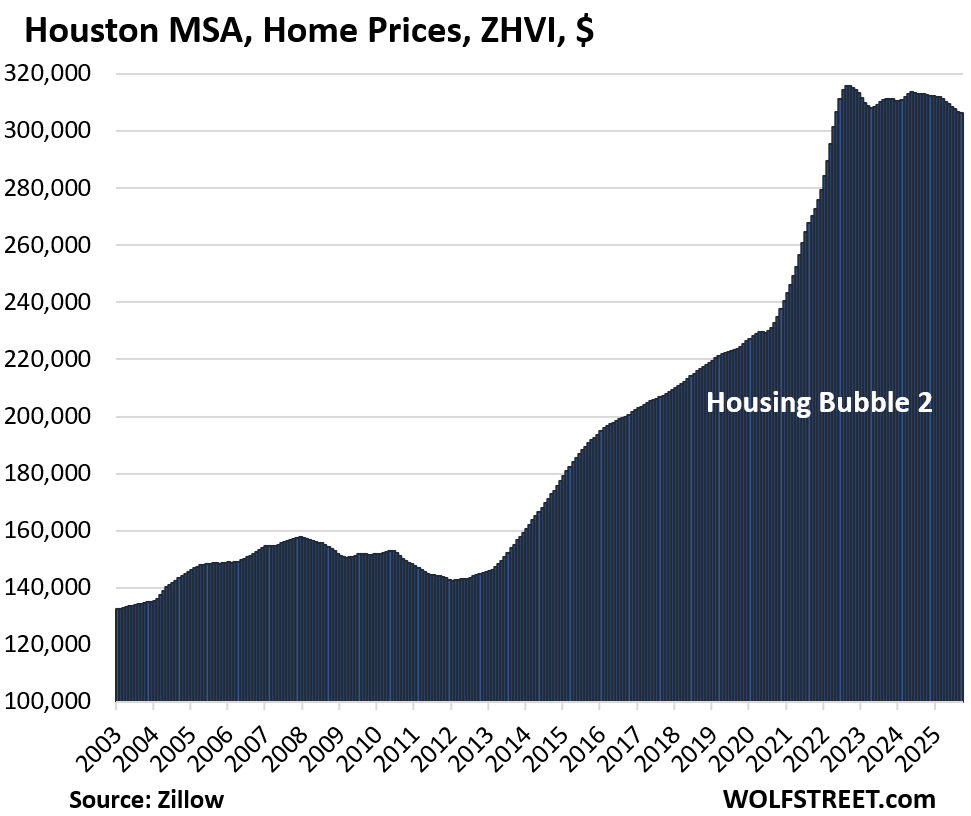
- Houston, TX: -2.1%
- San Jose, CA: -2.1%
- Honolulu, HI: -1.8%
- Portland, OR: -0.9%
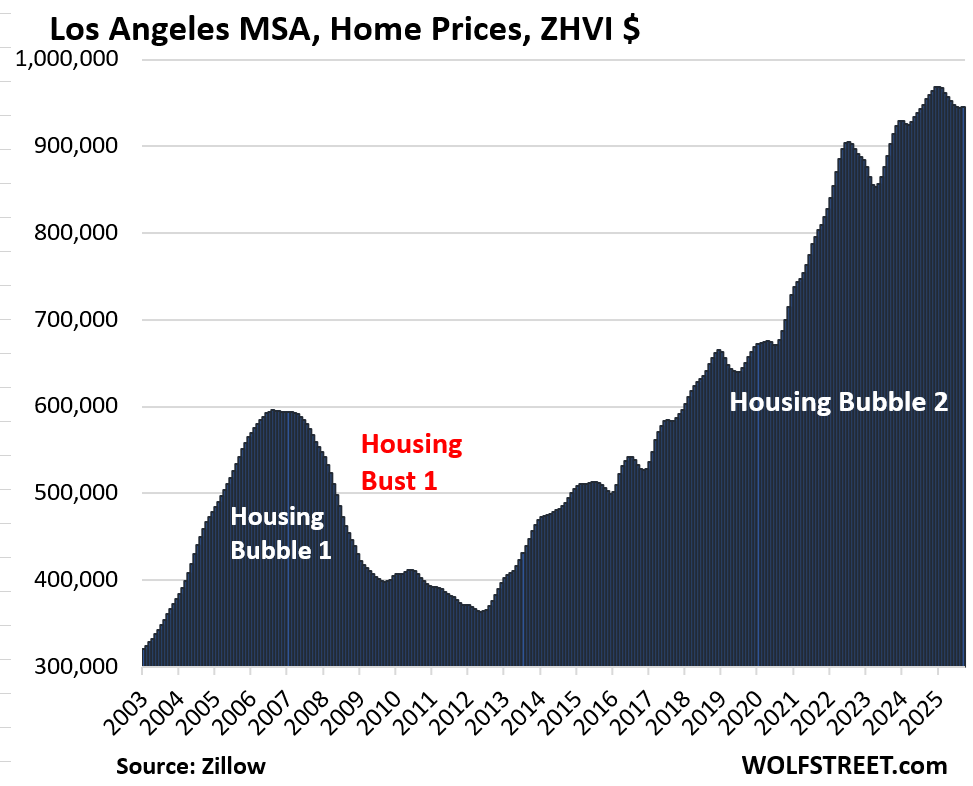
- Los Angeles, CA: -0.9%
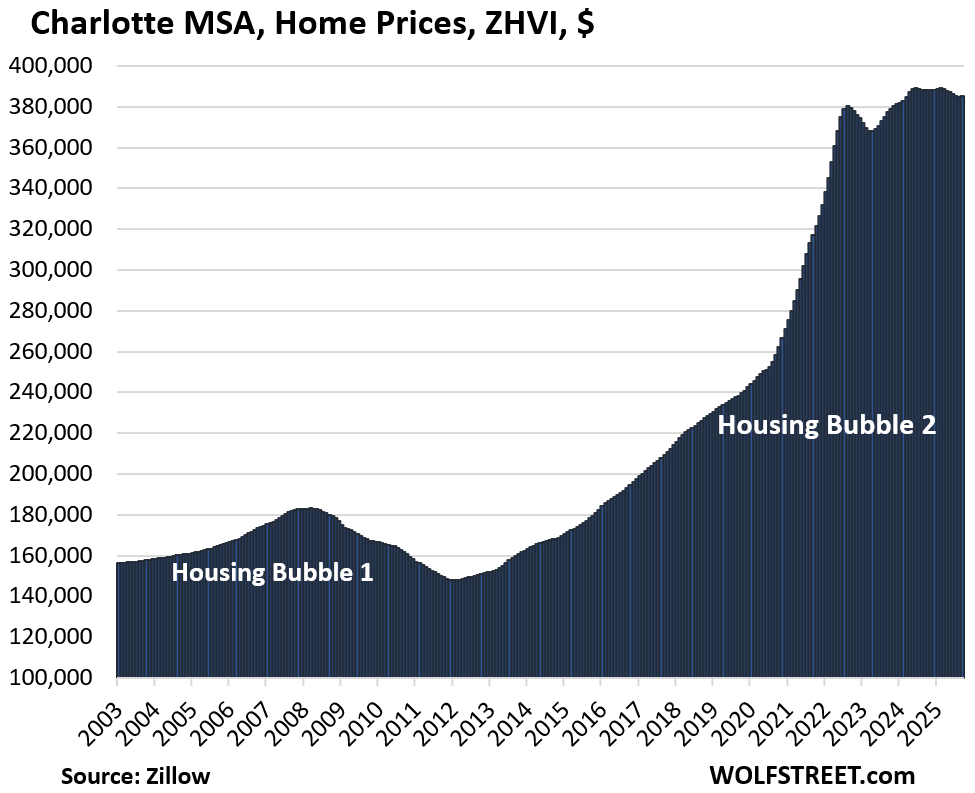
- Charlotte, NC: -0.8%
- Seattle, WA: -0.8%
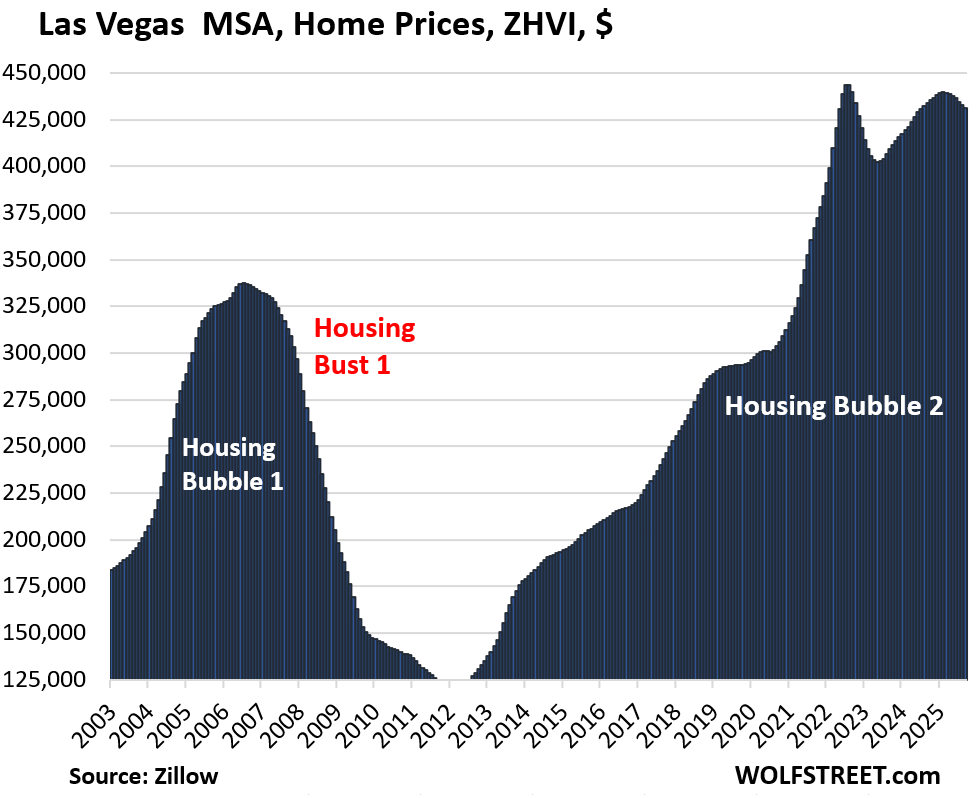
- Las Vegas, NV: -0.6%
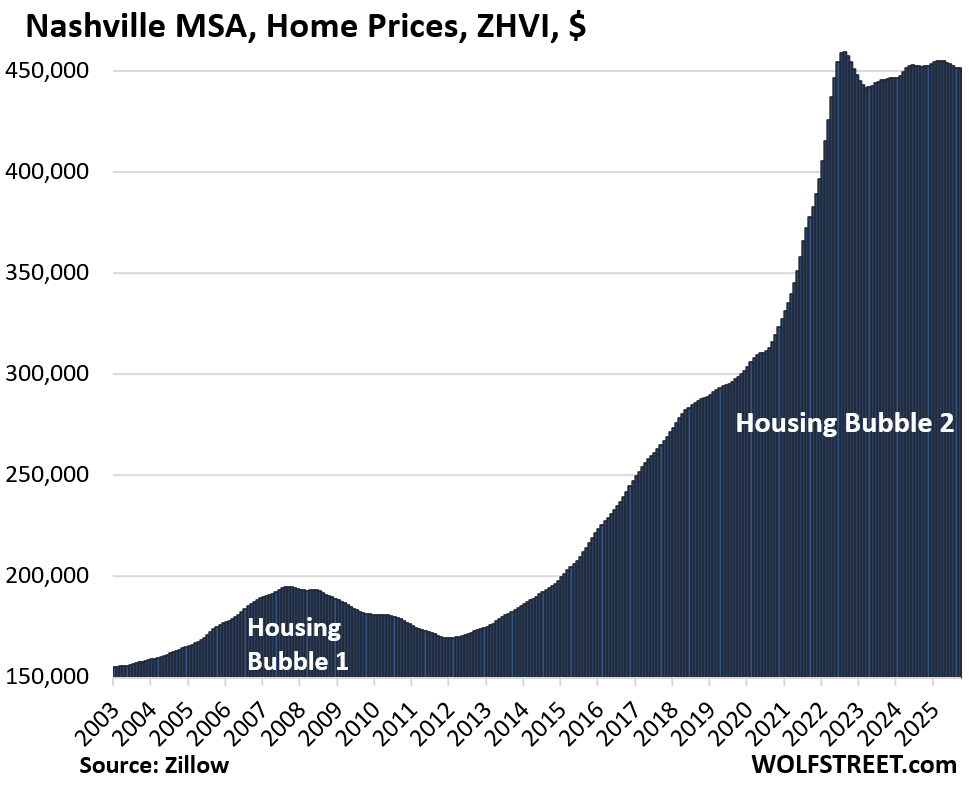
- Nashville, TN: -0.1%
Prices were down from their highs in prior years in 23 of the 33 metros.
The peaks of 17 metros were in 2022; Atlanta’s was in 2023, and the peaks of 5 (Miami, San Diego, Charlotte, San Jose, Los Angeles) were in 2024:
Percentage declines from their respective highs in prior years:
- Austin, TX: -23.4%
- San Francisco: -10.9%
- Phoenix: -10.3%
- San Antonio: -8.5%
- Denver: -7.2%
- Sacramento: -7.3%
- Tampa: -7.2%
- Dallas: -6.7%
- Honolulu: -5.3%
- Portland: -4.9%
- Orlando: -4.8%
- Miami: -4.7% (2024 peak)
- San Jose: -4.5% (2024 peak)
- Seattle: -4.0%
- Raleigh: -3.6%
- Atlanta: -3.2% (2023 peak)
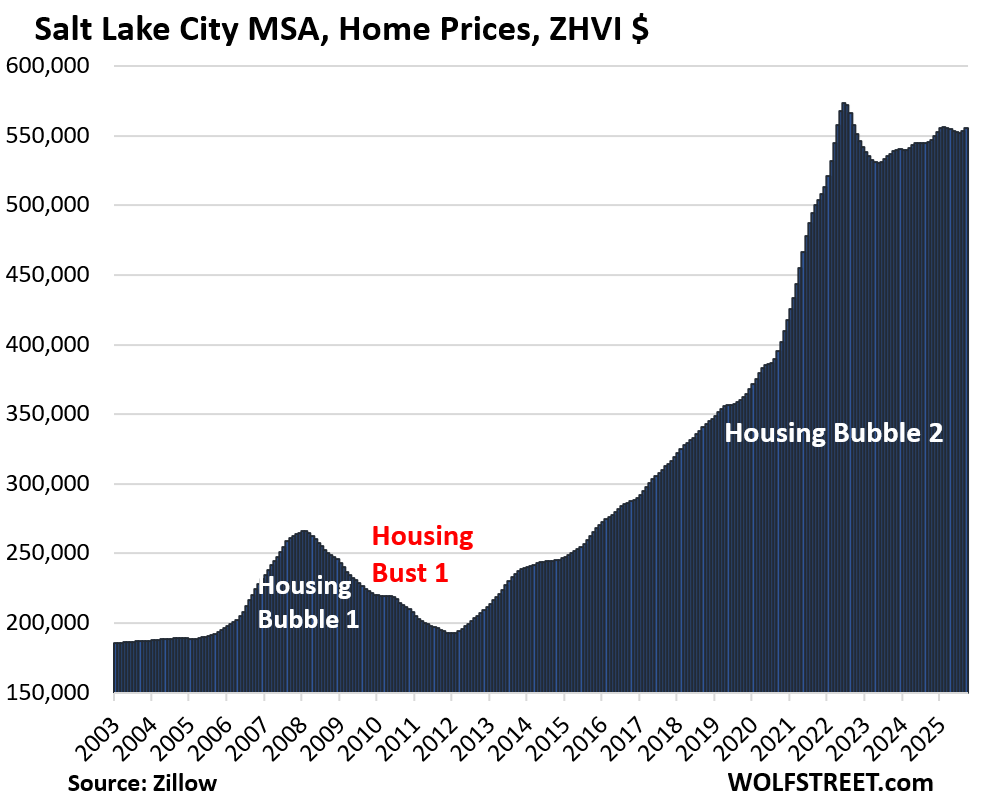
- Salt Lake City: -3.1%
- Houston: -3.0%
- San Diego: -2.8% (2024 peak)
- Las Vegas: -2.8%
- Los Angeles: -2.5% (2024 peak)
- Nashville: -1.7%
- Charlotte: -1.0% (2024 peak)
Homebuilders have been taking share away from homeowners trying to sell; they have been building at a solid pace, and their inventories surged, and they have pushed sales by offering deals. For example, Lennar cut its average selling price by 22% from the peak in Q3 2022, bringing it back to 2019 levels. This price competition from homebuilders against homeowners trying to sell is particularly strong in the South and West.
Methodology: All pricing data here for the 33 metropolitan statistical areas (MSA) is from the seasonally adjusted three-month-average mid-tier Zillow Home Value Index (ZHVI), released today. The ZHVI is based on millions of data points in Zillow’s “Database of All Homes,” including from public records (tax data), MLS, brokerages, local Realtor Associations, real-estate agents, and households across the US. It includes pricing data for off-market deals and for-sale-by-owner deals. Zillow’s Database of All Homes also has sales-pairs data.
To qualify for this list of 33 most splendid housing bubbles, the MSA must be one of the largest by population and must have had a ZHVI of at least $300,000 at some point. Some metros that are large enough don’t qualify for this list because their ZHVI has never reached $300,000, despite the blistering surge of home prices in recent years, such as the metros of New Orleans, Memphis, Oklahoma City, Tulsa, Cincinnati, and Pittsburgh.
The 33 Most Splendid Housing Bubbles.
In the little tables, MoM = month over month; YoY = year-over-year. In the column furthest to the right: the percentage increase “since 2000.”
| Austin MSA, Home Prices | |||
| From Jun 2022 peak | MoM | YoY | Since 2000 |
| -23.4% | -0.3% | -5.9% | 148% |
The lowest since May 2021.
Prices in the Austin-Round Rock-San Marcos MSA had exploded by 73% from January 2020 through June 2022, illustrating the absurdity that housing markets had turned into under the Fed’s reckless free-money monetary policy until 2022. When money is free, prices don’t matter. And this is what happened, but it’s now getting unwound:
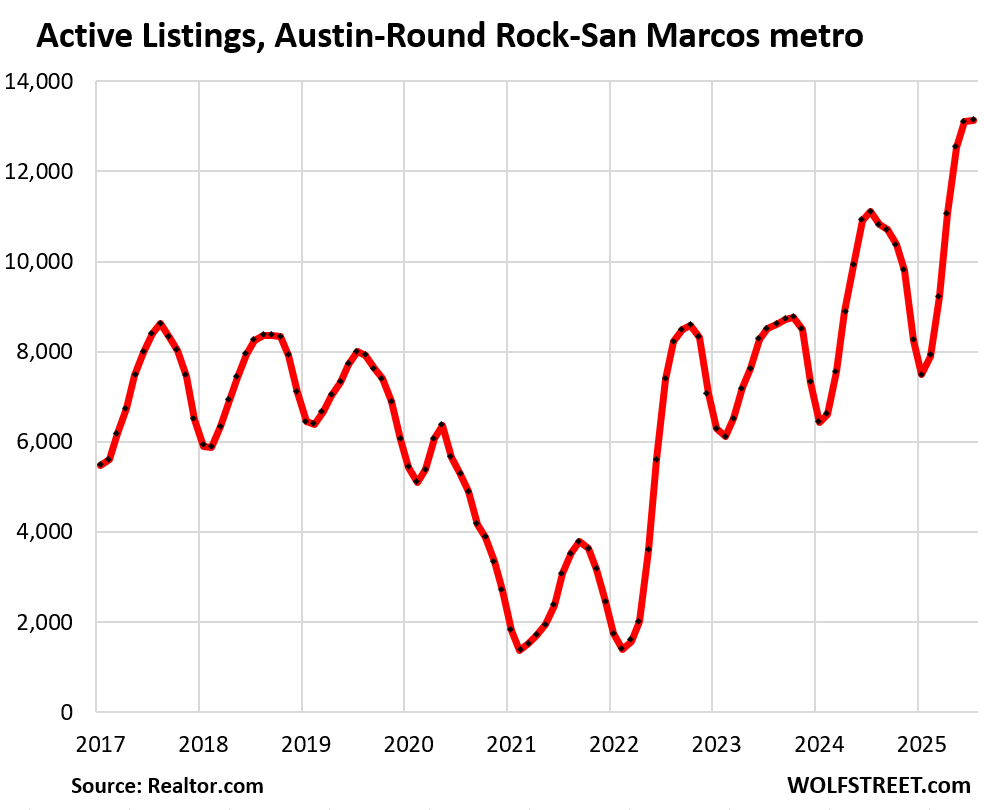
Here is what active listings in Texas look like (data from Realtor.com).
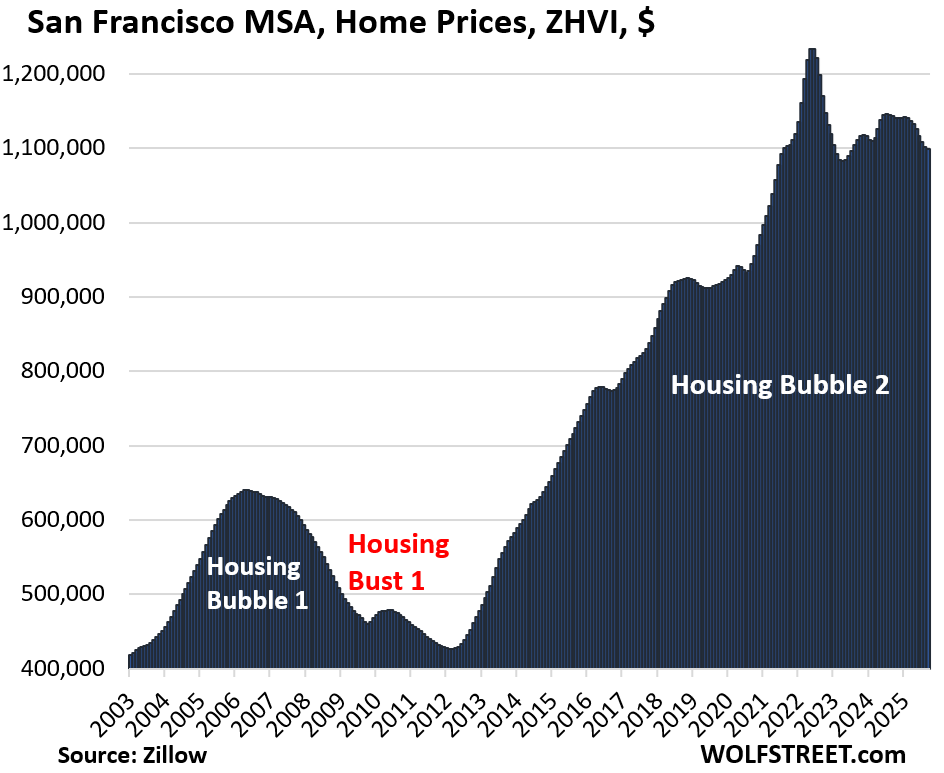
| San Francisco MSA, Home Prices | |||
| From May 2022 peak | MoM | YoY | Since 2000 |
| -10.9% | -0.2% | -3.8% | 282% |
Back to August 2021. From January 2020 through June 2022, prices exploded by 33%.
The San Francisco-Oakland-Fremont metro includes San Francisco, much of the East Bay (such as Oakland), much of the North Bay, and goes south on the Peninsula into Silicon Valley through San Mateo County. It does not include the San Jose metro, which covers the southern portion of the Bay Area (see below).
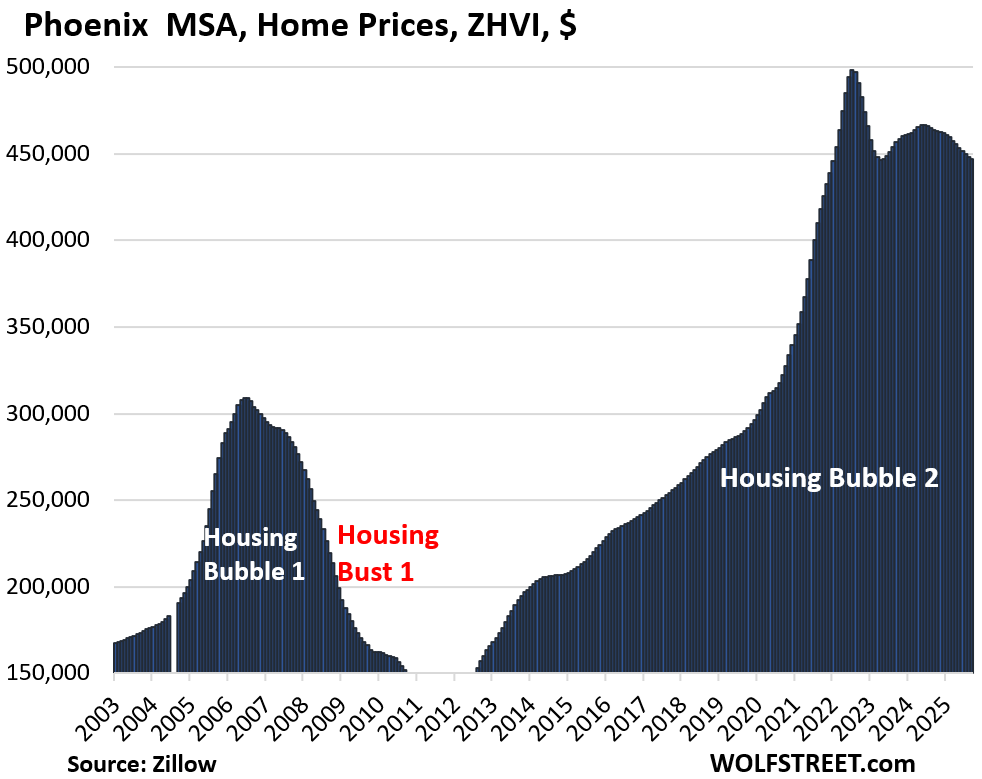
| Phoenix MSA, Home Prices | |||
| From Jun 2022 peak | MoM | YoY | Since 2000 |
| -10.3% | -0.2% | -3.6% | 211% |
Back to January 2022. Prices exploded by 65% from January 2020 through June 2022.
| San Antonio MSA, Home Prices | |||
| From Jul 2022 peak | MoM | YoY | Since 2000 |
| -8.5% | -0.1% | -3.1% | 144% |
| Denver MSA, Home Prices | |||
| From Jun 2022 peak | MoM | YoY | Since 2000 |
| -7.2% | 0.0% | -2.9% | 203% |
| Sacramento MSA, Home Prices | |||
| From July 2022 peak | MoM | YoY | Since 2000 |
| -7.3% | -0.2% | -2.2% | 239.2% |
| Tampa MSA, Home Prices | |||
| From Jul 2022 peak | MoM | YoY | Since 2000 |
| -7.2% | -0.5% | -6.3% | 254% |
Prices exploded by 60% between January 2020 and June 2022.
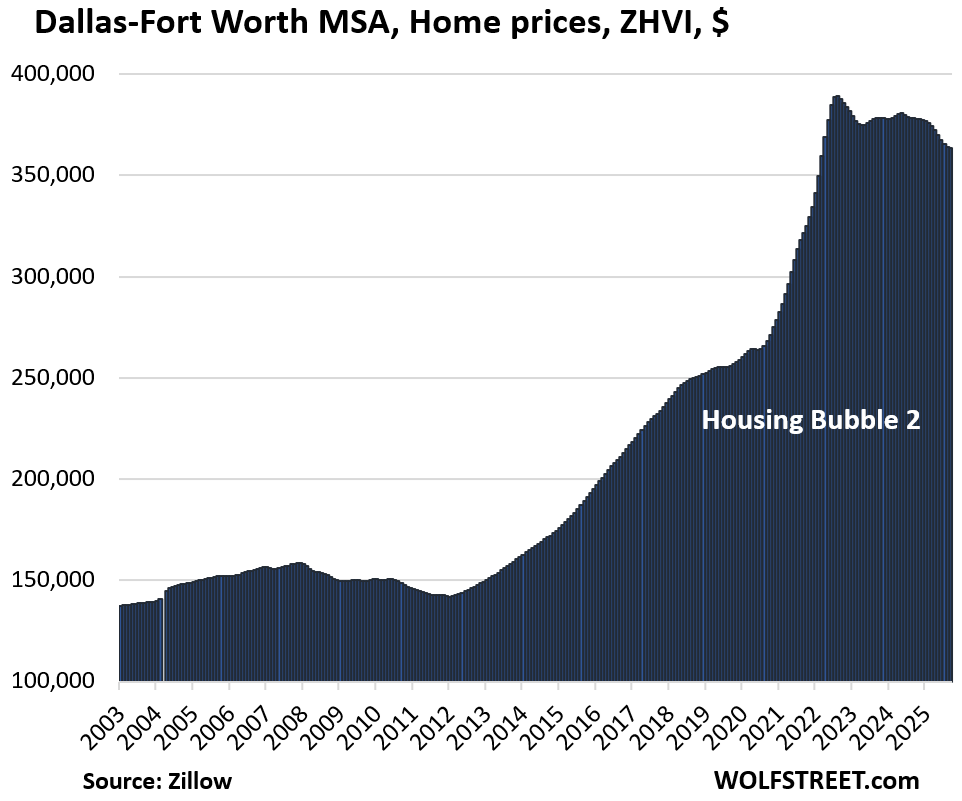
| Dallas-Fort Worth MSA, Home Prices | |||
| From Jun 2022 peak | MoM | YoY | Since 2000 |
| -6.7% | -0.2% | -3.9% | 184% |
| Honolulu, Home Prices | |||
| From Jun 2022 peak | MoM | YoY | Since 2000 |
| -5.3% | 0.1% | -1.8% | 275% |

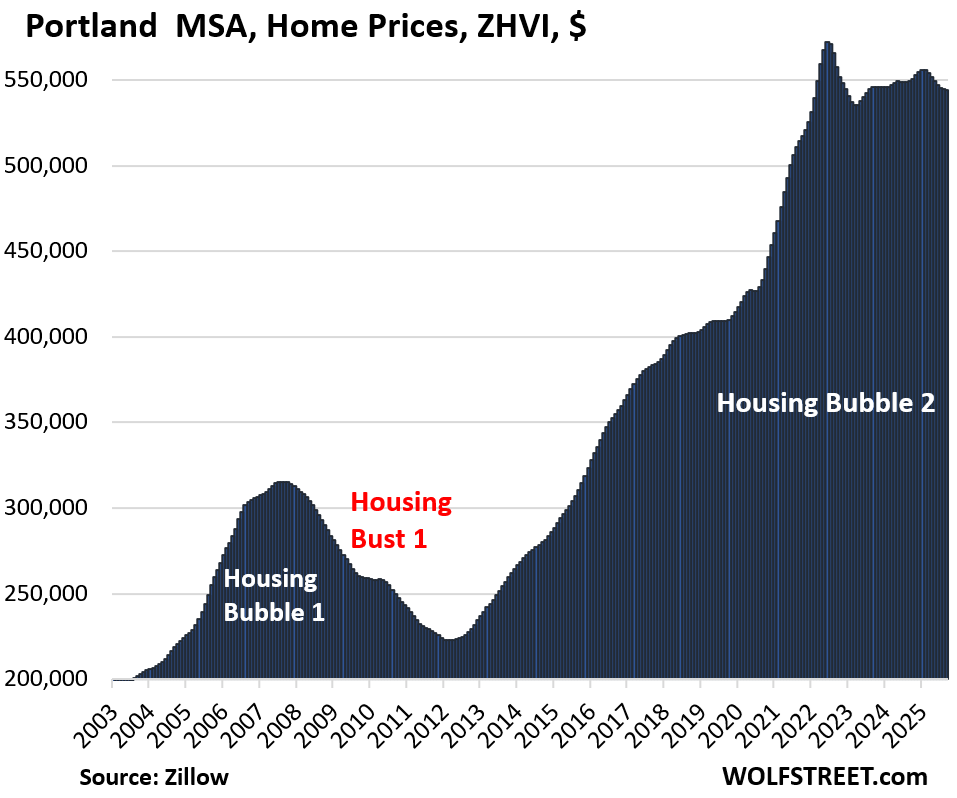
| Portland MSA, Home Prices | |||
| From May 2022 peak | MoM | YoY | Since 2000 |
| -4.9% | 0.0% | -0.9% | 212% |
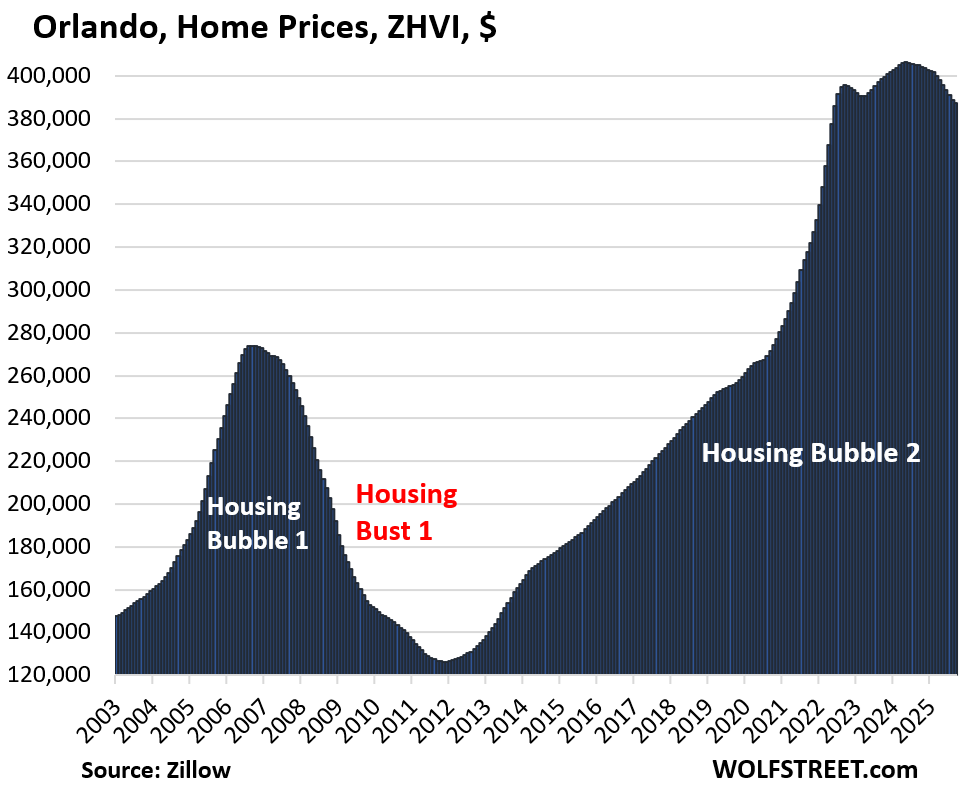
| Orlando MSA, Home Prices | |||
| From June 2022 | MoM | YoY | Since 2000 |
| -4.8% | -0.4% | -4.4% | 224% |
Prices exploded by 48% between January 2020 and June 2022.
| Miami MSA, Home Prices | |||
| From Sep 2024 peak | MoM | YoY | Since 2000 |
| -4.7% | -0.4% | -4.7% | 313% |

| San Jose MSA, Home Prices | |||
| Fr Dec 2024 high | MoM | YoY | Since 2000 |
| -4.5% | 0.3% | -2.1% | 328% |

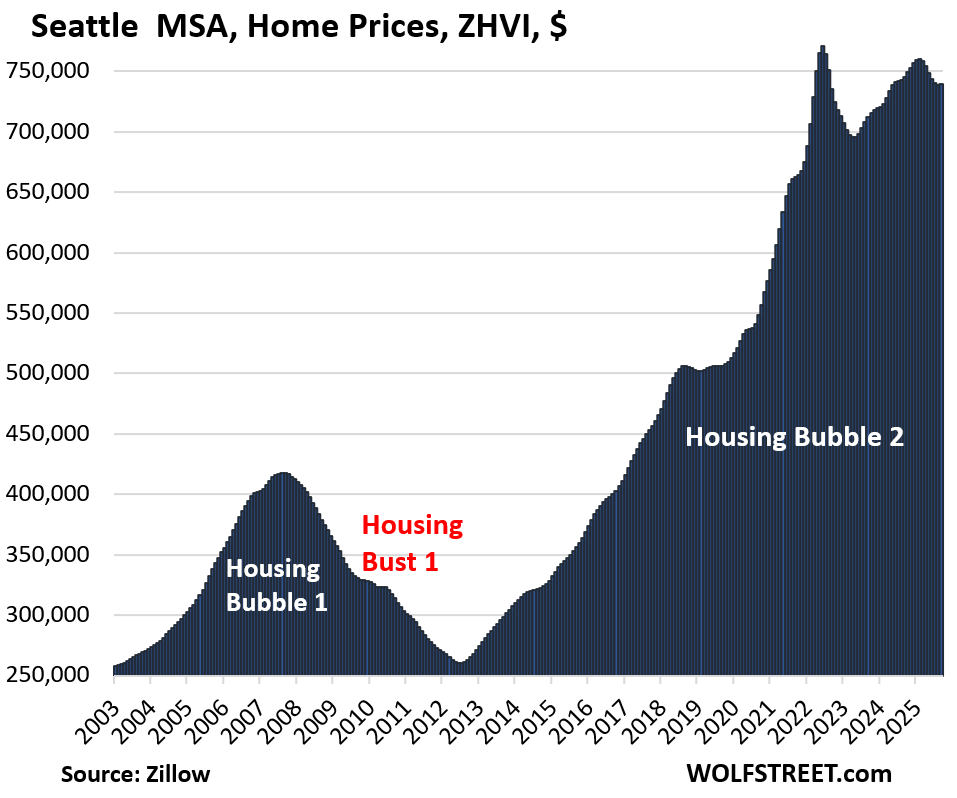
| Seattle MSA, Home Prices | |||
| From May 2022 peak | MoM | YoY | Since 2000 |
| -4.0% | 0.1% | -0.8% | 232% |
| Raleigh MSA, Home Prices | |||
| From July 2022 peak | MoM | YoY | Since 2000 |
| -3.6% | -0.2% | -2.3% | 152% |
| Atlanta MSA, Home Prices | |||
| From July 2022 | MoM | YoY | Since 2000 |
| -3.2% | -0.1% | -3.1% | 156% |
Prices exploded 51% between January 2020 and June 2022.

| Salt Lake City MSA, Home Prices | |||
| From July 2022 peak | MoM | YoY | Since 2000 |
| -3.1% | 0.4% | 1.9% | 217% |
| Houston MSA, Home Prices | |||
| From Jul 2022 peak | MoM | YoY | Since 2000 |
| -3.0% | -0.2% | -2.1% | 147% |
| San Diego MSA, Home Prices | |||
| Fr Jul 2024 peak | MoM | YoY | Since 2000 |
| -2.8% | -0.2% | -2.7% | 327% |
| Las Vegas MSA, Home Prices | |||
| From June 2022 peak | MoM | YoY | Since 2000 |
| -2.8% | -0.3% | -0.6% | 178% |
| Los Angeles MSA, Home Prices | |||
| Fr Dec 2024 high | MoM | YoY | Since 2000 |
| -2.4% | 0.1% | -0.9% | 325% |
| Nashville MSA, Home Prices | |||
| From July 2022 peak | MoM | YoY | Since 2000 |
| -1.7% | 0.0% | -0.1% | 215% |
| Charlotte MSA, Home Prices | |||
| Fr May 2024 peak | MoM | YoY | Since 2000 |
| -1.0% | 0.0% | -0.8% | 166% |
Prices exploded by 54% between January 2020 and June 2022.
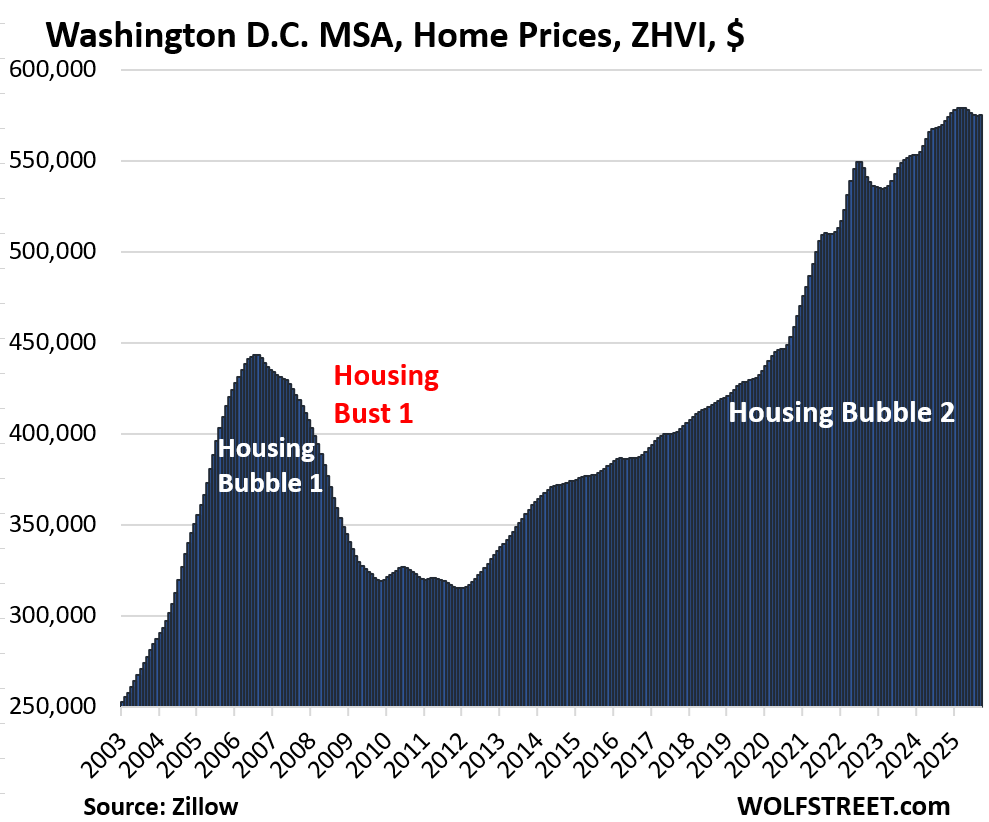
| Washington D.C. MSA, Home Prices | ||
| MoM | YoY | Since 2000 |
| 0.0% | 0.9% | 216% |
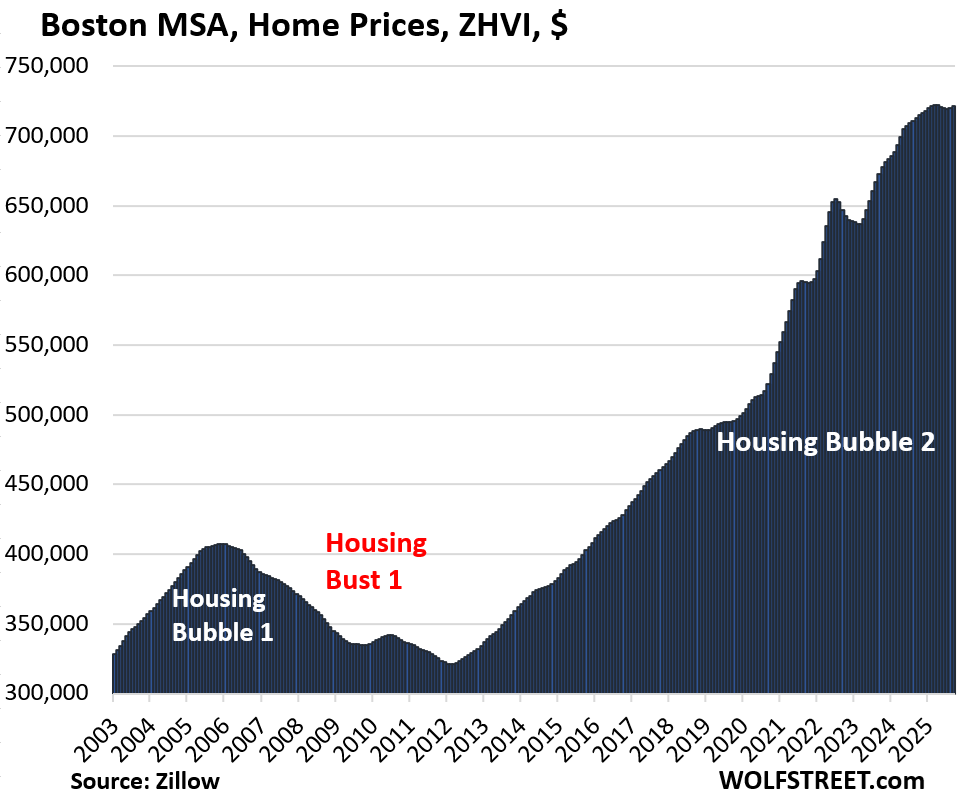
| Boston MSA, Home Prices | ||
| MoM | YoY | Since 2000 |
| 0.2% | 1.1% | 226% |
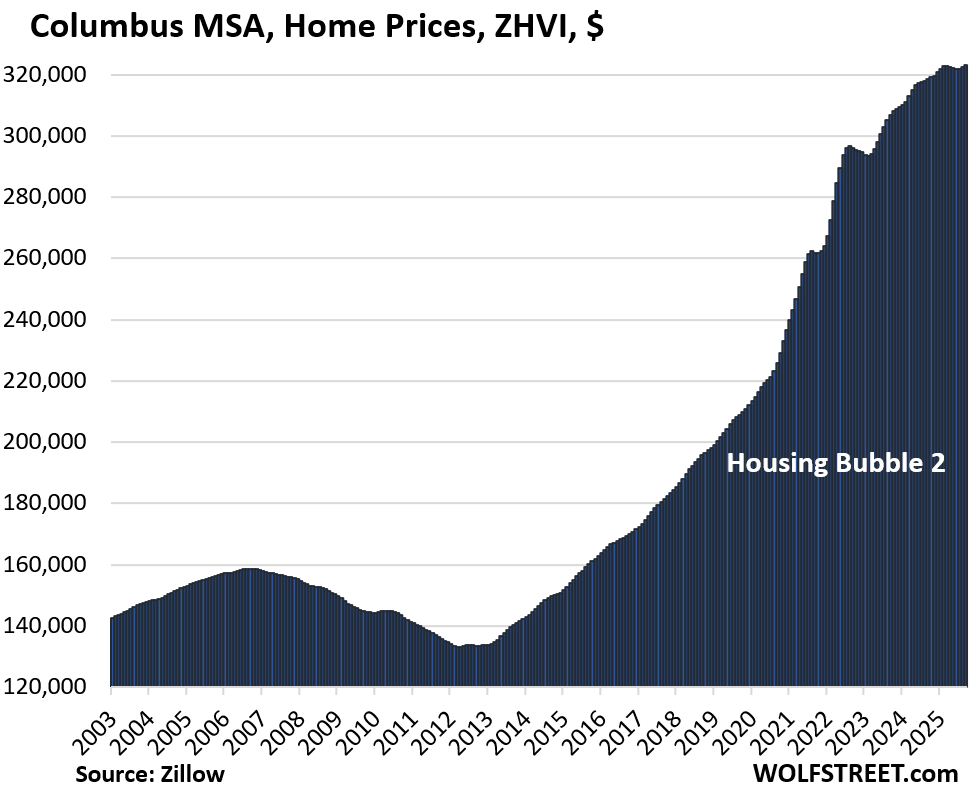
| Columbus MSA, Home Prices | ||
| MoM | YoY | Since 2000 |
| 0.2% | 1.4% | 155% |
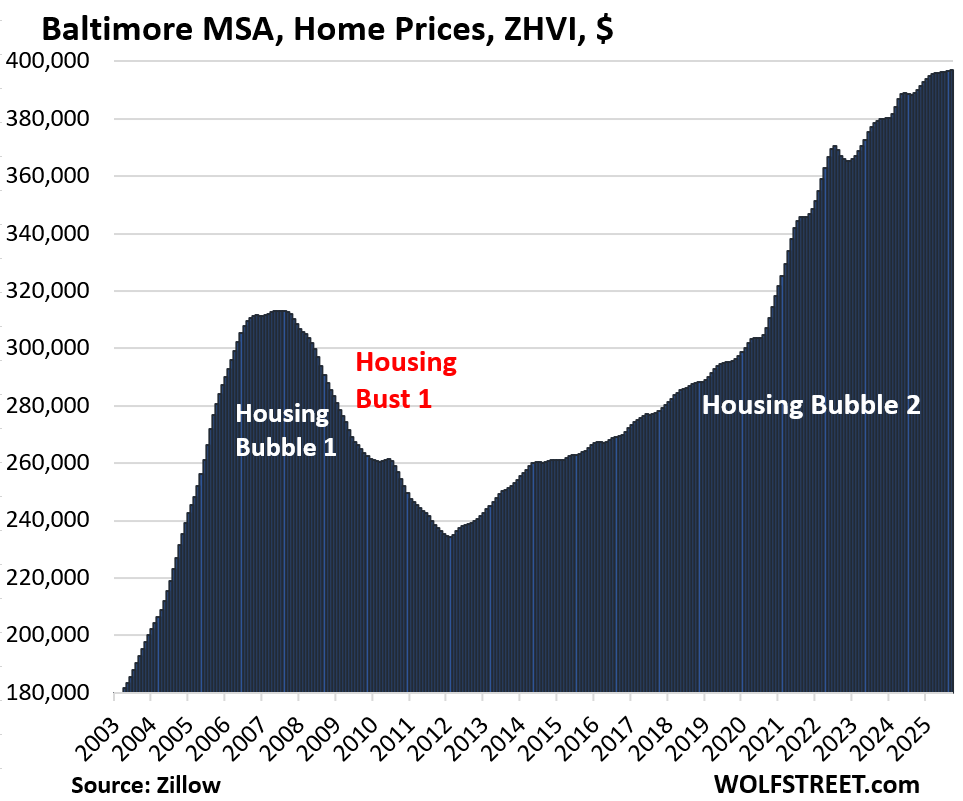
| Baltimore MSA, Home Prices | |||
| MoM | YoY | Since 2000 | |
| 0.1% | 2.1% | 177% | |
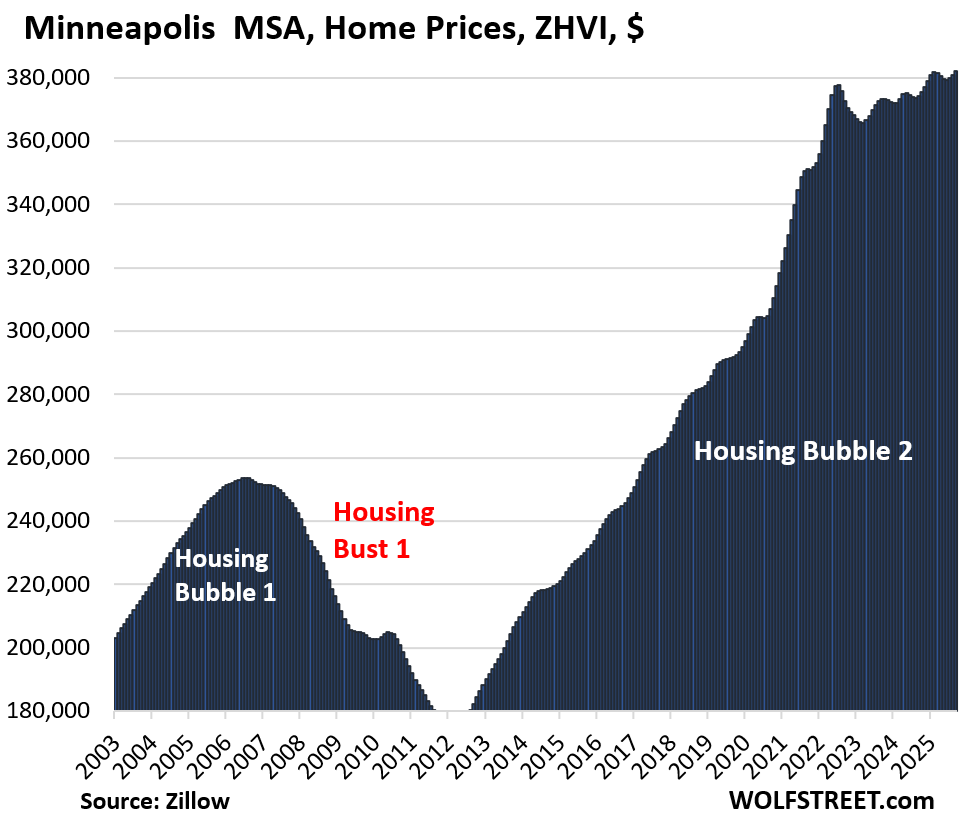
| Minneapolis MSA, Home Prices | ||
| MoM | YoY | Since 2000 |
| 0.3% | 2.1% | 160% |
| Kansas City MSA, Home Prices | ||
| MoM | YoY | Since 2000 |
| 0.5% | 2.5% | 180% |

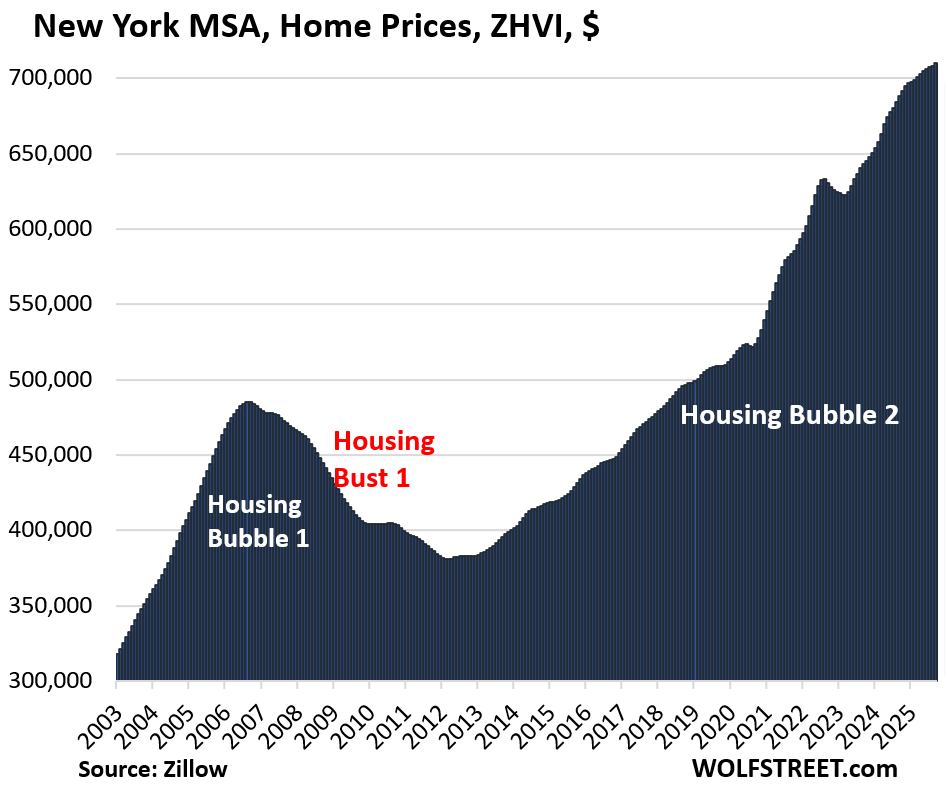
| New York MSA, Home Prices | ||
| MoM | YoY | Since 2000 |
| 0.2% | 3.1% | 220% |
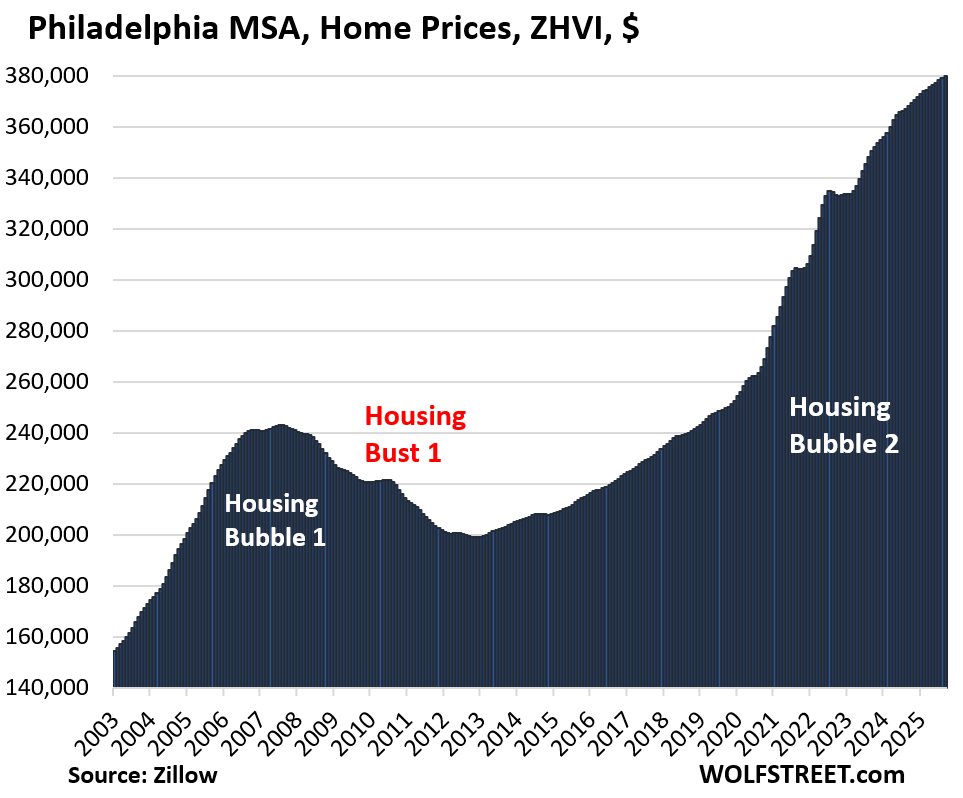
| Philadelphia MSA, Home Prices | ||
| MoM | YoY | Since 2000 |
| 0.2% | 3.2% | 209% |
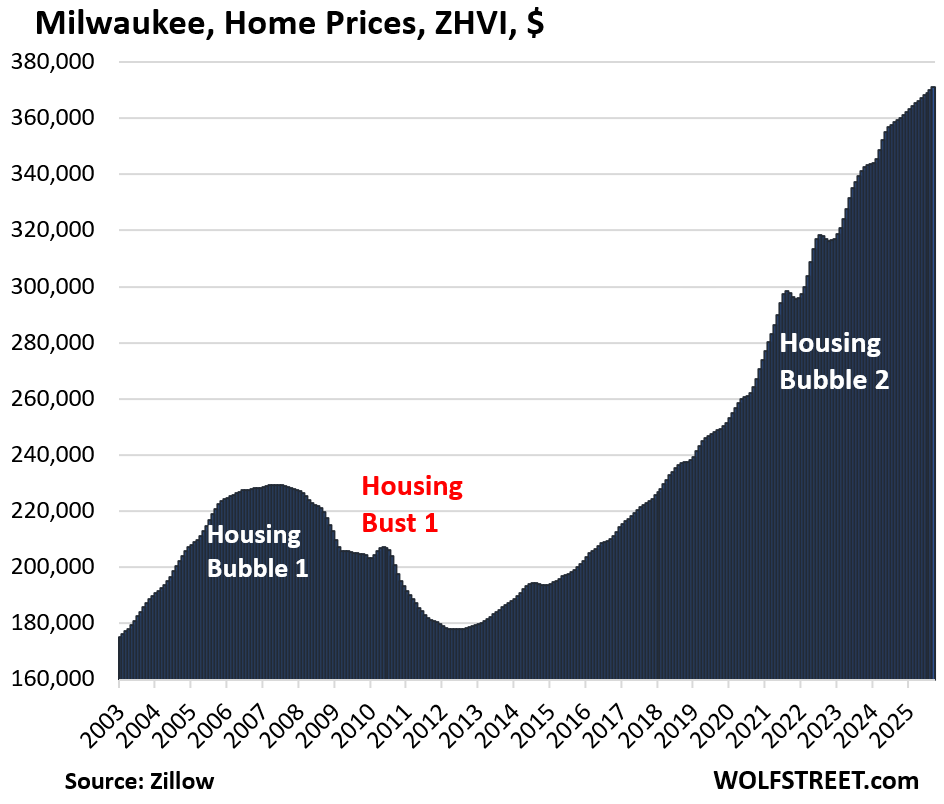
| Milwaukee MSA, Home Prices | ||
| MoM | YoY | Since 2000 |
| 0.4% | 3.4% | 151.6% |
| Chicago MSA, Home Prices | ||
| MoM | YoY | Since 2000 |
| 0.4% | 3.5% | 119% |
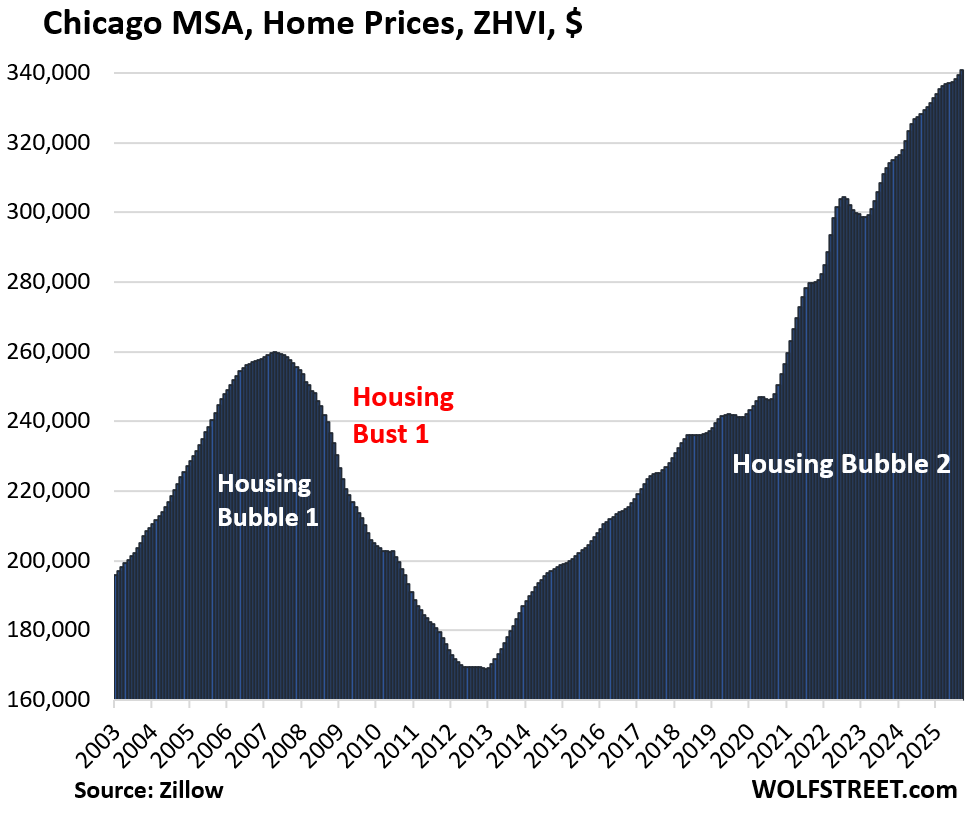
And inventory in the Chicago-Naperville-Elgin, IL-IN metro:

Enjoy reading WOLF STREET and want to support it? You can donate. I appreciate it immensely. Click on the mug to find out how:

![]()
Most of the declines are way too small to approach affordability.
Those declines are not declines compared to long term trends.
You people have been spoiled rotten by cryptos that can collapse overnight. Housing doesn’t do that (but office CRE got close). The last housing bust took 4-6 years, depending on market. Tulsa was in a housing bust for something like 20 years.
Oh no, Wolfman – there is something VERY DIFFERENT about this current housing bubble. SOMETHING is keeping this Franken monster on life support. The pace of the price deflation has been way too slow. Somone has interest in keeping this Franken monster alive.
And yes, after baking a loaf of bread the size of Godzilla, giving back a few crumbs (of price decline) is inconsequential.
If prices decline 3% a year for six years and wages go up 4% a year for six years, you’re there.
“wages go up 4% a year for six years”
If we extrapolate that to 4% yoy of general inflation, I wonder what kind of mtg rates we’d see.
With wages rising 4% in normal times, inflation would run just below that, about 3% maybe (we’re there), and mortgage rates would be somewhere in the 6-8% range, same as now.
Regardless, the data clearly shows that some combination of prices falling and/or wages increasing must continue, potentially for a long time (6-10 years, at a minimum).
Hedge accordingly.
While I agree with you Wolf, the housing market does seem to be off any kind of norm for a while now. I mean when was it in history that we had +20-50% in home prices in a matter of 2-3 years? Did we experience this kind of insane shoot to the moon run up back in 2008?
I think in general besides Austin -20%, which IMHO is definitely a good sign to see, plenty are disappointed to see SD, LA, Charlotte..etc barely budged. Crossing my fingers this is the last holdout and eventually they will get to Austin’s level if not worst. Good sign to see is SF, once perceived as invincible market by West Coast house humpers are now seeing double digit drop, if they serve as indicator as well for SoCal, then I am happy.
Well, since 2020 cumulative inflation has been 24.8% (according to Bureau of Labor). Take that off the top of these graphs to guesstimate “real” housing prices. I don’t have the wage info at hand to understand affordability – but if wages increased anywhere near 25% since 2020, there ya go.
Greg P
But home prices exploded by more than double that in the US overall in the two years between 2020-2022, and by triple that in a bunch of markets.
I suppose if you buy a house to live in and are not looking to sell….
Price does not matter.
It is all just imaginary, unrealized numbers until you buy or sell.
I know people who claim they made $$ in stocks, crypto, real-estate.
Did you sell??
No ?
Then you did not make anything.
One sentiment among buyers who still buy @ this record high price level is the concern over 💸 depreciation. Somehow housing a real property is seen a hedge against the fear that 💸 will become worthless. The perceived “race” between 💸 depreciation & housing price coming back to “normal” (aka affordable based on disposable income) is what might have taken buyers out of “buyer strike” camp. Limited inventory is another reason why price remains @ this level. In 🍊 CA, buyers like me & my friends are waiting yet there have been so many times we wonder what if for the next 10 years, on supply side it will be like this, are we gonna end up giving up 🇺🇸 dreams because price will sustain @ this level & just not coming down to 2019 level 🧐 I think the sentiment toward 💸 reserve status & how much it has lost its value in the last 25 years might be the reason why buyer strike is not @ large scale. Just a thought to share.
I think I might just run a experiment just to see, if I buy one share of BRK-A now and look at a similar value house in SoCal now, come back in 10 yrs, let’s see who will have a better return overall…
Not that true housing zealots will ever shut up about their house is some never ending appreciation machine better than anything in the market but interesting experiement nonetheless
Chicago metro with Cook, Will, DuPage, Lake (IL), Kane and McHenry Counties are going to include people moving a few miles within the area, a time-honored tradition. Chicago west and far south sides would have some houses worth next to nothing, but never changing hands. Wonder if Lake County Indiana, just across from Chicago far south side and southeast suburbs is included(?)
So today a Midwest real estate agent who has been around for several years told me that many of the agents are going to AI chat gpt to come up with the description verbiage.
Sheesh.
Yes, Lake County, Indiana, is included.
The Chicago MSA includes these 13 counties: Cook, DuPage, Grundy, McHenry, Will, DeKalb, Kane, Kendall, Lake (IL), Jasper, Newton, Lake (IN), and Porter.
My Brother In Law bought a little cottage on a lake in NW Indiana for $120k back in 2021, did a little work on it and sold it last month for $360k. This cottage is in the middle of NOWHERE. I don’t quite understand.
What’s “a little work?”
It is good to see deflation somewhere!
It is a disappointment though that the decrease in price of what is the second most essential human need is often not as a positive circumstance.
… I say this while back in my current country of residence there remains no sign of house price deflation on the horizon. (To the detriment of around 35% of the population, but cheered on by the 65% who own their own home.)
Is it food or water that comes in third place?
I feel like oxygen should also rank pretty highly…
But not too much, or else!!!
In no particular order the bottom rung of Maslow’s hierarchy of Needs includes:
Air, Water, Food, Shelter (e.g. housing protection from exposure), Clothing, Sleep, Reproduction.
Hope this helps.
This upcoming housing bubble bust will make the last one look like child’s play. That’s not just hyperbole. It will be one for the history books. Those graphs don’t just show a current bubble – they show a Housing Mount Everest. Sadly, many daring and adventurous people die on Everest. This current Housing Mount Everest will also claim many victims.
One of the strangest housing statistics is median age of buyers, which is now age 56.
Sadly, it fits with what I’ve been seeing on the ground. I see retired folks actually expanding their RE holdings, not downsizing as might be expected. I guess several million in stock gains can change a person’s mindset.
People often ask – who is buying in this inflated market? With median age of 56, I think it’s largely the well-to-do who aren’t so concerned about price because they are sourcing funds from inflated stock holdings.
That’s not what this statistic says at all. The boomers and prior generation are selling their homes and are buying other homes to downsize, move closer to relatives, etc., and given the size of this population group, it pushes up the median age amid depressed overall sales (median is skewed by changes in the mix).
Not seeing that on the ground, and I am a younger Boomer.
I don’t know anybody over 75 who went out and bought a smaller house to downsize, but I have seen lots of folks over 75 who sell out and enter rental arrangements including assisted living, particularly when one spouse dies. I see lots of others try to stay in their homes until the bitter end, or move in with relatives.
So I question whether older Boomers who downsize have a significant presence in the home buyer statistics. I think the younger Boomers between 55 and 70 are more represented. Most of them are near retirement or recently retired, and the lucky ones are looking to spend the wealth our monetary and fiscal authorities dropped on their lap.
Downsizing after spouse passes away is a reason, and one of our commenters here, Anthony A., did that and told us about it. I know people over 75 who went from a fairly big house with stairs and an upstairs deck to a 2-BR co-op with view on the 8th floor (no stairs!). I know a couple who sold, moved, and bought to be closer to their kids, to get busy as grandparents. Downsizing and thereby ending up with cash is a reason for people on fixed income. Getting rid of stairs is another reason. A smaller home is easier to take care of, another reason. Being close to family is a reason. There are lots of reasons to do this. Lots of elderly people do it.
Age 45-60 is Generation X!
What’s the median age for first time buyers? That’s the more relevant statistic
Noticing that 22 metros saw YoY price drops is striking—does this reflect a broader market correction?
Thanks for this update Wolf. The graphs continue to reinforce a previous point. Despite the moderate price decreases, residential RE prices are not good. They are only less bad. And less bad is still bad. I still think purchasing at current prices continues to carry a relatively high degree of buyer risk.
Perhaps they should include scuba diving gear with each home purchase. Some buyers will need it.
And, as I’ve stated before, please spare me the “it depends on how long you plan to live there” routine. That point ignores another risk in buying residential RE: a forced sale. Thousands of people sell their homes each year not because they want to, but because they have to. This is for various reasons – job loss, job transfer, illness, death in the family, divorce, etc. And some of those forced sellers will be forced to eat a (possibly substantial) loss.
Here in southwest Ohio, I’m convinced one other predatory pricing practice (say that three times fast) is taking place. I call it the “sucker fishing” listing, and it is done by sellers who don’t have to sell. But they’ll consider selling at a certain price. I believe some sellers are saying to their agents “we’ll list at this price and I won’t consider any offer under X.”
That is not a new practice, but the difference this time is X is a highly inflated price – much more so than in a typical RE market in the past. This time, X is a mid-2022 price despite the market changes that have taken place since that peak period.
In a normal market, an agent would balk at that seller condition. They know damn well the house will not sell at X. But some of those listings are accepted now due to agent desperation. Good listings are hard to come by. And the agent knows/hopes the seller might change their mind.
I believe that is happening due to the number of new listings that have what I call “fund my lavish retirement” prices. I continue to compare many of the new listing prices to the original price paid by the seller (available on the local county auditor’s website.) Even after adjusting for inflation, many of the new listing asking prices are ridiculous.
Overall, this market continues to be crap for the buyer. Low inventory and very little value. I’m retaining my buyer’s strike for now.
Back in the late 1990s, Jack in the Box ran a commercial where Jack was attending a fast food trade show. Everyone else had an elaborate booth, except for one guy who had spread out a tarp and was sitting on a lawn chair.
Jack: what’s your deal?
Lawn Chair Guy: I taste people’s nuggets and tell them whether I like them.
Jack: How much do you charge?
LCG: $25,000.
Jack: Any takers?
LCG: I only need one
A time honored tradition.
I get what you are saying. Back in the olden days a seller of a house or small apartment building would place a by-owner ad in the local paper. Now perhaps use a $500 – $1000 flat fee broker to get on MLS. I think a regular real estate agent would drive me nuts as a seller if I was just fishing.
I think there’s a lot of that. I’ve spoken to agents who won’t take listings if the sellers are stuck on their aspirational mid-2022 price, but plenty will.
It’d be nice if there was a way to know from a listing if a seller is a “I don’t really have to sell, but if someone is dumb enough to pay me mid-2022 pricing, that is double what I paid in 2019, I will sell” or a “I actually want to sell and will sell at whatever today’s market price is.”
Often you can tell from the amount and speed of price decreases, but not always.
Even considering it’s semi-uniqueness, 633 S. Castell, New Braunfels, TX seems to be one of those pretty overpriced houses trying to catch a deep pocket price careless buyer.
I live in both N.H. but but still to a degree work outside of the Boston area(30 miles).
One change I have noticed is a lot more for sale sign last two months,so far,about a third with pending on them fairly quickly.
I am keeping a eye out to see if this continues in a upward basis,get the feeling some folks are starting to think even in this region they want to get out with substantial monies now is the time.
I imagine NH prop tax increases caught some folks off guard. I just settled an appeal I had filed with the NH Board of Tax & Land challenging my town’s assessment increases.
When applying for the mortgage they don’t factor in prop tax & insurance increases when calculating your monthly payment.
“The statistics indicate a significant decline in the share of 30-year-olds in America with both a family and a home, from 52% in 1950 to just 13% in 2025, reflecting a staggering 75% decline over 75 years. This trend highlights the changing dynamics of family life and the economic challenges faced by young adults today. ” Pew Research Center
The affordability index has obviously deteriorated. The homes of yesteryear were much smaller, and prices were much lower. And we aren’t building as many units per households as we formally had.
https://fred.stlouisfed.org/series/HOUST1FNSA
So, there still seems like there is pent up demand.
Did you miss that part? “This trend highlights the changing dynamics of family life…”
People are choosing to get married later, form families later, choose not to get married at all, choose not to have kids at all, etc. etc. These options are now accepted, but in the 1950s, they were pooh-poohed. In the 1950s, when boomers were born, a woman needed to get married in her 20s, have kids, and stay at home. If she went to college, it was supposed to be to find a good husband…. They’re obviously free to do that today, but there is no longer any societal pressure for them to do that, and if young men and women choose to run their lives differently than in the 1950s, they need different housing options, and that’s exactly what today’s housing market has incorporated. That societal shift that occurred since the 1950s has had enormous implications for all kinds of economic dynamics, including the housing market, such as when people buy, and what they buy, as the article you cited points out.
Affordability has always been an issue, but it’s a huge additional issue now.
It’s more related to incentives:
Main pillars of the VA home loan benefit
No downpayment required
(*Note: Lenders may require downpayments for some borrowers using the VA home loan guaranty, but VA does not require a downpayment)
Competitively low interest rates
Limited closing costs
No need for Private Mortgage Insurance (PMI)
The VA home loan is a lifetime benefit: you can use the guaranty multiple times
Hi Wolf. I believe in the 2009 bust the Miami area saw rents drop significantly as units for sale converted to rentals. Especially in condos. Am I correct and if yes do you see this happening again?
There is a huge amount of new higher-end rental supply coming on the market, so that is putting downward pressure on rents. Some condo-projects could be converted to rentals, but condos are often used as rental anyway (by mom-and-pop investors), so I don’t know if that would change anything in terms of the rental market.
My understanding is that in Miami, it’s easier to sell a new higher-end condo today than a 50-year-old condo with huge special assessments and the Fannie Mae Condo Blacklist hanging over its head. Those condos are dead. The best exit for those condo owners is for a developer to buy out all owners, and then tear down the building and build a new and fancy condo tower. But that process has kind of stalled now too.
Roger
Not all markets are down. My county, Eagle, CO reported the following:
September year over year sales UP 56.4%, medium prices up 27.3%, days on market 61. New home sales are $700,000 more than existing homes for the same size and location.
Medium prices?
LOL, Eagle County has 55,000 souls and as a major ski area is a playground for the rich, and home prices are very high. Maybe, just making up a number here, they had 23 sales in September, up by 56% from 15 sales a year ago, and maybe sales flipflop between 5-40 per month, depending on the weather. And if 8 of those homes are high end that month, they skew the median price much higher.
Per Redfin as of September 30th the median home sale price in Eagle County is 13.9% lower than 2024. That could just mean that cheaper homes are selling this year. Zillow estimates 0.1% home value increase from 2024, end of September. Your numbers are not correct.
And prices are generally off in all the Colorado mountain counties this fall. That’s well documented.
Wolf,
Is there a way to compare rent vs ownership affordability on a national scale or city? When I punch in the numbers for Denver, rent is just dominant right now. If you put the cost difference even in bonds you do better.
As Chicagoan, I would like to know why prices are still not weakening
It’s killing me. I’m tired of renting and finally ready to buy (first time, second time trying after being unlucky out west in 21) and it feels like I’m 2 years late as always. The price change on properties in my neighborhood since even 22 are nauseating, and no one is selling anything. Bidding wars, 1week on market, blah blah blah
James,
I, too, live in the Chicago area (western suburbs).
My guesses as to why no weakening here are:
1) Chicago area did not have the HUGE and FAST run up in prices. It was a slow, gradual increase.
2) At least out here in the western burbs they are building like crazy. For example, parts of Yorktown Mall are being torn down and 6-7-8 floor housing units (Apartment Homes wtf?) are being built. And further West large tracts of land are undergoing the same thing.
3) We also see many single family homes being built in open lots.
… so … maybe … more supply meeting more demand … just a HUGE guess.
Anybody … what is an “Apartment Home”?
That’s the answer, and the same in the NYC metro area. A 20% increase during the COVID craziness made sense based on the general mania and 3% interest rates. The doubling or more of prices you saw in Austin, Miami, Tampa, Nashville, Denver and others was based on remote work and other factors.
The 20% increases in prices were possibly sustainable based on the devaluation of the dollar, so decreases are happening way more slowly. A 100% increase in prices were not, so they’re dropping more rapidly.
The grandchildren of those at 47th and Damen, McKinley Park and St. John Fisher Parrish in the ‘50s – ‘60s are now living in Homer Glen, Lemont, Elburn and St John Indiana. All in same the metro area.
Domestic migration statistics explain it. People are moving from the coasts inland, likely due to cost of living.
When can we expect an update on Canada’s markets?
I kind of gave up on it after Zillow changed when it releases its data. The data of both now come out on the same day most of the time. But I cannot do both on the same day, back to back.
That’s not a permanent decision. So some day I might. But that’s what I did the past few months.
In my neck of the Canadian woods (Ontario Golden Horseshoe) we haven’t had a proper real estate bust since 1989 — and that one lasted for at least 8 years.
We are long overdue.
Are you including GTA? Biggest bust since 90’s and getting worse, especially for ‘dog crate’ condos. 750 sq ft, built for investors to rent.
They have COMPLETELY disappeared, not wanting to sign up for a 500 a month loss, with no prospect of capital gain. Lawyers busy, as folks who signed up on pre- construction deals, either don’t want to close or can’t. The Globe and Mail has had numerous bits on this.
Yes, I meant to include the GTA when I say “Golden Hoseshoe” (which I chose to describe where I live because I am just west of the GTA’s technical western border, which is Burloak road at Lake Ontario). If the correction is here already, all the better. As I said, it’s long overdue.
Is it possible to have a reverse bubble – where the housing market freezes up and sales are totally in the dumps? A market where loans are next to impossible to obtain (credit market non-functioning), cash sales only? Prices go from insanely high to insanely low? Instead of $100K over asking price, the sellers are lucky to sell without losing money? A reverse bubble – is it possible? You know, without Monopoly money, I think it’s very possible.
Wolf, I see prices are still way up compared to 2019 in all cities. Do you ever see housing prices coming to 2019 level? BTW, real incomes haven’t increased since 1970. In general average American is lot poorer than in 1970. In real dollars. This was stated by economist Oren Cass. A conservative think tank economist. Please advise. Thanks
It sadly seems our country has been plundered, with most people unaware, but maybe and hopefully I’m wrong. What can people do? Stop voting for Republican and Democrat deficit spenders. Only elect those who balance the budget.
My zip in east Florida is down approx 7% yoy. When I mention this to my somewhat financially sophisticated peers they simply do not believe me. We are nowhere near hitting the emotional component of a market correction.
Since the shutdown, for sale signs have popped up in North DeKalb Atlanta – Lots and lots of them. All empty and cleaned up. CDC and IRS? At night the lights are out.
It earie with that many houses and suddenly nobody home.