Fed’s Nightmare, but it’ll cut anyway: CPI, Core CPI, and Core Services CPI all over 4% annualized. Goods prices spiked for Used Vehicles, Food, Gasoline.
By Wolf Richter for WOLF STREET.
Core services, which dominate the inflation index and include many of the essentials that consumers cannot do without – housing, healthcare, insurance, etc. – rose by 4.3% annualized in August from July, the second month in a row over 4%. In goods, the biggie was the spike in used-vehicle prices, continuing a year-long trend. Food and gasoline prices jumped.
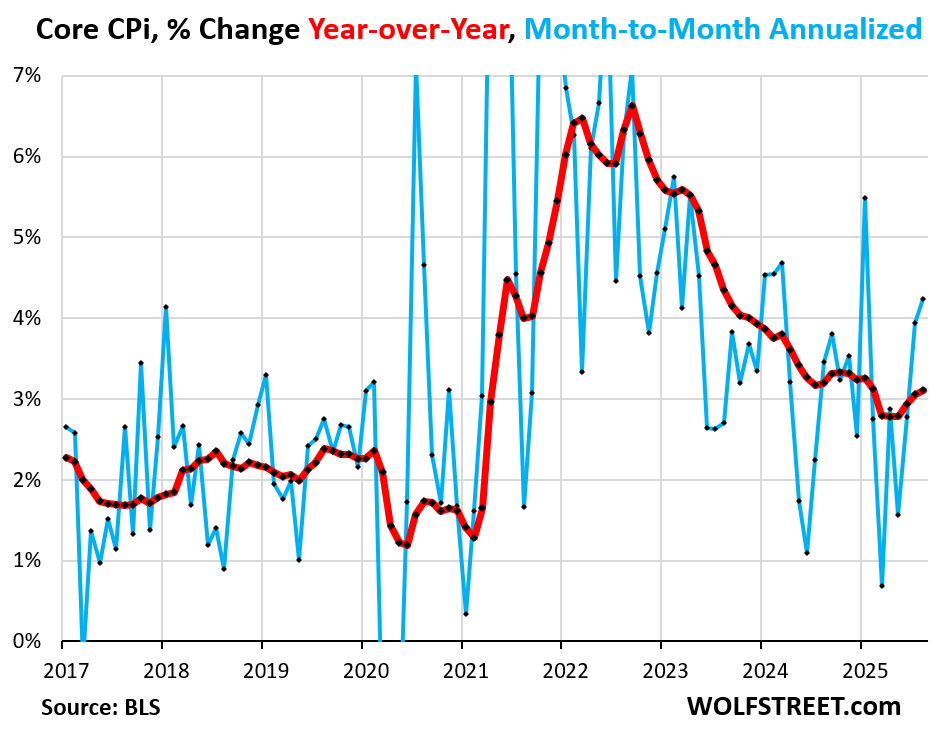
“Core” CPI, which excludes food and energy components to track underlying inflation, accelerated to +0.35% in August from July (+4.2% annualized), the worst since January, and beyond January, the worst since March 2024 (blue in the chart below).
Year-over-year, “core” CPI accelerated to +3.1% annualized, the worst since February, and the fourth acceleration in a row (red):
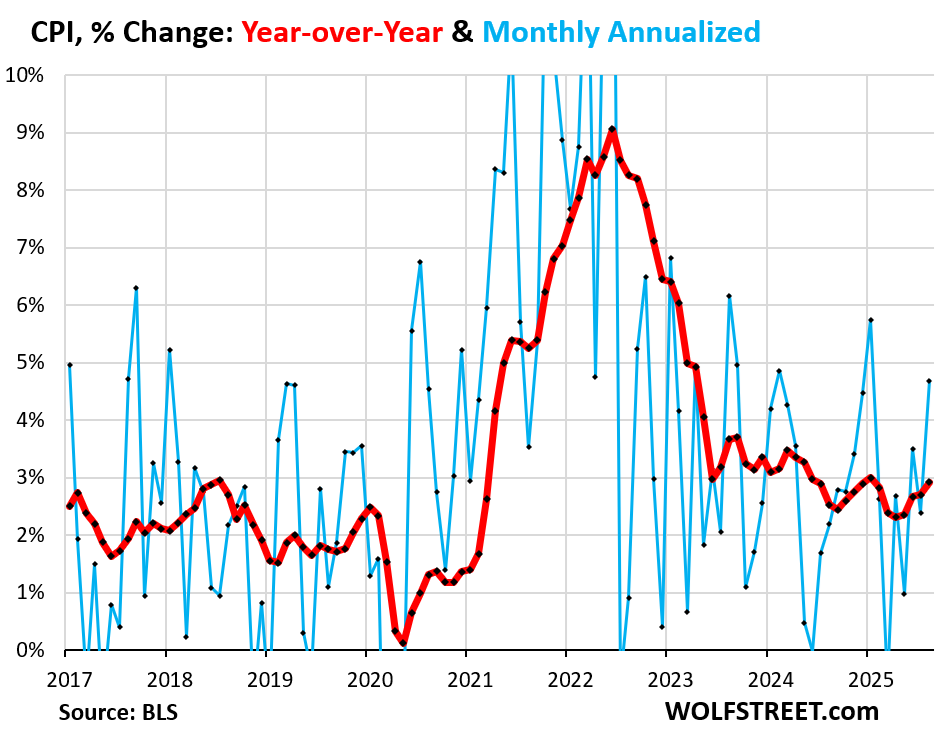
The overall CPI, which includes food and energy, rose by 0.38% (+4.7% annualized) in August from July, the worst since January, and beyond January the worst since February 2024 (blue in the chart below).
Food and energy prices both increased month to month in August, after declining in July.
Year-over-year, overall CPI rose by 2.9%, the worst increase since January, and the fifth acceleration in a row (red)
Core services move the needle.
They include housing costs, medical care, health insurance, auto insurance, tenant’s insurance, subscriptions; telephone, internet, and wireless services; lodging, rental cars, airline fares, education, movies, sports events, club memberships, water, sewer, trash collection, motor vehicle maintenance and repair, etc.
They account for two-thirds of the CPI basket, and that’s where inflation ran over 4% annualized for the second month in a row.
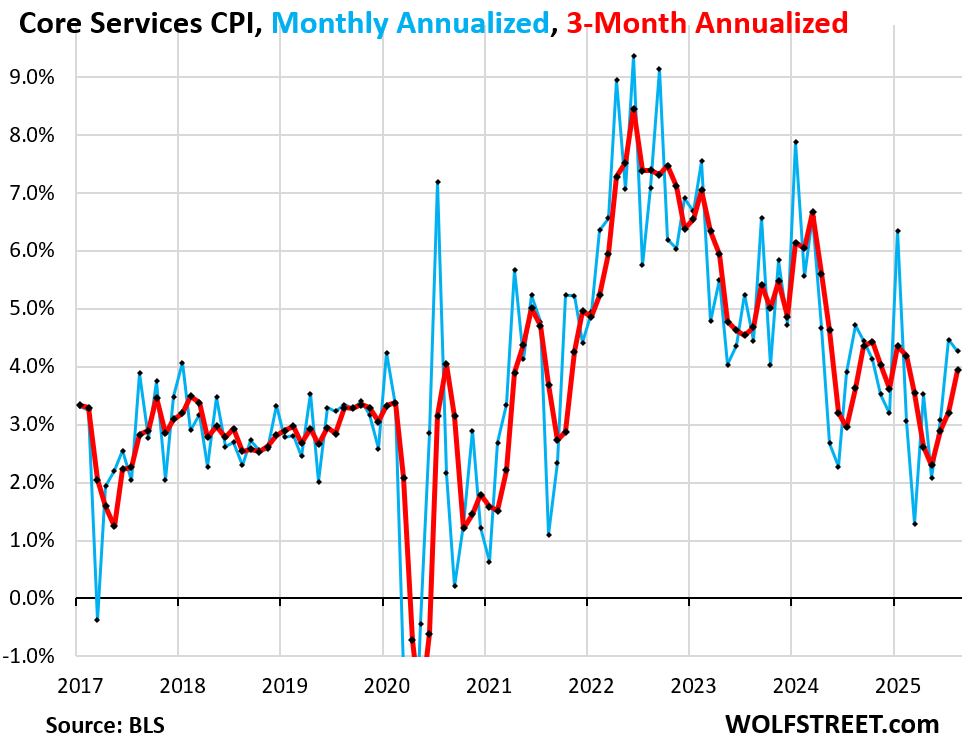
Core services CPI rose by 4.3% annualized in August from July (+0.35% not annualized), after having risen by 4.5% annualized in July, and both were the worst increases since January (blue in the chart).
The three-month core services CPI accelerated to 3.9% annualized, the third month in a row of acceleration (red).
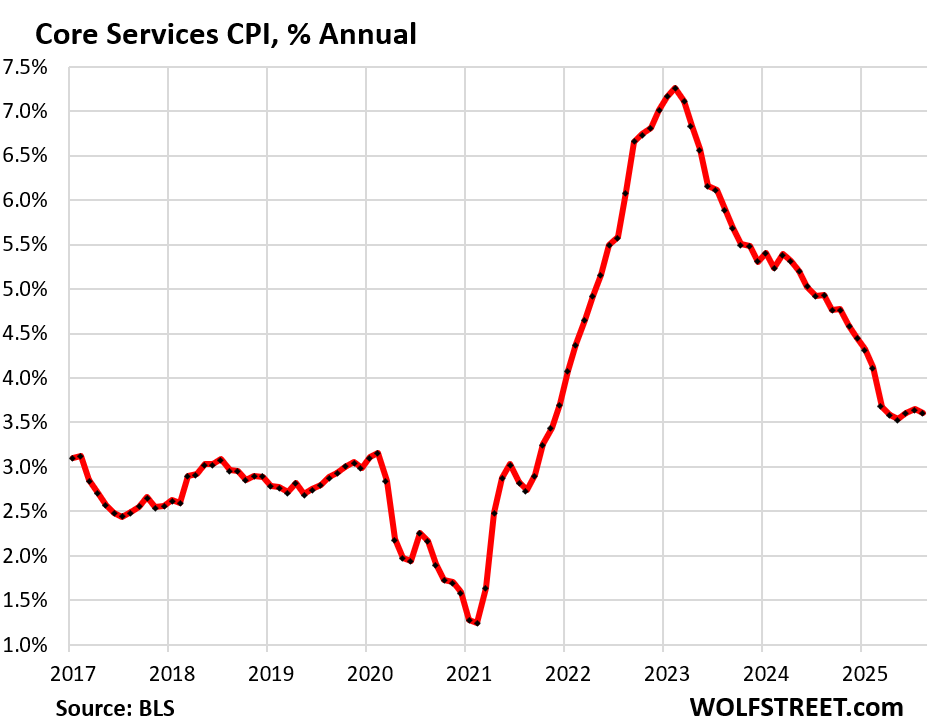
Year-over-year, core services rose by 3.6%, roughly the same year-over-year increases since March.
Housing components of core services.
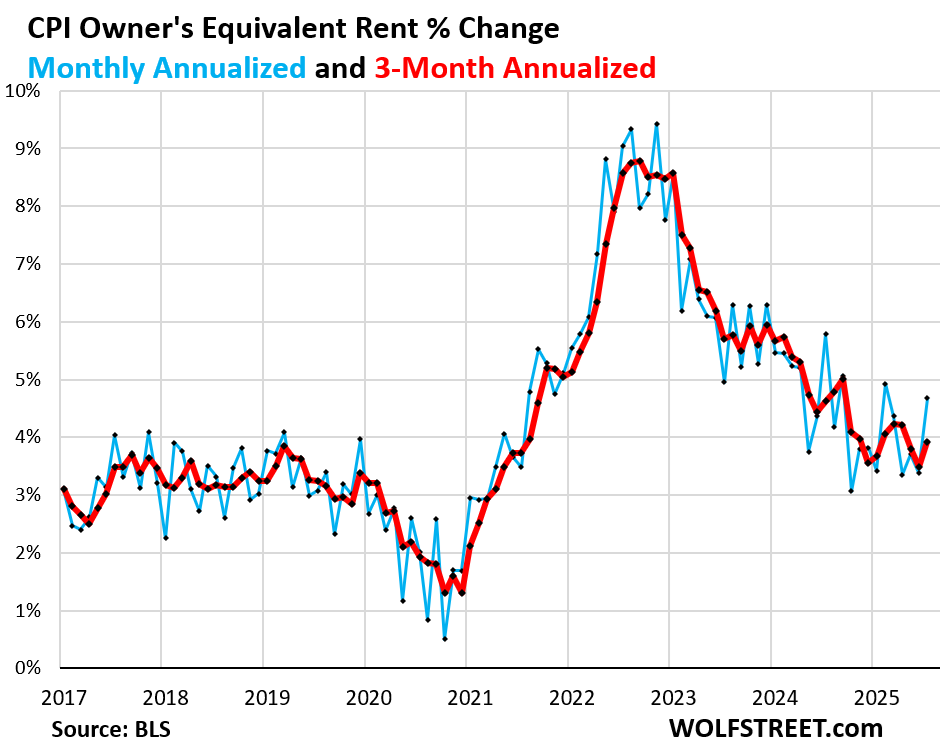
Owners’ Equivalent of Rent CPI jumped by 0.38% (+4.7% annualized) in August from July, the worst increase since February.
The three-month average jumped by 3.9% annualized.
Homeowners are starting to figure in their cost increases. OER indirectly reflects the expenses of homeownership: homeowners’ insurance, HOA fees, property taxes, and maintenance. It’s the only measure for those expenses in the CPI. It is based on what a large group of homeowners estimates their home would rent for, with the assumption that a homeowner would try to recoup their cost increases by raising the rent.
As a stand-in for homeowners’ expenses, OER accounts for 26.2% of overall CPI and estimates inflation of shelter as a service for homeowners.
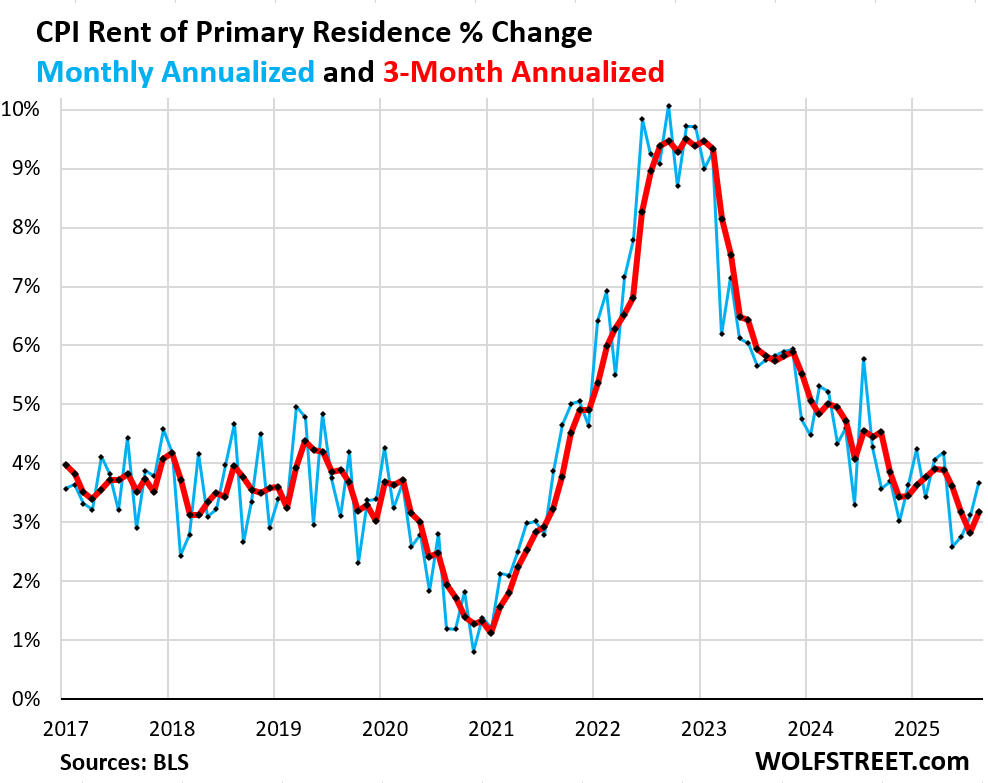
Rent of Primary Residence CPI rose by 0.30% (+3.7% annualized) in August from July, the third acceleration in a row.
The 3-month rate rose by +3.2% annualized, the first acceleration in four months.
Rent CPI accounts for 7.5% of overall CPI. It is based on rents that tenants actually paid, not on asking rents of advertised vacant units for rent. The survey follows the same large group of rental houses and apartments over time and tracks the rents that the current tenants, who come and go, pay in rent for these units.
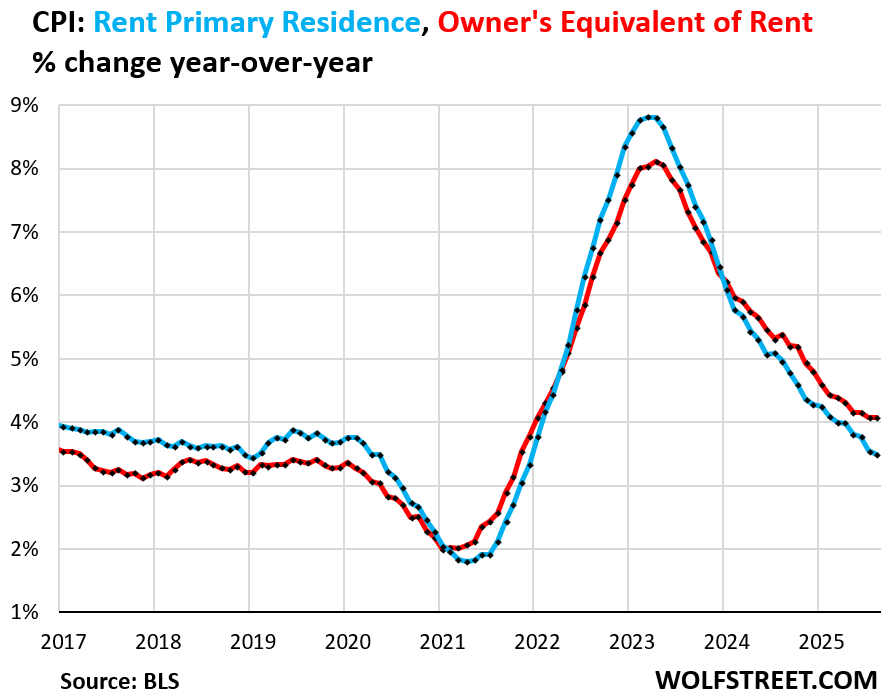
Year-over-year, OER rose by 4.1% for the second month in a row. The deceleration has ended (red in the chart below).
Rent CPI (blue) rose by 3.5% year-over-year, an increase that was just a hair smaller than in the prior month.
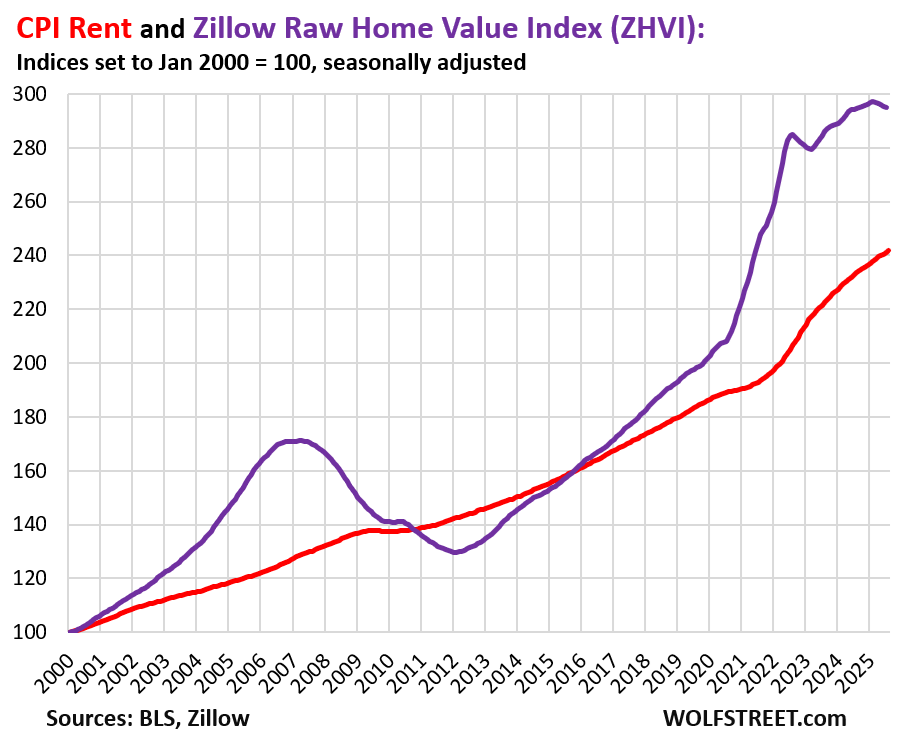
Rents have shot up by 30% since the beginning of 2020. That spike pales compared to the home price explosion of 43%. But home prices peaked early this year on a seasonally adjusted basis and have started to decline since then.
This is the Zillow Home Value Index for all homes, seasonally adjusted (purple) and the CPI for rent (red), both as index values set to 100 for the year 2000.
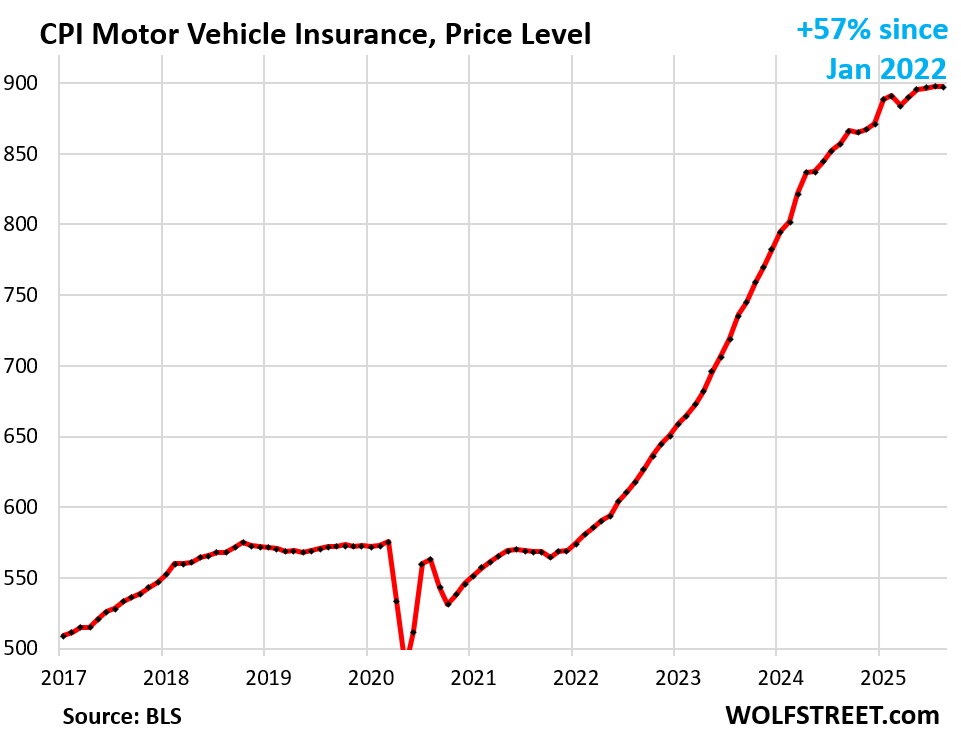
Motor vehicle insurance was unchanged in August from July, but was up by 4.7% year-over-year.
Since the beginning of 2020, the CPI for auto insurance has spiked by 57%, but those increases have cooled for the moment – but it won’t last long because used vehicle prices, which form replacement costs for insurers, are surging again (more in a moment).
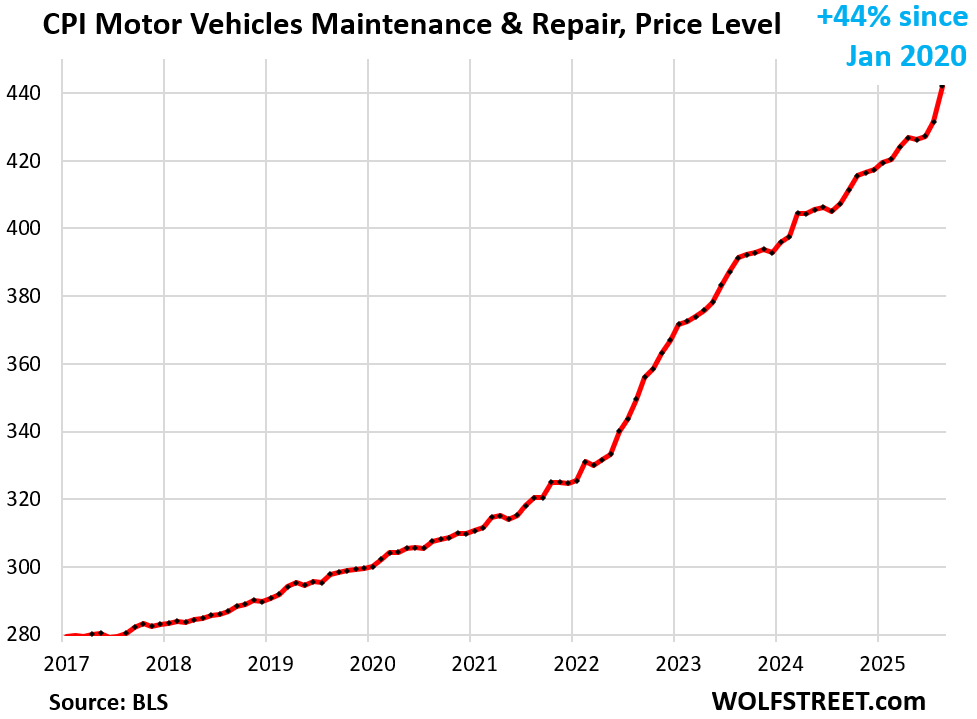
Motor vehicle maintenance & repair shot up by 2.4% in August from July (+33% annualized), and by 8.5% year-over-year.
The index weighs 1.0% in the CPI basket.
Since the beginning of 2020, the CPI for motor vehicle maintenance & repair has spiked by 44%. Compensation for technicians and prices for replacement parts have shot up since early 2020, and tariffs are now piling on top of it.
This is one place where companies have an easier time passing on costs, any costs, including tariffs on parts, and including fatter profit margins, and it shows in the very high profit margins of the parts & service departments of publicly traded auto dealers: When customers need a repair – maybe the vehicle was towed in or is making a scary sound or the A/C went out in August – it’s not that easy to shop around.
The table below shows the major categories of “core services.” Combined, these categories accounted for over 60% of total CPI:
| Major Services ex. Energy Services | MoM | YoY |
| Core Services | 0.4% | 3.6% |
| Owner’s equivalent of rent | 0.4% | 4.0% |
| Rent of primary residence | 0.3% | 3.5% |
| Medical care services & insurance | -0.1% | 4.2% |
| Motor vehicle insurance | 0.0% | 4.7% |
| Education (tuition, childcare, school fees) | 0.2% | 3.3% |
| Admission, movies, concerts, sports events, club memberships | -0.1% | 4.3% |
| Other personal services (dry-cleaning, haircuts, legal services…) | 0.1% | 4.4% |
| Public transportation (airline fares, etc.) | 3.6% | 2.2% |
| Telephone & wireless services | -1.0% | -1.7% |
| Lodging away from home, incl Hotels, motels | 2.3% | -2.6% |
| Water, sewer, trash collection services | 0.4% | 5.3% |
| Motor vehicle maintenance & repair | 2.4% | 8.5% |
| Internet services | 1.2% | -0.8% |
| Video and audio services, cable, streaming | -0.6% | 1.6% |
| Pet services, including veterinary | 0.6% | 5.5% |
| Tenants’ & Household insurance | 0.6% | 5.7% |
| Car and truck rental | -6.9% | -4.8% |
| Postage & delivery services | 1.4% | 4.7% |
Goods prices.
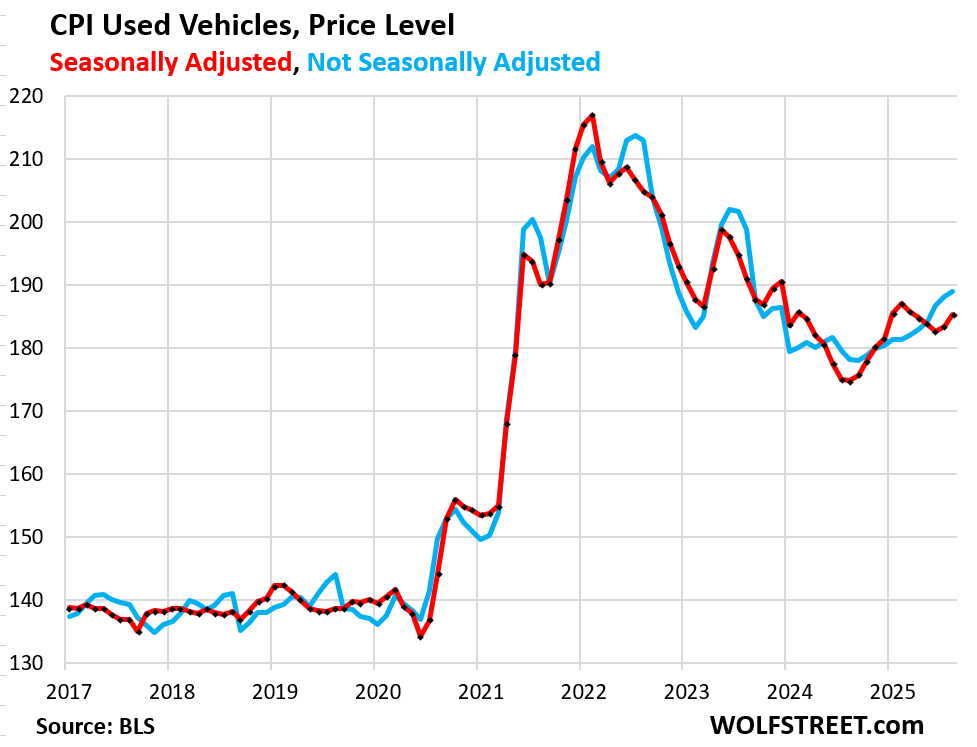
Used vehicle CPI jumped by 1.0% in August from July (+13.2% annualized) and by 6.0% year-over-year. Prices have been rising since mid-2024, after the long drop from the historic spike.
Used vehicles weigh 2.4% in the CPI basket.
I have been discussing this for a year: inventories are tight because of the large-scale production cuts of new vehicles in 2021 and into 2022, that had the effect that somewhere between 8-10 million fewer new vehicles were sold in the US over this period, and those vehicles that hadn’t been produced and sold are now missing from the national fleet and are not flowing into used-vehicle inventory, such as via rental fleets, lease returns, etc. Tight inventories and decent demand ended the price drop in mid-2024, and since then prices have been rising. This has zero to do with tariffs.
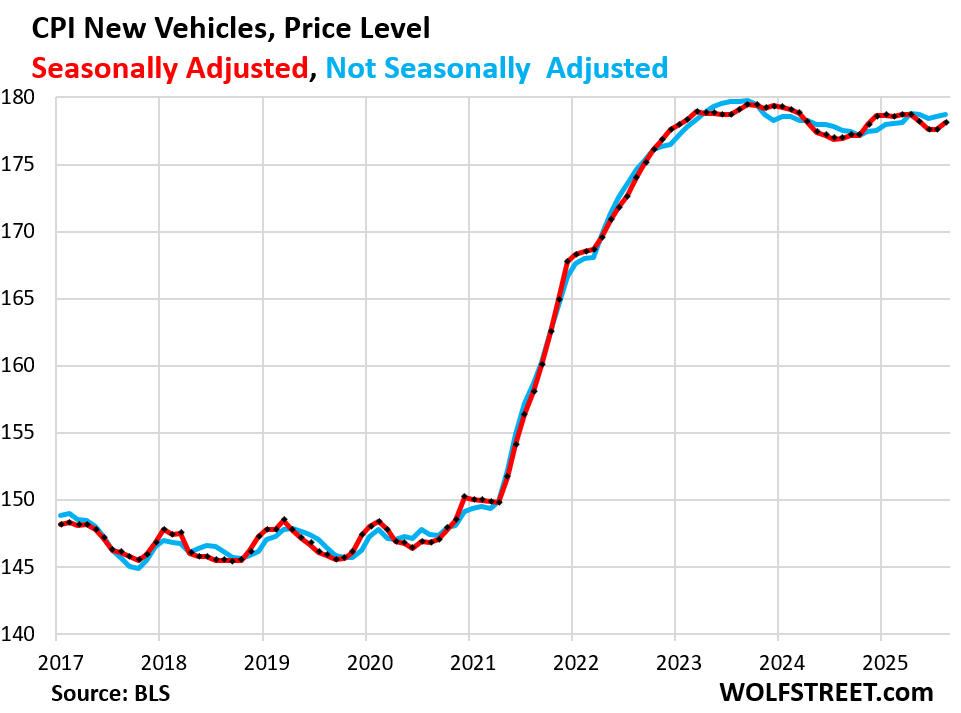
New vehicles CPI rose by 0.28% in August from July, after being unchanged in the prior month, and dropping for the three months before then.
Year-over-year, prices are unchanged. Prices are essentially unchanged since early 2023, after the historic price spike that caused profits at dealers and automakers to blow out.
New vehicles weigh 4.3% in the CPI basket.
Some new vehicles, if imported, are tariffed; and if assembled in the US, some of their imported components are tariffed.
But there are no signs of tariffs getting passed on to consumers. Automakers would love to, but they can’t. All the big automakers have been talking about it in their earnings warnings.
The price spike during the free-money era has made new vehicles too expensive, and now automakers need to throw incentives and discounts at the market to keep sales from falling. It’s a very tough market, and consumers are once again shopping around instead of just paying whatever, which is what they had done during the Free-Money era. And automakers are working on shifting production to the US, but that’s a long slog.
GM, which makes a large portion of its US-sold vehicles in Mexico, China, South Korea, and Canada, and moved much of its supply chains overseas, is among the hardest-hit. Tesla and Honda, whose vehicles are among those with the most US content, are among the least hit.
Durable goods prices overall rose by 0.42% (+5.1% annualized) in August from July, driven mostly by the price spike in used vehicles (+13% annualized).
Year-over-year, the CPI for durable goods rose by 1.9%, also mostly driven by used vehicles (+6.0%).
Inflation in the other durable goods categories is either benign or negative (deflation).
| Major durable goods categories | MoM | YoY |
| Durable goods overall | 0.4% | 1.9% |
| New vehicles | 0.3% | 0.7% |
| Used vehicles | 1.0% | 6.0% |
| Household furnishings (furniture, appliances, floor coverings, tools) | 0.1% | 2.8% |
| Sporting goods (bicycles, equipment, etc.) | 0.1% | -1.3% |
| Information technology (computers, smartphones, etc.) | -0.3% | -5.3% |
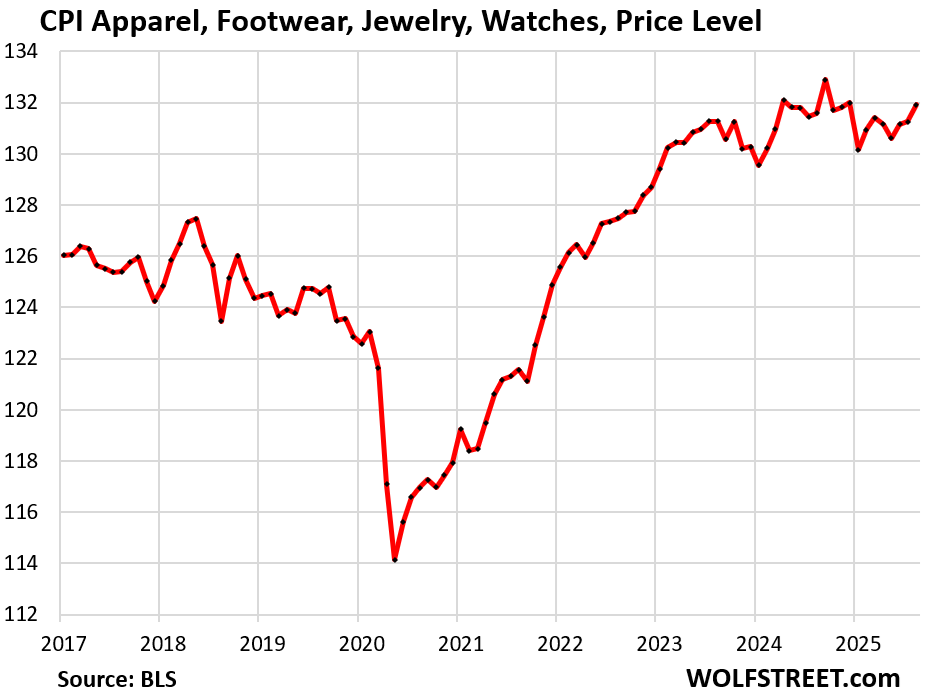
Apparel, footwear, watches, and jewelry are largely imported and tariffed. The CPI for this stuff rose by 0.5% for the month, after being flat in the prior month.
Year-over-year, the index was roughly unchanged. The chart shows the price level (not the percentage change). Find the tariffs:
Food Inflation.
The CPI for “Food at home” jumped by 0.6% in August from July, after dipping in July (-0.1%).
Year-over-year, prices rose 2.7%.
Since January 2020, food prices have surged by 29%.
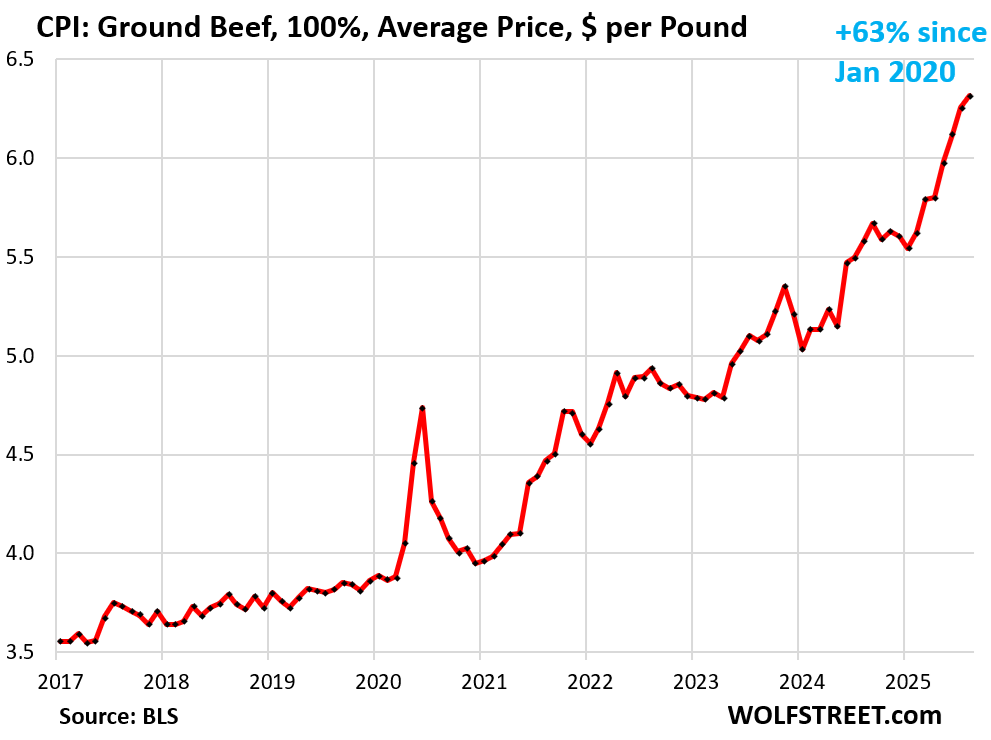
Beef has been a driver for years as US cattle herds have dropped to a 64-year low for several reasons.
Overall beef prices spiked by 2.7% month-to-month and by 13.9% year-over-year.
For example, the average price of a pound of ground beef spiked by 1.0% month-over-month and by 13.3% year-over-year, to $6.32.
Since January 2020, the average price of ground beef has spiked by 63%. This is a years-long issue:
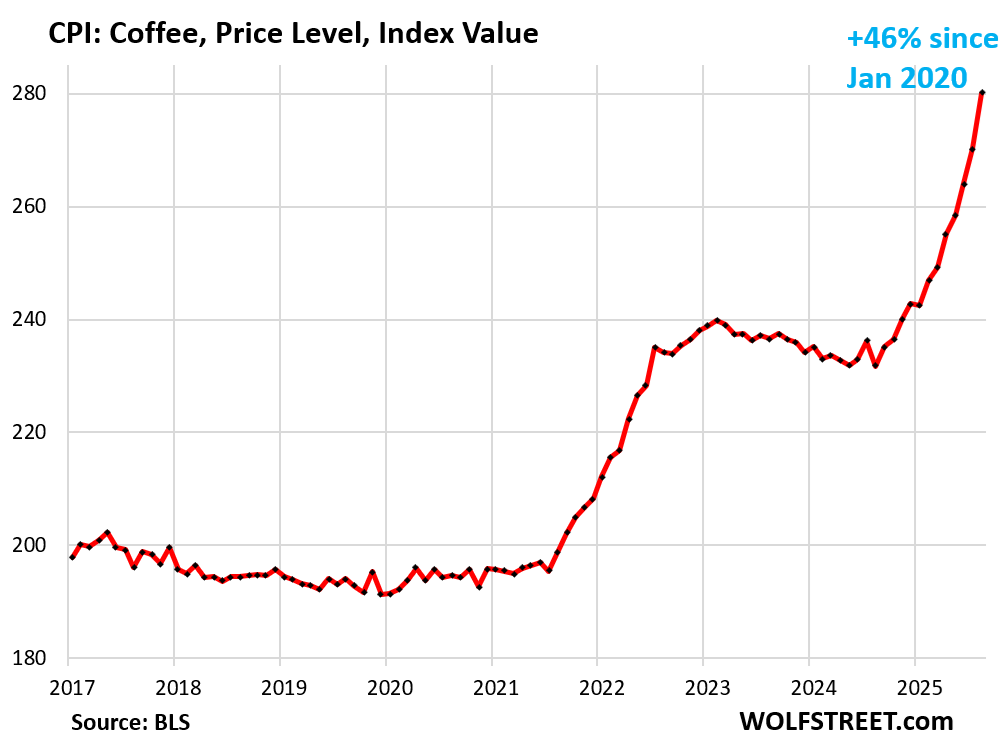
Coffee spiked by 3.6% for the month and by 20.9% year-over-year. Since mid-2021, when this price surge began, the CPI for coffee has surged 46% following global commodity coffee prices:
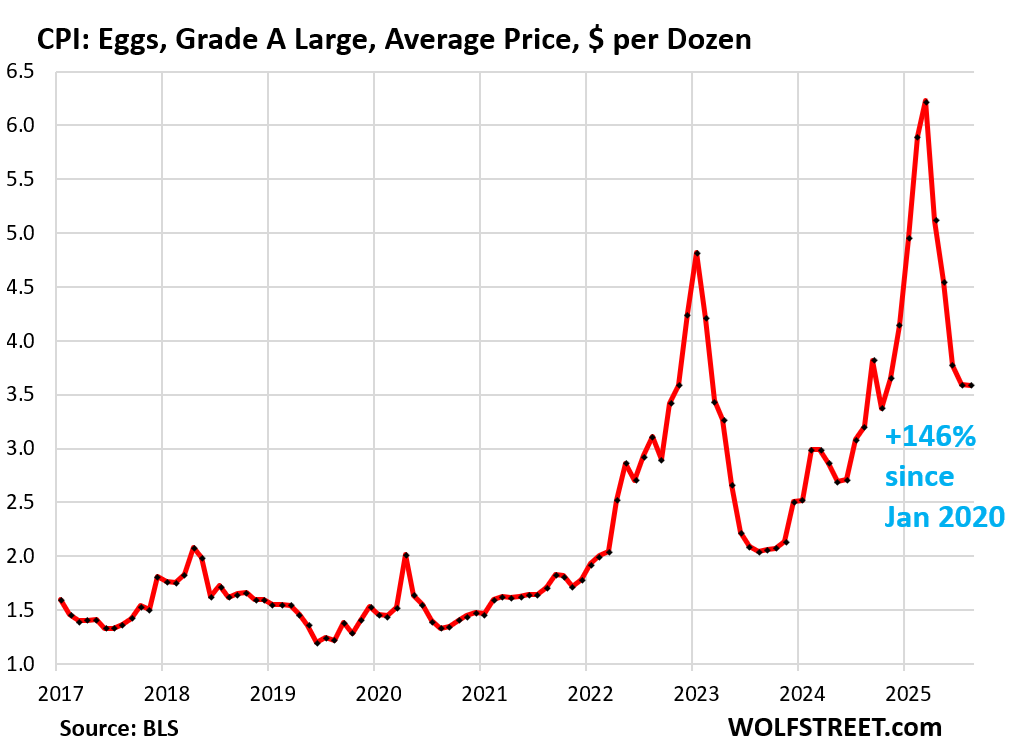
Egg prices overall were unchanged in August from July, after four months of declines, as they unwind their avian-flu-driven price spike. Year-over-year, the index was still up 10.9%.
For example, the average price of a dozen Grade A large eggs dipped 0.3% in August from July, to $3.59 per dozen. That was still up 12% year-over-year.
From the peak in March, they have plunged by 42%.
But they’d spiked so much in two huge waves during the avian flu period through March 2025 that even after this plunge, they’re still up by 146% from January 2020:
| MoM | YoY | |
| Food at home | 0.6% | 2.7% |
| Cereals, breads, bakery products | 0.1% | 1.1% |
| Beef and veal | 2.7% | 13.9% |
| Pork | 0.2% | 1.2% |
| Poultry | -0.7% | 1.7% |
| Fish and seafood | 0.6% | 2.3% |
| Eggs | 0.0% | 10.9% |
| Dairy and related products | 0.1% | 1.3% |
| Fresh fruits | 1.0% | 1.7% |
| Fresh vegetables | 3.0% | 2.9% |
| Juices and nonalcoholic drinks | -0.3% | 1.5% |
| Coffee, tea, etc. | 3.6% | 20.9% |
| Fats and oils | 0.2% | -1.1% |
| Baby food & formula | -0.9% | 0.5% |
| Alcoholic beverages at home | 0.6% | 0.3% |
Energy.
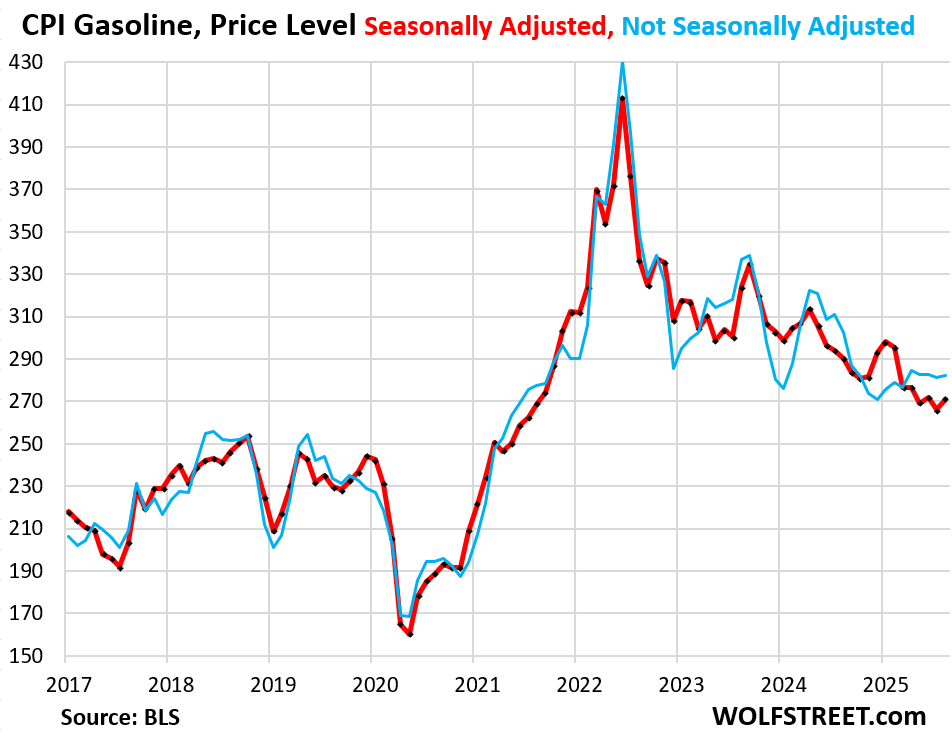
The CPI for gasoline jumped by 1.9% month to month, seasonally adjusted. But year-over-year, it was still down by 6.6%, on lower oil prices. Gasoline makes up about half of the overall energy CPI.
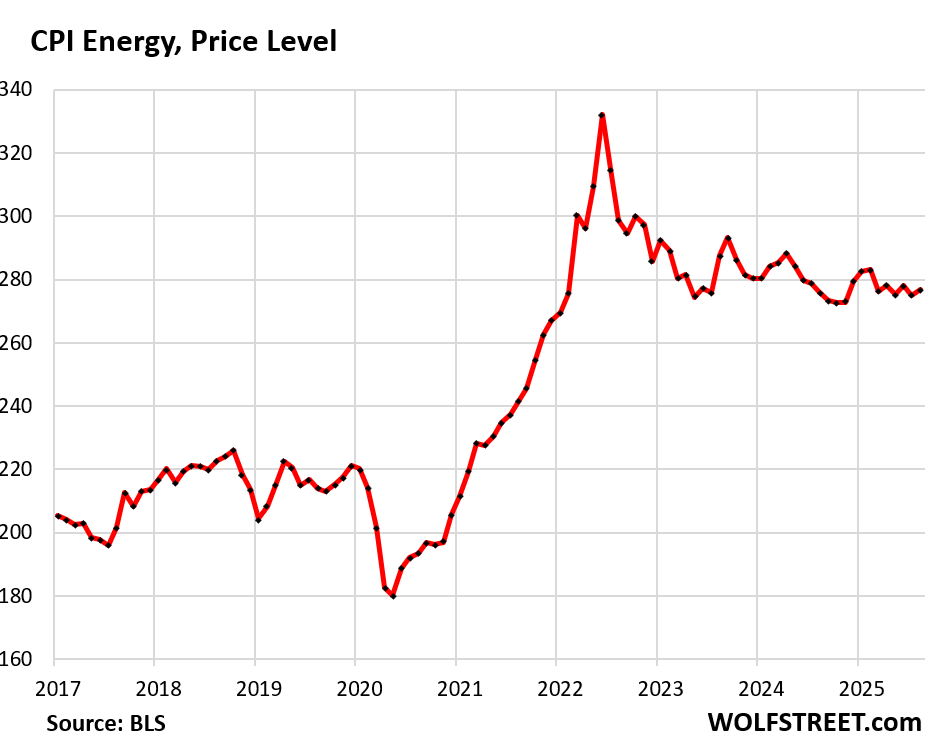
The CPI for energy overall jumped by 0.7% in August from July but was roughly unchanged year-over-year. Note the year-over-year surge in electricity services and natural gas piped to the home.
| CPI for Energy, by Category | MoM | YoY |
| Overall Energy CPI | 0.7% | 0.2% |
| Gasoline | 1.9% | -6.6% |
| Electricity service | 0.2% | 7.7% |
| Utility natural gas to home | -1.6% | 13.8% |
| Heating oil, propane, kerosene, firewood | -1.1% | -0.8% |
Overall energy prices that consumers pay for directly have plunged by 17% from the peak in mid-2022 but are still far higher than before the pandemic:
Enjoy reading WOLF STREET and want to support it? You can donate. I appreciate it immensely. Click on the mug to find out how:

![]()
“Fed’s Nightmare, but it’ll cut anyway” Wolf, does it mean it’s getting closer for you to bring out the “The most wreckless FED ever” from the bloom closet soon? I do miss seeing that title around here even though we never stop feeling their wreckless aftermath like the massive housing bubble we’re still reeling through…
They are being told by the executive branch to cut and are having their members replaced to get that done.
They’re getting told by the bond market to cut 25 bips.
My guess bond market agrees when next week Powell says no more cuts are guaranteed and we see yield rise a bit…. Until next NFP
It’s not a housing bubble, it’s an everything bubble.
I think the Fed is pretty happy. People are pissed about inflation, but not that pissed, the rich have an even higher percentage of the nation’s wealth and can spend whatever they want on anything. Job losses are off their lows, but still relatively low, and the bigtech companies that hold the stock market together are printing money and capturing greater and greater control over society, most of which money and control goes to the aforementioned rich.
What’s not to like?! Unless of course you’re a young family trying to afford life, of course.
Young family? Those hardly exist today. Just a new a novel way to push of our problems until further into the future.
And people wonder why younger people don’t want to have children.
Because of services inflation, it’s becoming increasingly unaffordable.
I’m working 70 hours a week for 24/hr no OT at a company that has a 2% job accident mortality rate. Granted the trucking job market is absolutely abysmal currently but at least I’m working after 4 months of being laid off. Also my company shorts my paychecks systematically so I’m really only making 22 an hour or so. With no OT.
22 bucks an hour in Washington state to haul flammable and explosive liquid chemicals. 70 hour work weeks. Apartments are 1500/mo for the cheapest studio apartment. A single wide on real property and not paying lot fees is 400k+ dollars.
Yeah I don’t think I’d be pairing off and having kids ever. Good enough for them. I hope anti-natalism takes firm root and the elites have no peasants to milk. I’ve officially lost hope for the future of this country. You’d have to be a reprehensible human being to bring a child into this world knowing what’s coming.
“You’d have to be a reprehensible human being to bring a child into this world knowing what’s coming.”
I decided that during the Reagan Double dip recession as I watched what his masters were telling him to do and suffered myself.
First time I ever drank alone……Popov vodka $1.48 half pint. Sure I had to do without some bread and cheese but for me it was needed medicine…..hopelessness is a horrible thing, many never recovered.
Oh, to keep financial, the budget was almost balanced, but he made (some) happy by deficit spending on steroids; that had not been seen since the war. Allowed him to REALLY lower taxes and wait for the trickle down Uncle Milty got a “Nobel prize” for predicting.
Thanks for this detailed report. It makes you wonder why bond investors are jumping all over themselves to buy bonds.
This looks like the except scenario they’d be concerned about, the Fed cutting because of political pressure while inflation continues to be a huge problem.
Just raised the rent on the last couple units for the year between 4.9% and 6.3%
I saw a nature show a while back, one of the Planet Earth ones, I think.
There was this male bird who was trying to get attention, and he would keep on jumping up above the high grass, then float back down as he flapped his wings again and again. Desperately trying to get a reaction…
You could almost hear him saying “lookatme, lookatme, lookatme!”
Odd, I wonder what made me think of that.
David :
Thanks for bragging about it. You guys are something …..
“Just raised the rent on the last couple units for the year between 4.9% and 6.3%”
Mark,
If one is running a business, which in this case is owning and renting out residential properties, one has a balance between costs and revenue. Obviously, the point to being in business is to make a profit for one’s endeavors.
My guess is that David’s total costs to operate these properties are probably rising more than 5% or 6%. Therefore, the above mentioned rent increases may in fact be somewhat benevolent.
I know, I’m silly.
Of course, rents are set, to a large degree, by supply and demand.
I’ll tell you a secret as a guy who’s been living off of my rental properties for a long time. The best environment for a landlord is low inflation.
While the rent increases are a hedge, they’re an imperfect hedge against properties tax and insurance hikes along with of course repair costs (I have – $25,500 estimate for a balcony replacement I’m looking at right now).
As a long time homeowner who faces 5% plus annual increases in taxes and insurance (with a $5k deductible and zero claims in 29 years) I feel your pain.
Fortunately for me I am still able to maintain my property but that window is getting smaller.
Headline I read this morning while drinking my coffee:
“Dow jumps to record high on rising job losses and increase in CPI”
Someone make it make sense.
Well, stock prices are not included in the CPI (or the PPI), does that explain this?
Yeah it does make you wonder how many times rate cuts can be used an excuse for a rally.
It does sound like the beginning of the end of a bull market. That is, the market has gone completely insane. Economic condition no longer matters. Maybe the market is expecting a re-run of the Turkey’s stock market. Currency devalues 90% while stock market rises 600%.
Billions every 2 weeks getting dumped into 401Ks, IRAs, other tax free brokerage accounts, mechanically driving markets higher and higher. People don’t understand the risk until they’re down 50%. People are acting like the stock market is a risk-free investment. In time they’re gonna pay for that crazy idea.
I’ve heard the 401ks argument as to why stocks can defy reality forever. The fact is, the billions that go from people’s paychecks into 401ks are not what’s creating the massive buying pressure and the lack of selling pressure.
It’s the psychology. People, especially retail investors for the past 6 months or so, believe that they can’t lose, that the Fed and Congress will always make sure stocks go up. So they don’t believe they’re taking any risk. It’ll take a prolonged downturn that doesn’t result in “emergency” measures to change that psychology
To add to my previous point, there were 401ks in 2008 and 2009 too. There also were 401ks in February and March of 2020.
TSonder,
The passive bid (aka money mindlessly flowing into retirement accounts and ultimately into stock indexes) argument for stock indexes rising does not assert stocks can defy reality forever, only that stocks can continue to go up as long as the passive bid remains in place. The passive bid can be undone if unemployment rises significantly (fewer contributions), retirees withdrawal funds for living expenses, or investors rebalance their portfolios away from equities. Thus, 2008 and 2020 are not great examples against the passive bid argument since both years saw significant increases in unemployment which impacted the passive bid negatively (even if people who were still employed had 401Ks), before steps were taken to prop up the markets.
I think you’re right that psychology plays a significant roll in all of this. The current psychology is based on the environment created by policies of the recent past, including QE, ZIRP, massive fiscal deficits, and belief in a Fed Put. The psychology may change quickly if the Fed takes ZIRP and QE off the table as policy responses to rising unemployment and/or the bond market forces some type of fiscal discipline. Until one or all of those things happen though, the billions that go from people’s paychecks into 401ks will continue creating buying pressure supporting market indexes.
rojogrande, but the same “buying pressure” was there in April of this past year. The buying pressure will be there even if 4% more are unemployed. The question is, what is the corresponding selling pressure. If every current holder of stocks believes they can’t lose, why sell today for X when you get can more next year? That is the lack of selling pressure, and is what psychology would be needed to change.
TSonder305,
I acknowledged there is a major psychological component and that many things can change the psychology. In April it was tariffs, though “buy the dip” rapidly caused the market to reverse course. Where I disagree with your original comment is your assertion “I’ve heard the 401ks argument as to why stocks can defy reality forever.” Outside of people who misunderstand or mischaracterize it, that’s not how the passive bid argument works. The passive bid just describes a phenomenon of massive price insensitive buying supporting the market and mopping up selling pressure under current market conditions. Many things can change the passive bid phenomenon though, a few of which I mentioned in my previous comment, and possibly reimpose reality on stocks.
With the US $37 Trillion deficit, stocks have become the new cash.
Lack of diversification shows in an economy throwing mountains of cash at AI and its tributary industries. The diversification missing is an economy that sensible aims with some recognizable steps toward a fairly broad-based human prosperity and well-being. The goal posts are extremely obtuse, but the bets are going all-in, very narrow. All sorts of peripheral problems are being kept peripheral: ignored. There is lots of faith-based crowding thinking here.
Even the financial media thinks this is insane. I think the dominant narrative is that it’s being driven by the AI bubble, and after that pops, the government will bail out the asset markets by flooding them with money again.
It does make me wonder about that saying that bubbles don’t pop when everyone is expecting them to. I mean this can’t go on for much longer so…is this going to be the most-anticipated Minsky moment in history?
Basically…Yes. $37 trillion in federal debt going to $60 trillion in 10 years. How long can that go on?
It makes sense when you realize people are dumping billions into 401Ks and similar retirement or school tax-free programs, driving the market up every 2 weeks because all that money goes into stocks, mechanically driving up the DOW, NASDAQ and S&P.
For every buyer of stock there is a seller. So while you repeatedly point out that people putting billions of dollars into 401ks and such and think all of that is feeding the stock market you are ignoring that someone is selling billions of dollars of stock to the 401ks.
The point I think Jeff is making is that the money flowing into retirement accounts and then into the stock indexes are price insensitive. The contribution is made and the purchase of the underlying index is executed regardless of valuation. Having a marginal purchaser who makes investments on autopilot as the contributions come in, regardless of the current price, will have a tendency to support higher valuations.
Higher inflation means higher revenues. Higher job losses mean lower costs. Together that creates higher profits. Higher profits translate into higher stock prices.
You’re assuming that job losses means lower costs, but that that won’t impact the ability of to charge higher prices.
So we should cut rates to the bone and let inflation rip higher at say 12 to 15 percent. That way we will all get filthy rich.
Rich is relative. If inflation is ripping at 15% but my asset values are growing at 20%, I’m getting filthy rich. If I have no assets and my income is growing at 3%, I’m getting slaughtered. Perspectives are different at different levels in society.
Simple … Rising job losses means a slack economy encouraging reduce interest rates which is general good for the Dow. Increase CPI usually puts pressure on the Fed to increase interest rates. Reduced interest rates will encourage more CPI.. Uh Oh. We’re screwed. I should get a job on CNBC.
Monthly mortgage payments highest in decades, Census Bureau says
CBS: Monthly homeownership costs now top $2,000, new data shows
1:04 PM 9/11/2025
Dow 46,108.00 +617.08 1.36%
S&P 500 6,587.47 +55.43 0.85%
Nasdaq 22,043.07 +157.01 0.72%
VIX 14.71 -0.64 -4.17%
Gold 3,674.60 -7.40 -0.20%
Oil 62.29 -1.38 -2.17%
Mr. Wolf,
Thank you for this analysis. I’ve been looking forward to it all day.
You say the Fed will cut overnight interest rates anyway. Is there any reason to believe they might accelerate QT? Either sell MBS or let a larger value of treasuries mature without replacement each month?
Waller dissented when the Fed slowed QT last spring. He wanted to continue QT at the pace of that time. He is now one of the top 3 candidates for the chairman job. Warsh, former Fed governor, quit the Fed in total frustration when Bernanke forced through QE2, and Warsh wrote a big essay about it. He also want’s to continue or increase QT, but cut short-term rates. He is also one of the top three candidates.
There seems to be a lot of impetus for either continuing or increasing QT and cutting short-term rates at the same time, while also shifting the Fed’s holdings from long-term securities to T-bills. And they all want to get rid of the MBS.
Thank you for the information. I’d forgotten about Waller.
A significantly steeper yield curve might be a good outcome.
Waiting for 6%, then will load up on long-term treasuries.
It greatly increases the countries risk profile to do so. It’s more reckless economic policy so current asset holders can keep the party going.
What happens if inflation spikes and there is no choice but to raise rates? Now you’re rolling over short term debt into high rates.
Every politician in Washington should be brought to a special retirement home in the middle of Wyoming and we should put some people that actually care about the future of this country in charge.
Wont this sharply steepen the yeild curve? Throwing 10Y, 30Y bonds as well as mortgage rates out of whack, at the same time pushing up stocks and gold?
QT and rate cuts…
– steepen the yield curve? Yes, probably.
– “Throwing 10Y, 30Y bonds as well as mortgage rates out of whack”: No, but might throw them back into whack. They were and still are out of whack.
– pushing up stocks? I don’t see that connection, maybe the contrary.
Sounds like revving the engine to make the President happy (cutting rates) while stepping on the brakes to stop inflation from accelerating (increasing QT)….
Is it possible to estimate the impact of QT on inflation and the impact of a rate cut, to get a sense of whether they’ll cancel each other out?
I don’t recall Trump talking about QT as he has focused on rates, but I might have missed it.
Trump talking about QT ??
I’m not sure if the prez knows what QT is?
Shhh. Don’t mention QT to Trump I doubt he knows what that is.
Going to a more Bear Stearns and Lehman financing model, except this time, these are the guys who have the printing press. Path of least resistance (print more) with no independent brakes could easily become a spiral. What could go wrong?
So we go from 6 trillion in national debt to 37 trillion in 24 years since 9,11,01 and the FED popped from 1 trillion to 9 trillion at peak not including this being done globally by Western governments…all the financial engineering learned over 2,000 years accelerated within 25 years…hats off these gangstas…
“We will be data dependent” J Powell
“We will see through the data when appropriate” J Powell
See what they did there?
The cheerleading for this Fed cut is unreal. The reasoning is as well.
Ah yes, the den of vipers who speak with forked tongues aka fed speak…can’t say we created 9 trillion dollars from nothing…
yes. Data is important until it isn’t.
If only we heard the mantra…
These employment numbers are transitory.
My guess is rate cut. And, when you can’t hit the target, move it.
Easy money policies continue supported by Mr. Trump.
B
It’s clear they’re not serious about the 2% target. The closest L12M Core PCE reading attained post-covid was +2.6%, and it’s reaccelerated to 3% in the last few months.
What bothers me more is they’ve decided to take the wimp’s easy way out. Rather than openly admit the target is nonbinding & let bond markets recalibrate, they’re continuing to pretend 2% is a viable & imminently-attainable target.
I don’t think they’ve claimed “imminently attainable”, just attainable. It remains to be seen if we continue “in the right direction”, ignoring bumps.
L12M Core PCE for August will likely come in at +3.0% when reported later this month. That’s a full percentage point above target.
I don’t know how anyone can say with a straight face that 4.3% unemployment, still below most NAIRU estimates & only a tick higher than the ~4.15% L12M average, is a more pressing concern than 5 YEARS OF ELEVATED INFLATION. Or that inflation is supposedly “well-anchored” & “on a glide path to 2%” despite evident signs of re-acceleration in tariff-exempt categories like food, services & housing.
This Federal Reserve can say no to Trump, but are beholden to Wall Street. Most reckless Federal Reserve ever Part 2 coming? It’s the same group of knuckleheads except Cook & Jefferson who joined later.
Gee I bet shutting down functioning coal plants has nothing to do with in home energy prices going up
Meh, coal is an outdated fuel with the abundance of clean-burning natural gas.
Unfortunately inflation means the gas costs more to pipe into your home, despite Henry Hub not getting above $3/mmBTU. Many states also surcharge the producers and utilities which pass on those costs to their customers.
The plant near me is being retired 16 years early. Are we just going to ignore that cost? The new plan will also cost hundreds of millions and is directly causing price increases.
So meh all you want, but stop acting like that shit doesn’t cost money
You’ll not get a candid answer to your question
Eric86
Nope. Natural gas power are far cheaper than coal power because coal power plants (35-40% thermal efficiency) are very inefficient compared to a combined-cycle NG plant (65% thermal efficiency). But the US has turned into the biggest LNG exporter in the word, and it exports NG via pipeline to Mexico, and a part of NG production is used by the vast US petrochemical industry as fuel and feedstock. So all this new demand is soaking up what used to be massive overproduction of NG from fracking.
But the price of NG collapsed in 2009 due to overproduction and, except for brief spikes, spent 15 years at collapsed levels. So it’s coming up from those collapsed levels. NG is still incredibly cheap in the US compared to other places, in terms of commodity price. What your utility charges you for piped natural gas is between you and your utility.
Wolf I love you, but you are wrong. Look up Rawhide in Northern Colorado. Rawhide has to convert from coal and natural gas to 90% renewables. (Was supposed to be 100% but that really isn’t possible and the greenies freaked out).
Now there are already natural gas units because they helped when power peaks but pursuing more renewables means you have to invest into these new natural gas units that are basically airplane turbines and the cost is astronomical. I can’t share anymore than that.
Rawhide is being decommissioned 16 years early. It is consistently voted as one of the best run plants in the nation.
Natural gas going up is certainly a driver but ignoring capital costs like this is wrong.
I promise you that power companies take into account total costs when they make these decisions. And that’s not even adding the externalities from the economic damage done by burning coal.
The dirty little secret is that none of the EPA mandates were actually necessary to get companies to replace coal plants with gas. Pure economics did that all by itself.
“For nearly all coal-fired power plants in Colorado, retirement in the 2023 timeframe and replacement
with alternative resource options could provide significant economic benefits to electricity
consumers due to reduced operating and maintenance costs (including fuel) and avoided
incremental capital costs. Replacing all ten coal units examined with solar resources would reduce
costs by $1.4 billion on a net present value basis (NPV) and replacement with wind resources would
reduce costs by $1.7 billion. For Xcel in particular, replacing its share of five remaining coal-fired
units could yield benefits ranging from $187 million (NPV) for a solar resource replacement to $360
million (NPV) for a wind resource replacement. More specifically, replacing Xcel’s most expensive
units, Hayden 1 & 2 and Craig 2, could save Xcel customers $148 million in the case of solar or about
$156 million in the case of wind.”
Yeah numbers you are wrong as well, but I think it is cute that you think are right. I literally have the information.
You are talking about xcel. I am not talking about xcel. Their plants are pieces of shit.
we’ll just have to disagree, but you guys know so much about my local utility I guess. (I literally have more information than you do)
Says Eric86, the professional fossil fuel booster who has decided to take up residence in the comments section of a financial blog for some reason.
Eric86, you say twice in three paragraphs that you literally have the information, but you never “put up”…
You say the cost of natural gas power plants are astronomical, but provide no data.
You say capital costs are being ignored; do you understand NPV?
You say moving to renewables requires NG peakers, but ignore baseload combined cycle turbines as well as grid-scale energy storage. (Take a look at google and Arizona’s SRP project, which will be non-lithium storage.)
You say @numbers is only talking about Xcel, but @numbers’s data addresses “nearly all coal-fired plants in Colorado”. There is additional info provided on Xcel, but you can just strike that extra data—it changes nothing—if it triggers you that much.
You’re the one who ignores the data on “nearly all coal-fired plants in Colorado” to talk only about Rawhide Unit 1. And no one cares if it’s one of the highest efficiency coal plants in the nation. It’s not particularly relevant to the overall market for electricity in Colorado.
Also, don’t you think cherry picking one plant and using that to generalize across the nation or even just Colorado is disingenuous at best.
You are so wrong, but I think it is cute that you think are right.
Maybe you’re right about Rawhide U1 specifically, but I doubt it since you’re unable to provide any data to back up your unsupported claim that you “literally have the information”.
🙄
It has a lot to do with building all those LNG liquefaction facilities so that the oil and gas companies can make more profit selling oil and gas overseas than selling it here. Natural gas is used to make over 40% of the nation’s electricity, coal makes less than 15%. However, the US exported 55% of petroleum production, 25% of its natural gas and 25% of its coal in 2024. Its a higher amount of natural gas now, as the Trump administration decided to undo the pause the Biden administration had in place on building new LNG terminals.
Additionally, you have the Trump administration attempting to impose additional rules on construction of renewables(which are cheap and quick to build), reducing other available options beyond fossil fuels for energy generation.
Finally, there’s an increased electricity demand due to data centers, EVs, factories etc.
The best solution to the problems would be to spend money to modernize the electric grid, stop building all these LNG trains so the oil companies can benefit and keep more of that energy here so the American people can benefit from it, and stopping the pointless hostility towards renewables so that they can serve as another source of electricity generation and take some demand off of the natural gas plants.
The US has an abundance of energy and there is zero good reason to keep much less efficient and polluting coal plants running so that huge percentages of domestic natural gas can be sent overseas. The thermal efficiency of a coal plant from the 1970s is around 35%. The thermal efficiency of a new natural gas combined cycle plant is 55-60%. Coal is and has been dying precisely because those old plants have problems and are not profitable. An additional good idea would be to limit the amount of new data centers that are built unless the companies building them commit to building power plants to serve the grid and not allow companies like Amazon and Microsoft to buy up old power plants and convert them into giant data centers that also produce some natural gas electric power that might help the grid when demand for data center power is lower.
Poor planning and a combination of factors are causing increased power bills, but keeping non-profitable coal plants open to run only occasionally on very high demand days, such as in the summer, is a terrible solution in the long term. They should be shut down faster and replaced with natural gas and renewables for both environmental and economic benefits.
Yes…
Great charts too:
https://wolfstreet.com/2025/02/27/demand-for-electricity-takes-off-us-power-generation-by-source-in-2024-natural-gas-coal-nuclear-wind-hydro-solar-geothermal-biomass-petroleum/
https://wolfstreet.com/2025/03/02/drill-baby-drill-for-20-years-us-natural-gas-production-and-exports-via-lng-pipeline-rose-to-new-records-in-2024/
“When customers need a repair – maybe the vehicle was towed in or is making a scary sound or the A/C went out in August – it’s not that easy to shop around.”
I wonder how many shops are losing customers to ‘shadetree’ mechanics like myself? I do more and more work in my driveway, both for my own car and my friends’ cars too.
With no overhead and the ability to mail-order parts for planned repairs, I can do the work for significantly cheaper than what a shop can.
We had over 100 techs working in teams and shifts six days a week. And they knew what they were doing and were very fast. You cannot imagine the amount of work we did in a week. There are lots of places like this. Shade-tree is minuscule.
I REALLY enjoyed looking at things that have gone up a lot in price that I proved don’t NEED anymore at all to live a good life….at least it feels good to me, and that’s bottom line, right?
Clever down-sizers should be admired, not clever stuff users/accumulators, but that’s like saying I am the new type to be admired, not the guy with the pool and the Benz.
Believe it or not, I heard Cramer say something similar long ago, prior to the GFC, before all of CNBC just freaked out…all went off script a lot…..which I found VERY humourous.
I suppose we will all find out, or die without ever knowing.
QUE SERA, SERA.
Hello Wolf-O-Sphere – While we are talking about the Fed and inflation today, I am interested in your feedback. I present my current investment thesis below. Please tear it apart. All insults and nastiness welcome, as long as you tell me how I can do better as an investor. Key input: I am in my early 60s, and my wealth will outlive me, barring an international black swan disaster (which none of us can invest our way out of). Here goes:
I no longer trust U.S. Government fiscal or monetary policy. When Covid hit, I got burned badly on unprecedented government spending growth, rapid monetary expansion (creation of new money out of thin air), and demand stimulation via wealth redistribution (a.k.a. “The Wealth Effect”). Staying “safe” in U.S. Treasuries during 2020 through 2023 cost me at least 20% in terms of purchasing power lost to inflation and another 10% or 20% of foregone asset valuation growth. Historical equity risk premiums crashed as new investors flush with cash and with no understanding of fundamental financial analysis rushed into the stock market and were rewarded by Federal reserve interventions that created a “too big to fail” mentality for the stock market. My math tells me that equity markets are currently overvalued by at least 15% (and perhaps a hell of a lot more) when viewed through the lens of traditional discounted cash flow analysis.
I expect average U.S. Dollar inflation for the balance of my life to significantly exceed the Fed’s stated target of 2%. Inflation might be steady at around 2% or 3% for long periods, but I expect significant spikes during times of crisis, as during the Covid pandemic. Plus, expanding the money supply is the easiest way for a government with too much debt to reduce the burden of servicing that debt.
Despite the overvaluation of the stock market due to the current asset bubble, for the last couple of years I have been hedging against inflation by dollar-cost averaging a sizable portion of my wealth into stock indexes. Why? Because I have learned the hard way that businesses can manage cost growth with efficiency while increasing prices at a rate that exceeds inflation, even strong inflation. I now believe it is better over the long haul to rely on value-creating businesses (and their pricing power) than on the value-taking U.S. Government.
So, from my perspective, looking out 20 to 30 years nobody will win regardless of whether they hold cash, bonds or equities. Maybe precious metals, real estate and crypto will work out okay, but they are above my pay grade. You have to park your wealth somewhere. I don’t care about winning the most. How can I lose the least? I’m going with equities, or to be more specific, broad total market stock indexes. Good call? Bad mistake? Let me know what you think.
Good luck..you’re going to need it. This bubble will mop the floor with people like you.
“Because I have learned the hard way that businesses can manage cost growth with efficiency while increasing prices at a rate that exceeds inflation, even strong inflation. ”
In my opinion, they can only do that while the federal government is running gargantuan deficits that ultimately enable that level of spending.
“So, from my perspective, looking out 20 to 30 years nobody will win regardless of whether they hold cash, bonds or equities. Maybe precious metals, real estate and crypto will work out okay, but they are above my pay grade. You have to park your wealth somewhere. I don’t care about winning the most. How can I lose the least? I’m going with equities, or to be more specific, broad total market stock indexes. Good call? Bad mistake? Let me know what you think.”
Whether or not this works will depend on the federal government being able to borrow at reasonable rates, which then ultimately makes its way into the economy as the government spends that money (or gives it to someone else to spend).
There will come a time where the government, both Congress and the Treasury and Fed will have to defend the currency and the bond market or the asset bubble. They will not be able to do both. Right now, the bond and equity markets are priced as though they can do both. I believe that to be incorrect.
A rather simplistic view.
You’re assuming the whole world is the US. There’s lots of opportunities in the world beyond what you’re talking about e.g. countries with high growth demographics and economies over the next decade or more, whose markets will follow these up.
Also you’re looking at markets with too broader strokes e.g. with the equities sector there are industries with different growth trajectories going into the future, that may or may not be well valued at present, and may offer opportunities. Likewise different individual companies will underperform / outperform, and if you study the market you might pick these up.
So overall, you don’t have to be so gloomy and fatalistic about the markets. Try a bit of optimism and good old fashioned analysis and you may fo better.
Japan 1991.
Weird things can happen. Making predictions is hard, especially about the future.
Thank you Yogi
Not a reply of 1991 Japan. DDs relative to TDs have doubled.
For maximum yield with minimal risk, it’s hard to beat a balanced portfolio with rebalancing. Choose a risk level you are comfortable with (60/20/20 equities/bonds/cash is about right for someone in their 60s) and rebalance every year. 60/20/20 has averaged about 4.5% per year after inflation for the last 120 years, and the worst losses are roughly half that of the stock market as a whole. But anything involving stocks or bonds means that you can lose a lot over timeframes less than 5 years.
For minimum risk overall, money markets are the way. You’ll probably break even after inflation on average, but you can lose a fair amount slowly to inflation in some periods.
For lowest volatility, 30% stocks and 70% money market will give you 2.5%/yr after inflation and minimize periods with a loss.
BTW, you can definitely argue about specific things the government does. But if you take away the entire government tomorrow, there’s no value in this country at all. Just ask other failed states how well that works for business.
I wouldn’t take past results of a 60/20/20 portfolio and project them into the future, given we currently have record stock valuations, record profit margins, insane deficit spending and debts, etc.
I’d keep my stock allocation in the 20-40% range, and I’d only include value stocks with an international focus and dividend paying ability.
120 years of history that includes the Great Depression and the 2000-2009 period is a powerful precedent. Valuations were higher in 2000. Profits were almost as high in 2011 and were higher in 1929. Deficit spending and total debt was way worse during and after WW2.
Cash lost the most money vs inflation from 1939-1948. Bonds from 1976-1981. Stocks from 1929-1932. Despite the well-known >80% loss in stocks in the 1929 crash, a 60/20/20 portfolio was back to breakeven by 1933, if you had the guts to stick with it.
Of course, things could be different; they always can be. I’m not telling people what to do.
‘Deficit spending and total debt was way worse during and after WW2’
WW II is considered an outlier in terms of debt (and death) and not a usual benchmark for comparison.
Indeed, but it didn’t catastrophically affect the performance of the 60/20/20 balanced portfolio, which was the point.
When Reagan took office, the total debt of the US, including costs of Korean war and Vietnam, was one trillion dollars. Four years later, it was 2 trillion, and the new political (winning) mantra was ‘deficits don’t matter’.
With debt now at 33 trillion (last time I looked) and rising a trillion every few months the theory that this is old news and the financial future will resemble the past looks dubious.
You keep using absolute numbers instead of relative numbers. It looks bigger, but is far less relevant.
Here’s what that should look like:
When Reagan took office, the total debt of the US, including costs of Korean war and Vietnam, was 31% of GDP. Four years later, it was 40%, and the new political (winning) mantra was ‘deficits don’t matter’.
With debt now at 119% (last time I looked) and roughly unchanged since 2021 but projected to increase to 176% under the OBBBA, the theory that this is old news and the financial future will resemble the past looks dubious.
@Nick Kelly,
Federal revenue as a percentage of GDP is a little bit below the long term average, but Federal spending as a percentage of GDP is way up, under both of the last 2 Presidents. We have a spending problem and more revenue can’t fix it.
Numbers is probably right Nick. Using manipulated and spun numbers proves Reagan was one of the best presidents ever.
Guess that’s why he calls himself “Numbers”?
That’s my ignorant guess, anyway…..never took Econ…..actually never COMPLETED an Econ course….I started 2.
Again, let’s back out the biggest anomaly in history, WWII.
There couldn’t be inflation in US during the war because:
AI Overview
Yes, the United States implemented widespread price controls during World War II to combat inflation, establishing a comprehensive system of maximum prices and rationing through the Office of Price Administration (OPA). These measures limited the price of goods like food and rent and controlled how much consumers could buy, with the goal of preventing prices from rising too quickly due to the war economy.
Bureaucracy:
A vast bureaucracy under the OPA was created to enforce these controls and assess necessary revisions to price caps.
Success and Dissolution:
These policies were considered a success, as measured inflation fell, but they dissolved after the war ended, partly due to public dissatisfaction with ongoing shortages and controversy over the controls.
Feb 8, 2022
So a major clamp down, followed by huge release of backed up ‘animal spirits’: an anomaly.
An interesting measure of inflation: the price of a coke.
It was about 10 cents for 50 years, The small bottle out of the rotary machine at a gas station was 5 cents, but you had to leave the bottle.
Anyone watch those American (or Canadian) ‘picker’ shows?
A big area of collectables is the coin- ops of everything.
Up until the 50’s, some of them like the candy or nut machines
had the price CAST INTO THE METAL.
Can we assume the maker and buyer were used to very low inflation?
I can remember the first time a single coin wouldn’t buy a machine coke. You had to deposit a quarter and a dime. That would be around 1975, just after the ME war and the price of oil taking off from under 10 $ a barrel.
Chuckle… y’all act like we can’t go look up the numbers on the internet or something.
1) When NIXON took office in 1969 the national debt was $354 billion. Twelve years later when Reagan took office it was $998 billion… almost a three-fold increase even with the winding down of the Vietnam War. What can I say… Wars (hot or Cold) are expensive.
2) When Reagan and the first George Bush LEFT office twelve years later the national debt was $4.1 trillion ( a four-fold increase)… but the Soviet Union… a totalitarian dictatorship every bit as dangerous as Nazi Germany (if not more so since Russia could actually reach us with its weapons) was wiped from the Earth (as was always the plan with Reagan’s defense buildup)… and a “peace dividend” was bestowed upon their successors.
3) The Baby Boomer presidents should have been able to manage the Peace Dividend (as well as the booming economy in a low-inflation environment that Reagan and GHW Bush ALSO gave them) into ever declining National Debt to GDP ratios that would benefit us to this day. For a while they did… the divided government years of no wars from 1994-2002 kept the National Debt growth to only about 50%… $6.2 trillion
4) But then came endless wars overseas, health care spending increases, and ramped up spending chasing a “green” future that is pretty unlikely to materialize. By 2019 (before COVID) the National Debt had skyrocketed again over three-fold to $22.7 trillion. Thank God for the much-maligned “Sequestration” rules that Speaker of the House John Boehner enforced or that number would have even been MUCH higher. In gratitude Boehner’s own party ran him out of Washington on a rail.
5) Since then it has been “who let the dogs out”… in just five years the National Debt is now at $37.4 trillion and counting… up 65% with a roughly another $17 trillion expected by the early 2030s.
Bottom Line: Ronald Reagan’s college degree was in what is now called “Classical Economics” and he had a life-long interest in economic matters… both as a Democrat and then later as a Republican. He NEVER said ‘deficits don’t matter’ for the simple reason that he never believed that. It is laughable to think otherwise… unlike ANY of the Presidents who came after him, he would be spinning in his grave at the thought of a National Debt approaching $40 trillion. Feel free to read the last chapter of his autobiography where he details what remained undone in his administration if you don’t believe me.
Instead, Reagan was faced with a unique set of problems when he took office (high inflation, low economic growth, the threat of nuclear annihilation by an avowed enemy, rising national debts) and (like all presidents) had to prioritize.
Ronald Reagan and George HW Bush handled the first three priorities VERY successfully… they left office with an America that had low inflation (lasting 40 years until recently), high growth, and no external national threats. Even after successfully finishing off the Cold War and the first Iraq War, the National Debt to GDP ratio was only 63%… today it is 120%.
That his Baby Boomer successors fumbled the ball on Reagan’s final priority isn’t HIS fault… it is theirs… and OURS for tolerating their continued failings for over 30 years now.
Gold up 24% in 2024. So far Looks like 2025 might be as good or…?
If Trump really gets control of FED…?
BTW: gold just overtook US $ assets as other countries’ central bank reserves for first time since 1996. .
Gold pays 0% in dividends.
reply to numbers ; actually, valuations of the S & P are significantly higher today than they were in 2000 and somewhat higher than in 1929;
P/E 10 (price to 10 year average earnings) was 42-44 from 1999-2001 and was 33 in 1929. It is now 38. Perhaps a trivial difference, but a difference nonetheless.
You need some diversification. Try some gold/silver. A few plots of land, especially if they yield something. Even some non government bonds here and abroad. A vacation home might help. Inflation is here to stay, get used to it
Thomas,
Consider investing in AcreTrader. The managers have an INCREDIBLE amount of business “acumen”, and Wolf would be the first to tell you good management is critical, and I agree, even though I have always been a worker bee and at odds with them…..all by choice….wanted to use hands AND brains.
I don’t have enough to make it worthwhile investing in anything but my CD, but am an awfully good downsizer and quite happily retired…..although my back has made me an invalid for all practical purposes. Still can run my own life thanks to my ability to tolerate pain, and a few weak pain pills, and prior and continuing healthy habits.
Plus MUCH bio knowledge and a lifelong love of learning.
PSA:
Are you overweight? Do you smoke? Are you diabetic? High blood pressure? Gambler? Drink alcohol? Can you walk 30-60 minutes without stopping? Can you touch your toes? Drugs? How is your memory?
Do you have a loving partner, family, and friends? A dog?
Since you are asking anonymous folks for advice, mental and physical
health are greatest forms of wealth. Obviously, you do not have enough
money if you are worried about shit you can not fully control. So what can you control?
The problem with older people is that they do not know that we are near the finishing line and our main goal is not to cross that finishing line as long as possible. Better ways to use your remaining time 60+ year old dude. I am going on a hour walk with my wife. Good luck.
“…that we are near the finishing line and our main goal is not to cross that finishing line as long as possible.”
🤣🤣🤣❤️❤️❤️
I’m game. Yes, no, no, no, no, yes, yes, no (I’m overweight dammit), no, great (according to my wife who says I’m a vast store of useless knowledge), yes, no (but I do have a black cat). I do know acutely that I’m nearing the finish line and constantly think about how to structure the final 1, 2, or perhaps 3 remaining decades of my life.
One important question you missed, but you obviously know it’s important, is: do you walk regularly with your spouse? Emphatically yes!
To KnowledgeIsPower – Whew, I guess I did invite nasty replies in my original post. You sure did give me one. Reminds me of that Danny DeVito scene in “Matilda” where he lectures Matilda: “Listen, you little wiseacre: I’m smart, you’re dumb. I’m big, you’re little. I’m right, you’re wrong and there’s nothing you can do about it!” Have a nice day.
Don’t sweat it…keep posting. I’m almost 79 and see NOTHING wrong with your post or the replies. Who cares what people (besides Wolf) here think of you, anyway? As Wolf told me when chewing me out, “This is not Social Media”…..if you want that go to FB.”
Agree but had to look up PSA…..thought it was someone here….hate that crapp. Why not say,”To All”? Is all that out of texting….another idiotic pastime except for cheating in class……my sister taught 7th 25 yrs and said they were unreal good at it……and she was unreal good at spotting it.
Permanent Portfolio Fund (an inflation tilted variation on Harry Browne’s invention in his 70’s book) has served us well for 40+ years.
Excellent reporting on CPI — but, unfortunately the markets ambiguous reaction is amplifying economic uncertainty to new insane levels.
Inflation higher + stocks higher + long treasuries down — in addition to the new mkt dynamics, where Oracle can miss earnings and be
mega-rewarded for engineering and fabricating a narrative, that isn’t dependent on data (or reality).
The actual persistent, sticky inflation from the post-pandemic era, is diverging from both the deficit and interest servicing costs — as economic data drifts towards irrelevance. The data dependent Fed is obviously compromised.
The overall uncertainty is growing with rising inflation and ultimately, a collision with reality lies not too far ahead.
It looks like a lot of money may be moving out of a very fragile Europe to the US.
Re Fed policy, we have come a long way from “stable prices”. Now 2% seems the floor. One might think a little deflation would be welcomed after the last 4 years. The 2% trajectory trend line is way below where we are currently.
Telling, very telling about the Fed.
Enter: German govt debt vs US
Source on money moving out of European equities? I think it’s been the other way around for the first time in decades.
The Fed will cut another one, in the face of rising inflation. This should stoke inflation, and like Cassandra said, we will all be happy buying 6% Treasury bonds next year. As for employment, nobody knows. The jobs numbers are too screwy. But let’s have a bout of stagflation. It’s okay with me, I am not a member of the labor force.
Based on the Fed’s past history, we know one thing for sure. They will make the wrong decision.
I’ll never forget the farmer who lived near the Mississippi river who unlike many unfortunates, never got flooded. When he was asked about his luck he said, ‘whatever the US Corps of Army Engineers suggests I do, I do the opposite.’
Its only the wrong decision if you believe in their mission as published.
It is perhaps another mission….like monetizing the debt….dropping rates before huge Treasury auctions.
If they truly believe 2% inflation is “acceptable”, then we are clearly at “unacceptable” price levels by their own metrics. Up 25% in 4.5 years is not 2% a year. They should be promoting LOWER prices to get down to their own “goal” of 2% a year. They are not.
My gross revenue is up by 6.5% this year. Sounds good until you look at my COGS up 14%.
Not really hard to see that both parts of Fed mandate would move in wrong direction. I think the idea that reducing borrowing costs will positively impact the slowing labor market is equally a fantasy. Not everything can be solved with borrowing rates changes nor should that be an expectation.
I wonder what the vote at the Fed might look like if it were anonymous?
Waller for FED!!!
More QT, Lower Rates.
Please
LOL, what????? Never thought I would see someone in the wild want to accelerate inflation. Or maybe you did not read the article and definitely not the headline and instead just the comments?
AV8R’s comment makes sense:
The Fed only controls overnight rates directly. Continuing QT should push up rates on duration.
With the 10-year at 4.06 the yield curve is basically flat.
Lowering overnight / Tbill rate brings down the short end while increasing coupon yields (via QT) bring up the long end.
Lower rates accomplishes what?
More employment? It reverses govt layoffs and AI impact? Nope.
It pumps asset prices under the guise of helping the masses and their employment.
Record high stock prices, real estate, insurance, food, shelter, gold……and 4 years of high inflation…..and they are supposed to cut?
When do you tighten?
Looking at the list of Core Services components, I can’t see that the Fed changing rates by a small amount one way or another will make any difference to them. They are not sensitive to the cost of money because they can pass on their costs. The only thing that might stop those prices from rising is falling demand, caused a large increase in unemployment. We are not there yet.
Right – I’ve said this for the last 2 years. Inflation only stops with a reduction in demand unfortunately.
Inflation only stops with a pause in the growth of the money supply, or a reduction.
Longer term (5 years or more), what is the potential for “AI” to reduce real (inflation-adjusted) costs to consumers over time (within the category of “AI” I would include various forms of advanced automation, i.e. “robotics”)? There is this spinning up of an “AI revolution” with lots of investment, and one would think that eventually it would reduce costs to consumers, but maybe not, or other factors would far outweigh the benefits of “AI” in holding costs down, with the benefits passed on to consumers.
For all of the “AI” hype and investment, what will be the outcome? It feels akin to the “Internet” hype and investment in the mid- to late-1990s, and it being “revolutionary” but then turning out to be relatively minor (although it generated a lot of concentrated wealth). Did it bring down real costs to consumers via new levels of efficiency? In ~25 years it does not feel like anything has changed, so I am wondering if “AI” will also be a “nothing burger” in terms of real cost containment for consumers?
If it makes the robots cheaper than the Asian, Indian and Mexican workers it could possibly reduce costs with products made at home. The promise of AI I think is it speeds things up so research, discoveries and inventions could help the economy. Remains to be seen. Will driverless cars lower the price of a ride to the airport. Maybe.
What would you rather own for the next five years; ten thousand dollars in cash gold or ten thousand dollars in cash dollars? Just thinking about this should be helpful.
By the way, I love the idea of QT and lower interest rates. Really thought provoking .
Neither. If I’ve got $10000 I want to actually put it to productive use.
More seriously, gold could serve a small part of a balanced portfolio, but check out a chart of inflation adjusted gold price sometime. It can go down and stay down just as much as anything else, with much more volatility.
More than Dot.com? For sure not more than AOL. But AOL did one very smart thing: it bought/ merged Time Warner with its stock. A year later the AOL portion was written down to zero. Then the name followed.
Why did healthcare and services go down MoM? They say that very soon insurance premiums, deductibles and co-pays are going to go up a lot. The cost of drugs and everything related is projected to go up .
Look beyond the month-to-month zigzags. They’d jumped by 0.56% in June and by 0.79% in July, and in August, they gave up a hair of that spike and dipped 0.14%. So over those three months combined, they jumped by 1.2%, or nearly 5.0% annualized.
“ CPI Inflation Dishes Up another……sh___ sandwich.” Uh, no thanks, I’ll pass. I’ve got somewhere to go. Be back later!
Sad thing is this – we can’t avoid what’s being dished up whether we like it or not. It affects everyone (except the very wealthy). Everything you buy will cost you more. And we don’t get $110 Billion dollar pay raises in a day.
To the clowns calling for interest rate cuts – are you people clueless? Low rates (near ZIRP) are what got us into this mess. It created the everything bubble. More poison is not going to cure the illness. It will make things worse.
You can try to put out a fire with gasoline, but the effects will not be what you are hoping for. 🤔
Interest is the price of credit. The price of money is the reciprocal of the price level. The FED should cut policy rates while draining bank reserves, i.e., accelerate QT.
It’s stock vs. flow. As the proportion of bank-held savings declines, the velocity of circulation increases, i.e., AD rises. The 1966 Interest Rate Adjustment Act is the paradigm.
“Whereas time deposits were 105 percent of demand deposits in July, by the end of the year, the proportion had fallen to 98 percent (forcing savings back to work, completing the circuit income velocity of funds).
Not only was the flow of savings through the Savings and Loan Associations and the Mutual Savings Banks stimulated, and more funds made available for housing construction, but these developments had a favorable effect on bank profits.”
“The FED should cut policy rates”
4.5 years and 25% inflation
unemployment STILL historically low
Inflation STILL above the “target”
Stocks, gold, food, cost of living…all time highs
2% per annum inflation trajectory since 2021 is well below (16pts) where we are now.
If this is a time to cut, when is the time to raise rates?
The price of credit is expected to remain elevated, if not increase, in late 2025+ — there’s a feedback loop dynamic related to the eventual implementation of tariffs (currently causing hyper uncertainty) — and then of course, biblical deficit issues and debt service costs, lingering, sticky inflation and biblical negative sentiment. We’re getting the rates we deserve.
Long-term rate = Average expected short-Term rates + Term premium
Short-term rates will remain elevated due to the payment of interest on reserves, using interest rates to manipulate prices.
The Term premium will remain elevated due to higher rates of change in N-gDp.
Price Level Charts are the best. Thanks Wolf. A few observations:
– Most people have to deal with the 20-30% increase, especially as a percent of income.
– Yes, the curves are bending (disinflation?) for cars, gas, eggs, etc. It’s, scary, amazing and probably good.
– Why are the price level curves bending? Could it be the “market”, the consumer, or maybe QT?
– Thanks for stretching the timelines so we can continue to see the pre-Covid “baseline”.
I’m truly amazed that we actually have disinflation in some sectors. Not surprised that it doesn’t get talked about in the MSM.
Maybe it’s time to hide in cash until something snaps?
Thanks again, Wolf.
And the (inflation) monster in the room is –
HOUSING. Maybe not in the last few months, but when housing increases 50-100% in the last 5 years, it takes a major toll on the monthly income.
The Great Housing Abomination – we’re living it.
Oh so not only was “average” inflation targeting a bunch of BS so is the 2% target wow I’m shocked.
So it sounds like we’ll get a steepening of the yield curve. 3 month tbills will drop and 10 and 30yr treasury will rise (in theory). So what does this actually mean???
For mortgages and the housing market, no drop in mortgage rates?
For CRE? What’s the typical financing term?
And for businesses, I’m trying to remember the typical length of debt. Revolving lines of credit probably come down a bit in interest so good for employment. Corporate bonds are longer term so no help for companies there, if the risk free rate is higher cost of debt is higher.
Who’s the winner or lower short term rates?
Maybe the stock market, as rates drop people chasing yield move out of money markets and into stocks?
Any other winners of lower short term rates?
Coffee Price increase of more than $2/lb. in 1 yr is partly due to world’s largest producer, Brazil being tariffed at 50% because Trump wants his buddy to walk free. This despite copious documentation of Bolsonaro plots to assassinate judges and worse.
i suppose mammal meat prices can’t rise enough for people to realize they shouldn’t eat animals with a consciousness similar to Fido or Fluffy
Nah, lots of coffee produced all over the world. No one needs to buy Brazilian coffee.
The problem with coffee prices goes back four years. Look at the chart I gave you.