Amazing turn of events: From desperate “housing shortage” to massive inventory pile-up in four years.
By Wolf Richter for WOLF STREET.
Inventory of existing homes for sale in Texas jumped by 24% in July year-over-year, by 73% from July 2023, and by 208% from July 2021 – the period of inventory depletion – to 140,980 homes, the highest in at least the decade of data from Realtor.com. Compared to the Julys in 2017-2019, active listings were up by 32-37%.
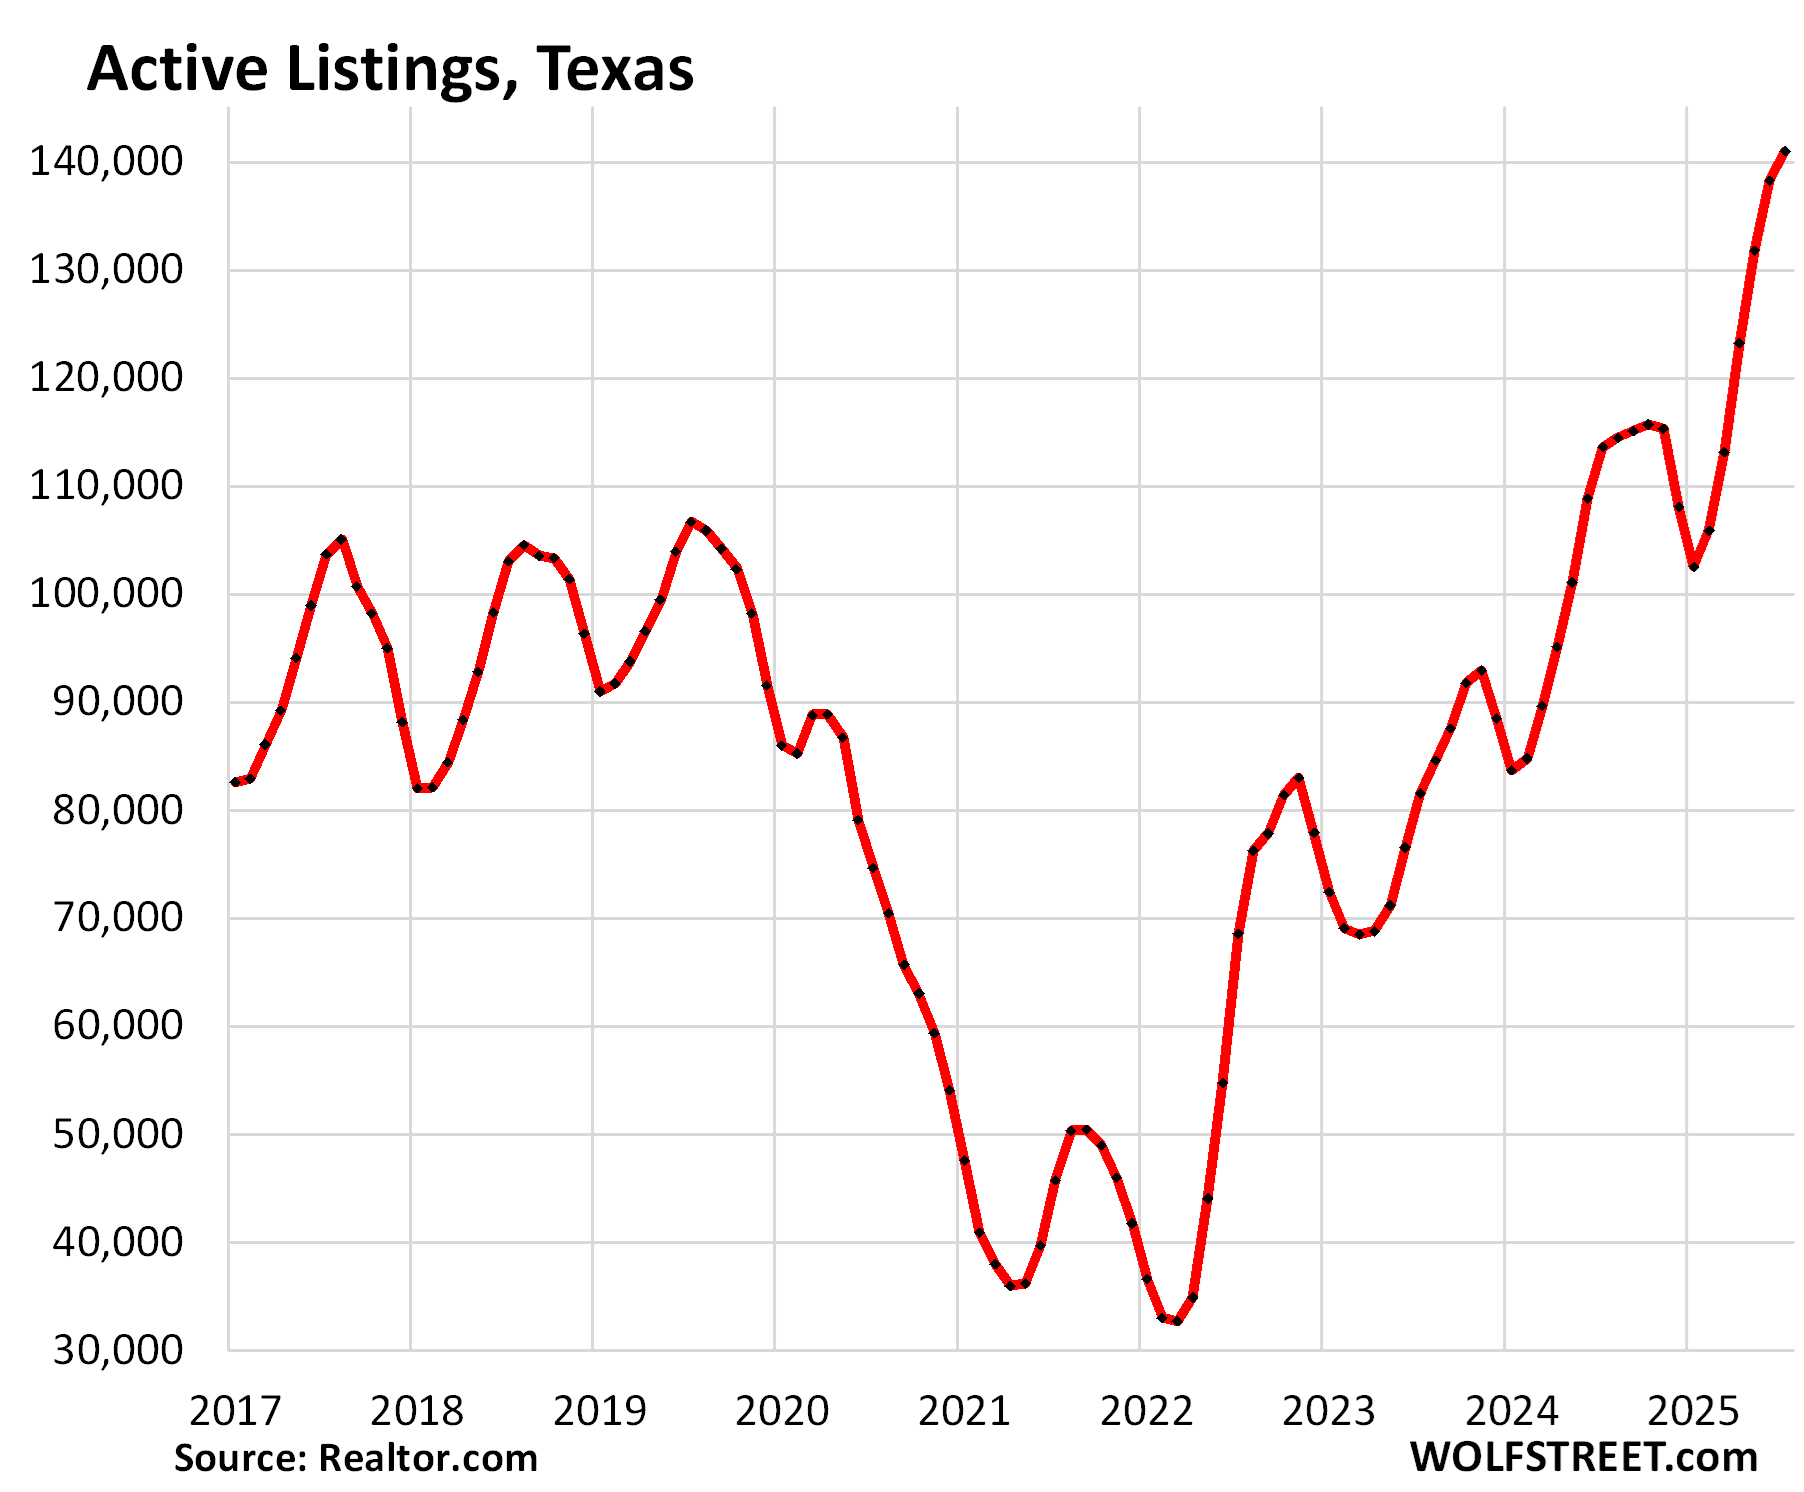
What a turn of events after the housing frenzy in 2020 through the first half of 2022, when inventory plunged to very low levels! At the time, enough buyers with access to cheap mortgages, and seeing the price-explosion underway, bought a new home and moved into it without putting their old home on the market. The goal was to ride up the price-explosion all the way up. The result was that inventory collapsed.
Now the buyers are gone because prices are too high, while some of those homes came out of the woodwork, inventory piled up and sits.
The median number of days that a home sits on the market before it gets pulled off the market or is sold jumped to 60 days in Texas, the highest for any July in the decade of data. The runner-up was July 2024 with 55 days.
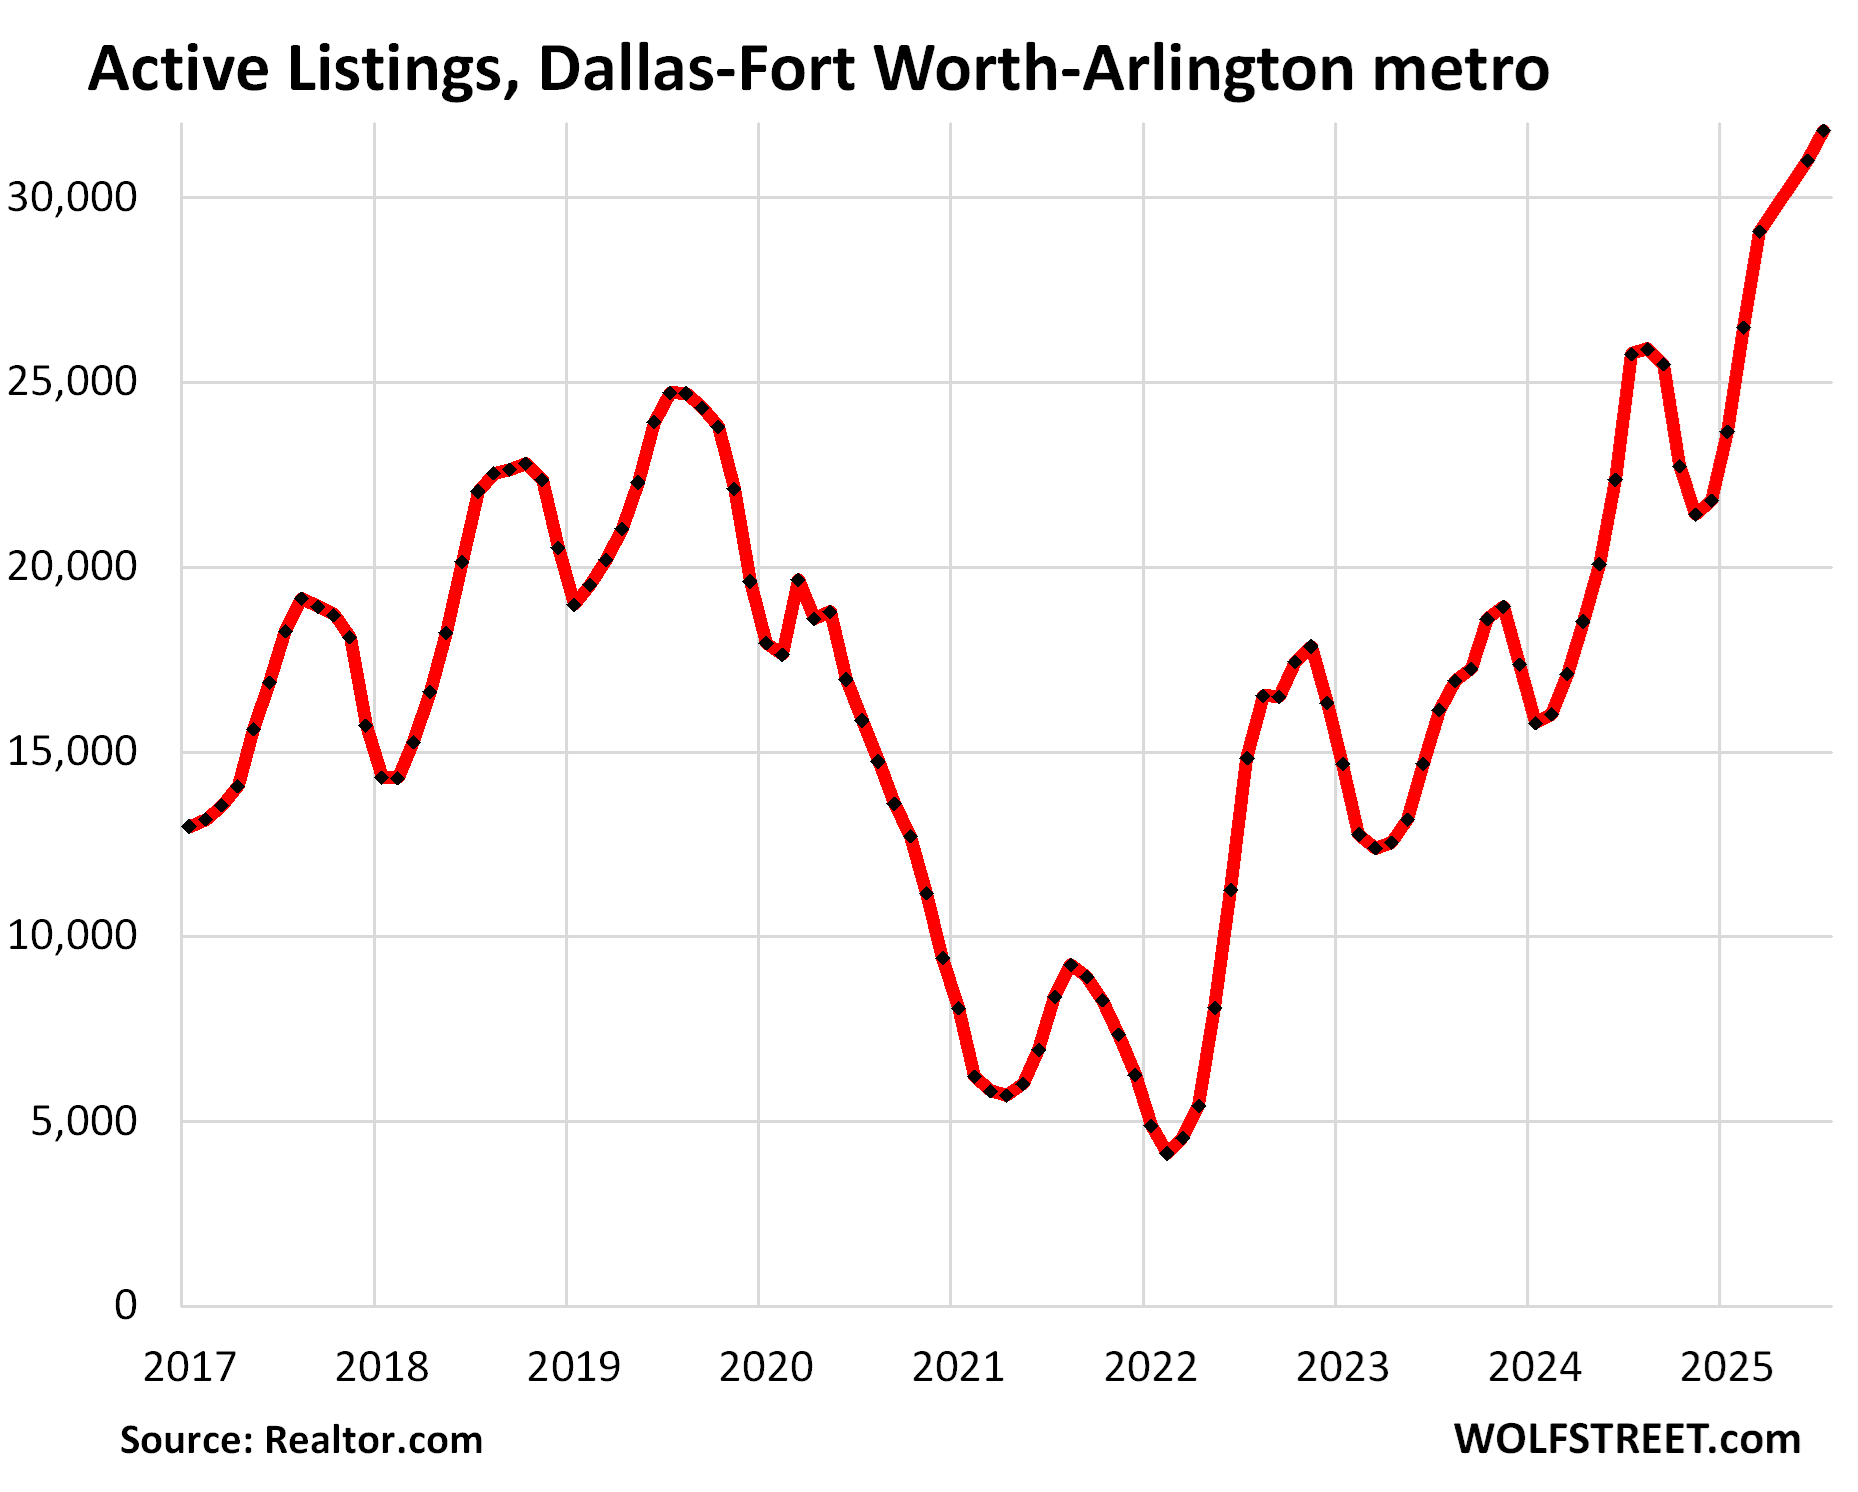
In the Dallas-Fort Worth-Arlington metro, active listings spiked by 58% year-over-year, by 142% from July 2023, and by 430% from July 2021 – the period of depletion – to 31,819 homes, the highest in at least the decade of the data by Realtor.com.
Compared to 2017, active listings are up by 104%, compared to 2018 by 75%, and compared to 2019 by 43%! Summers are the seasonal high points in terms of inventory.
During the final paroxysm of the buying frenzy in early 2022 – it began dying in mid-2022 – active listings dropped below 5,000, which was essentially near-zero for a huge housing market like the Dallas-Fort Worth metropolitan area.
The median number of days that a home spent on the market before it sold or was pulled off the market jumped to 53 days, the highest for any July in the decade of data.
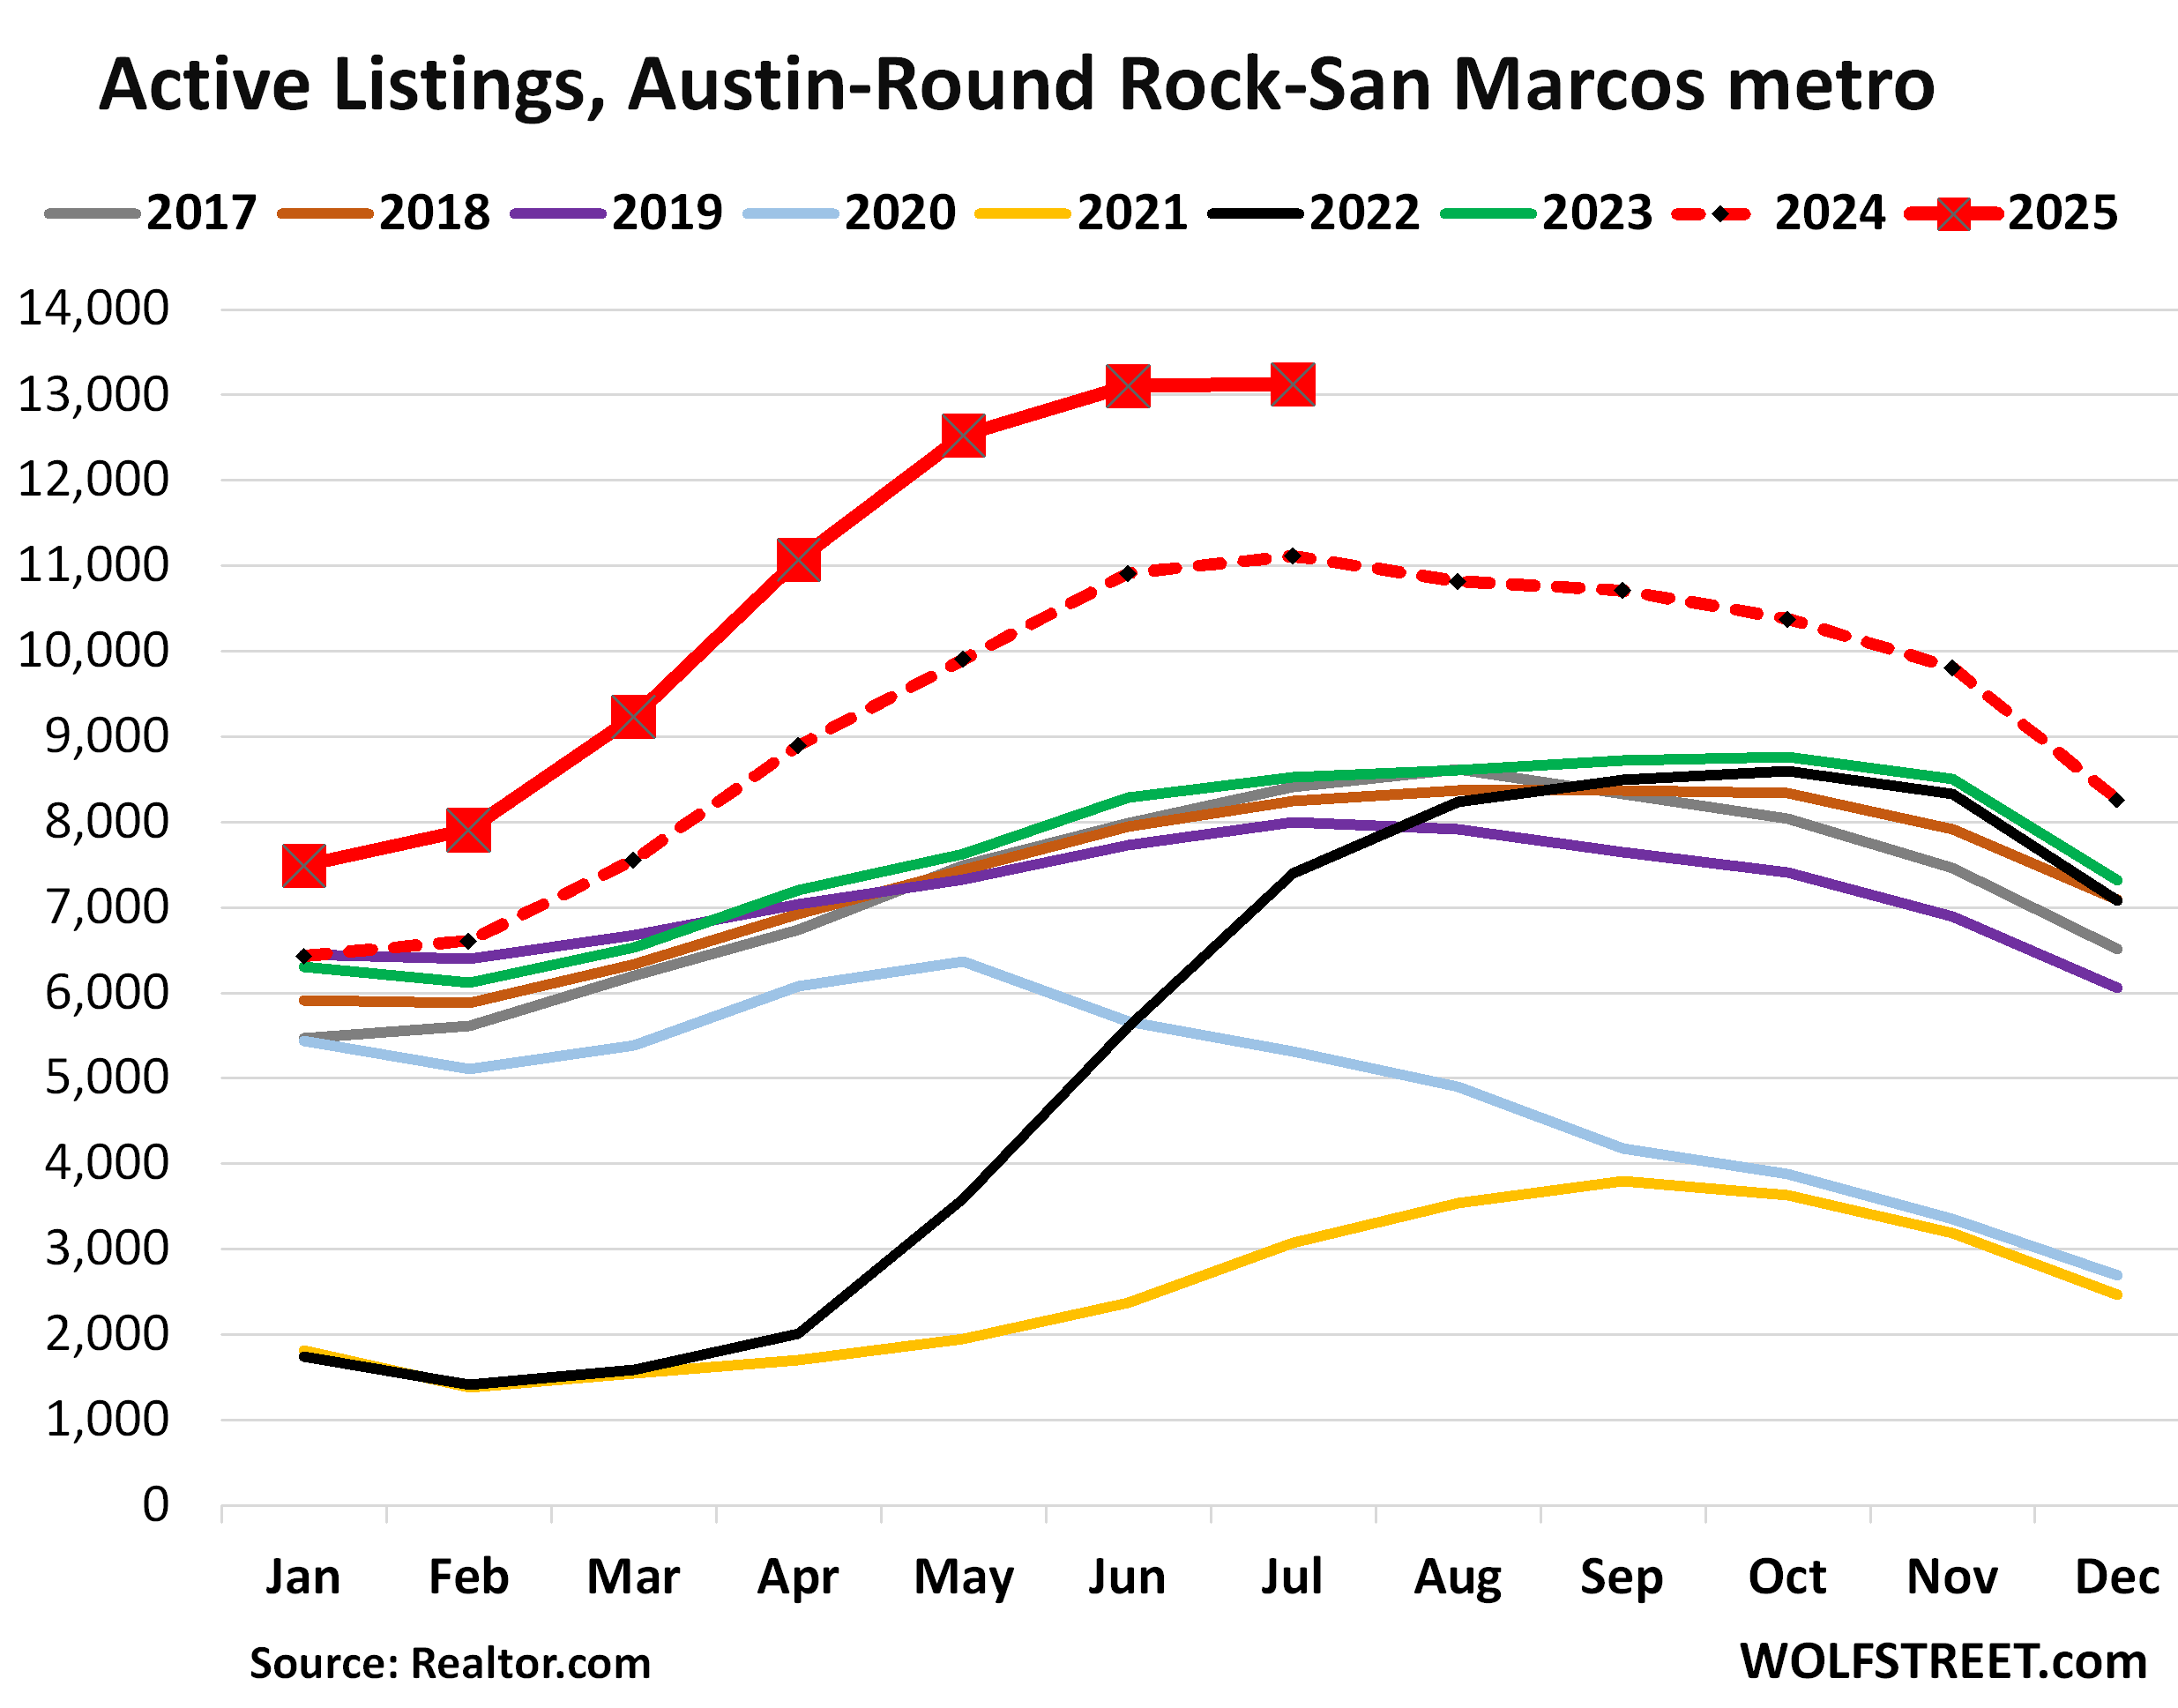
In the Austin-Round Rock-San Marcos metro, active listings jumped by 18% from July last year, when inventories had already carved out a record in the decade of data from Realtor.com; and by 327% from July 2021 when the buying frenzy had depleted inventories; and by 64% from July 2019; to 13,123 homes, the highest in the decade of data by Realtor.com.
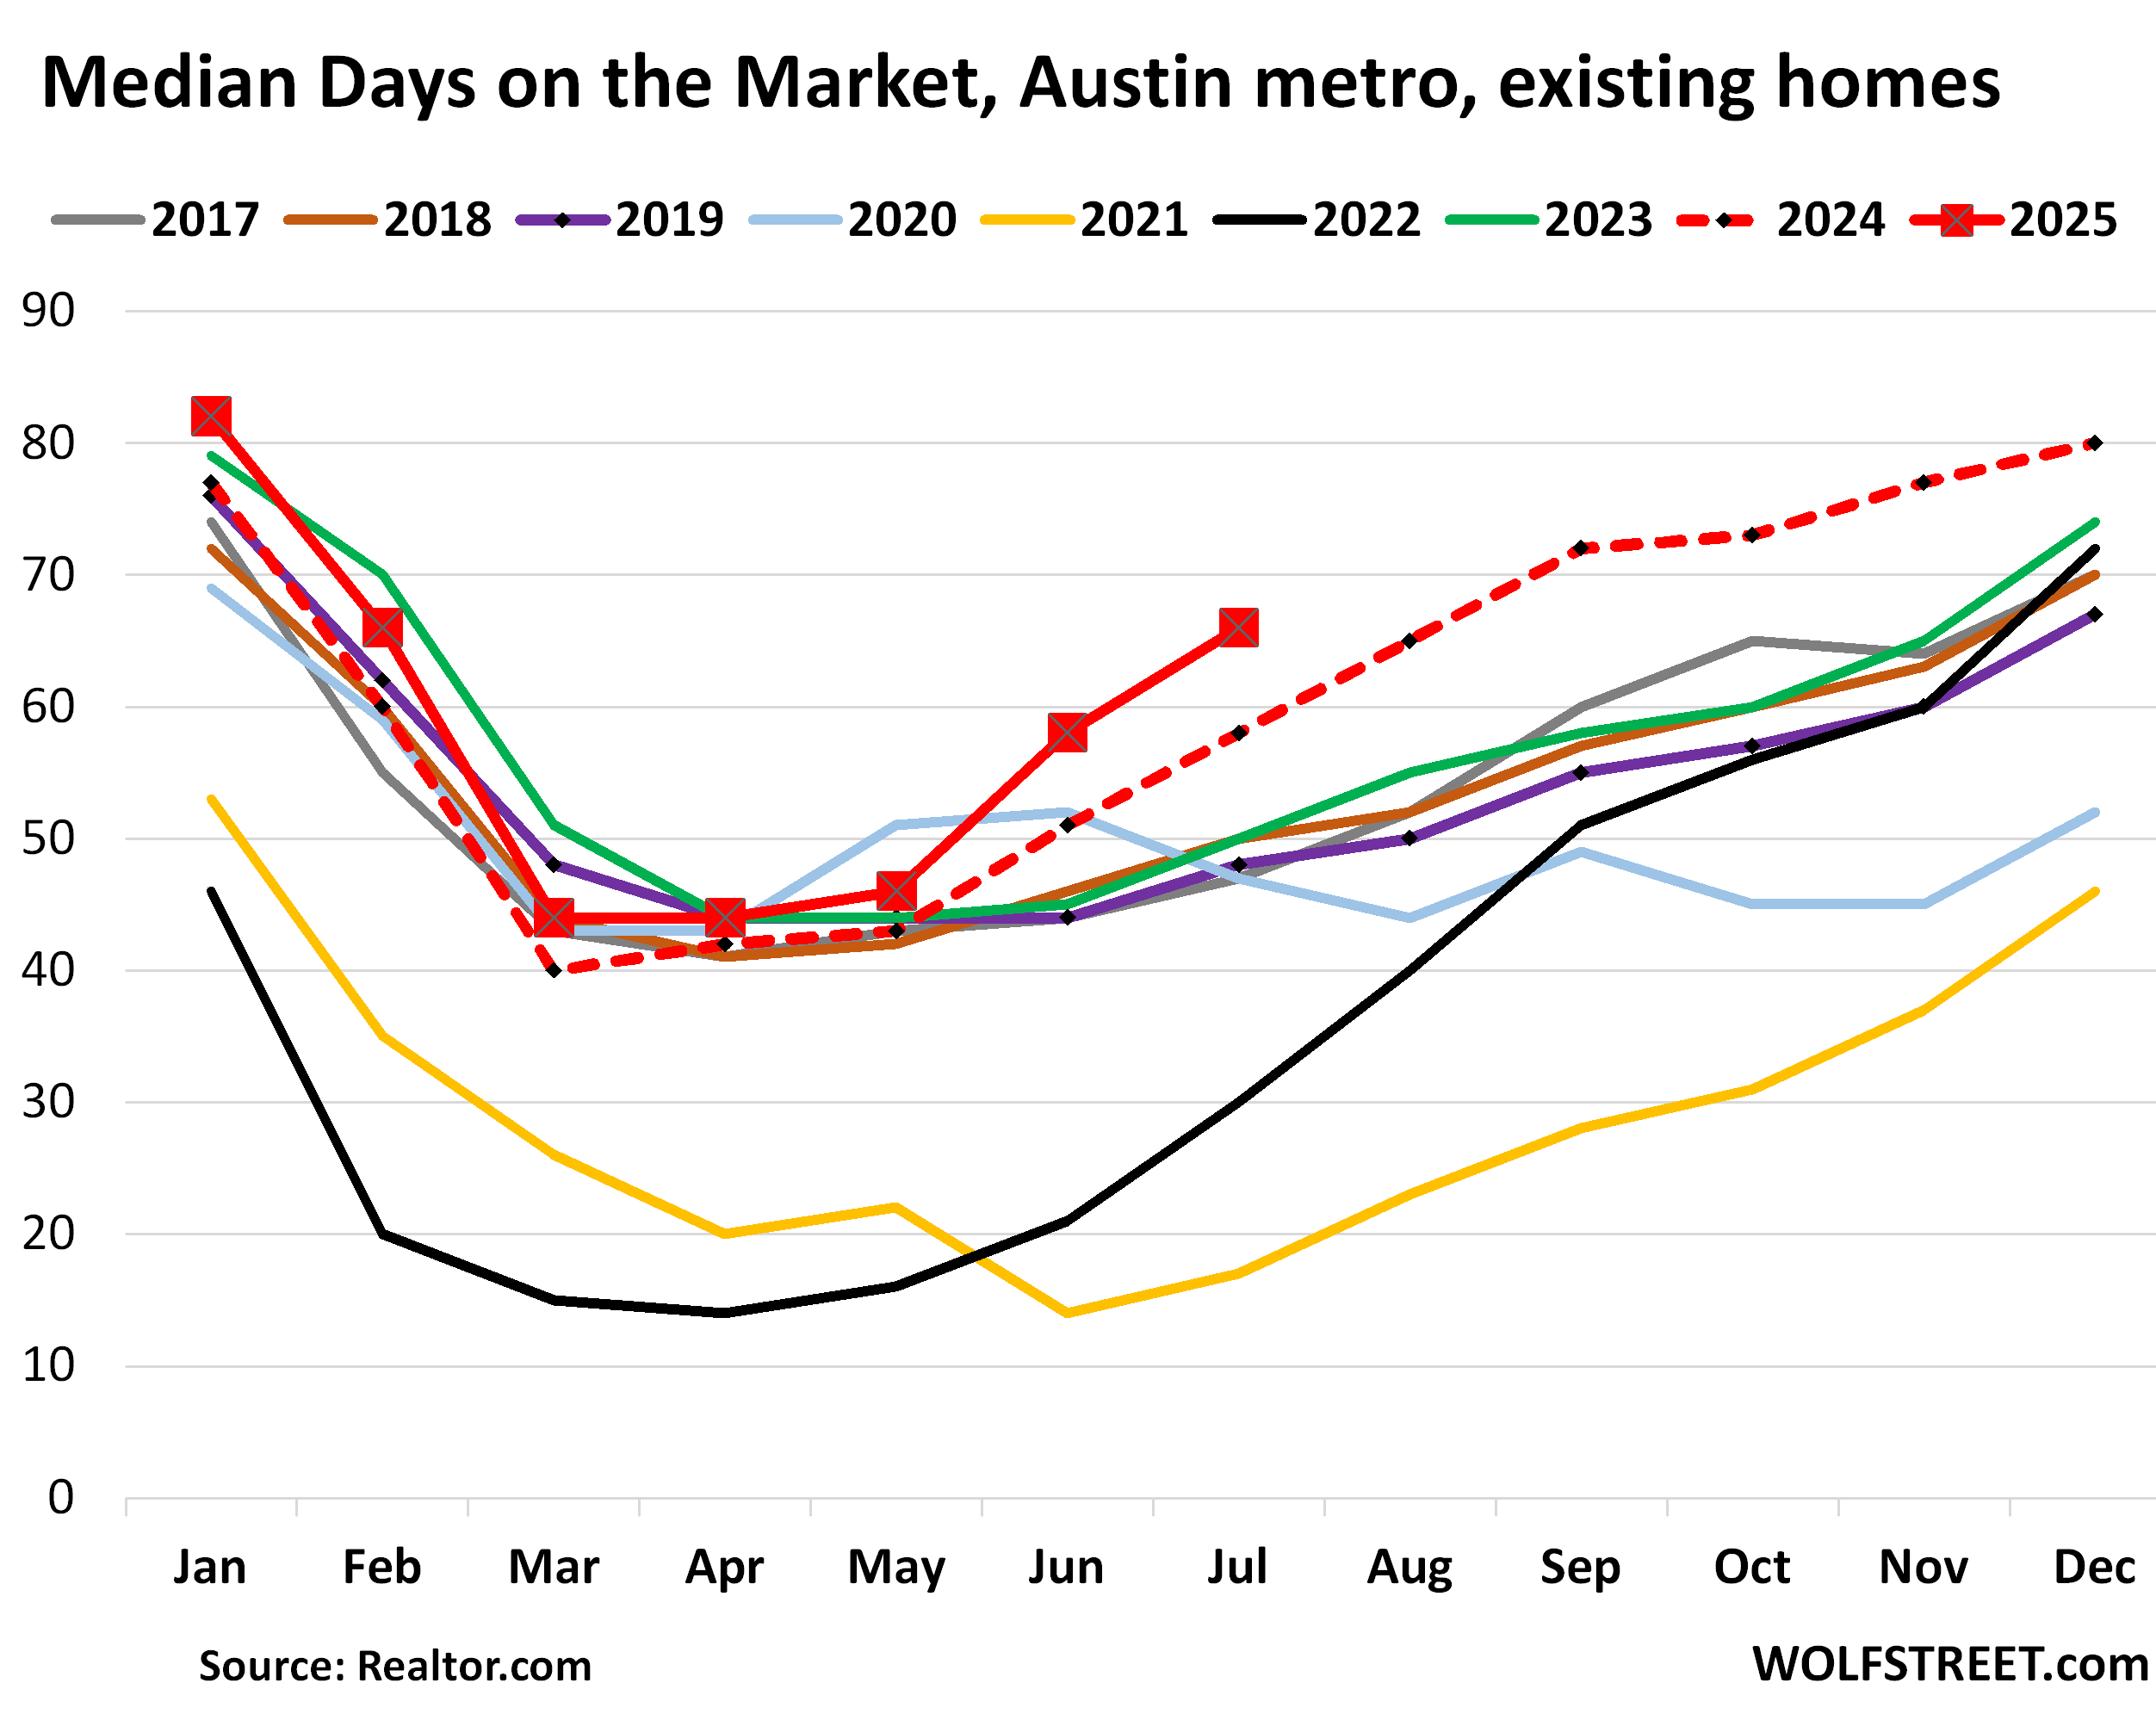
The median number of days a home spent on the market before it sold or was pulled off the market jumped to 66 days, the highest for any July in the decade of data.
Home prices are skidding lower across Texas, but the Austin metro is ahead again of the other big metros in Texas. From mid-2019 through mid-2022, over those three years, prices had exploded by 78%. Since then, transaction prices in the Austin metro have dropped already by over 23% from the peak, having given up now roughly half of the 78% three-year price explosion.
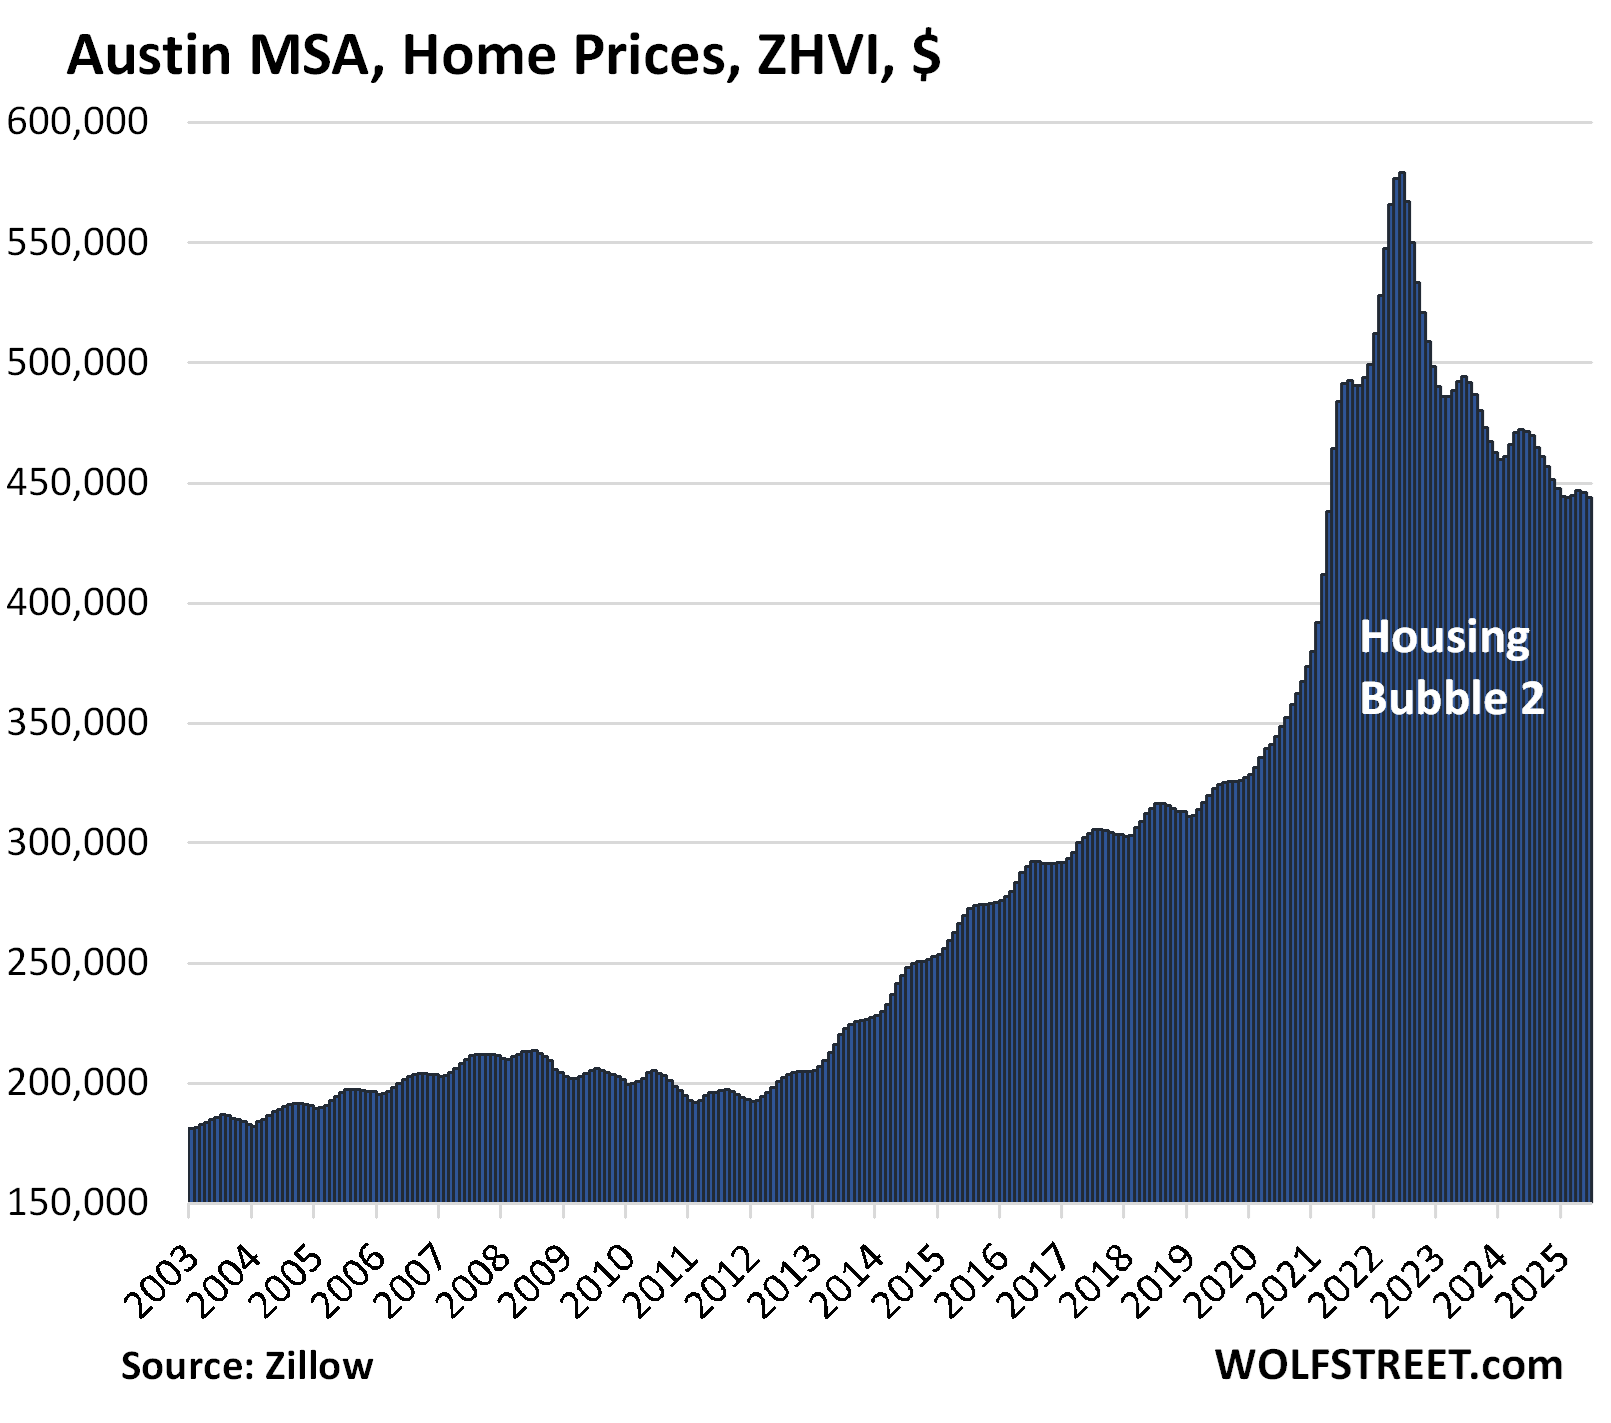
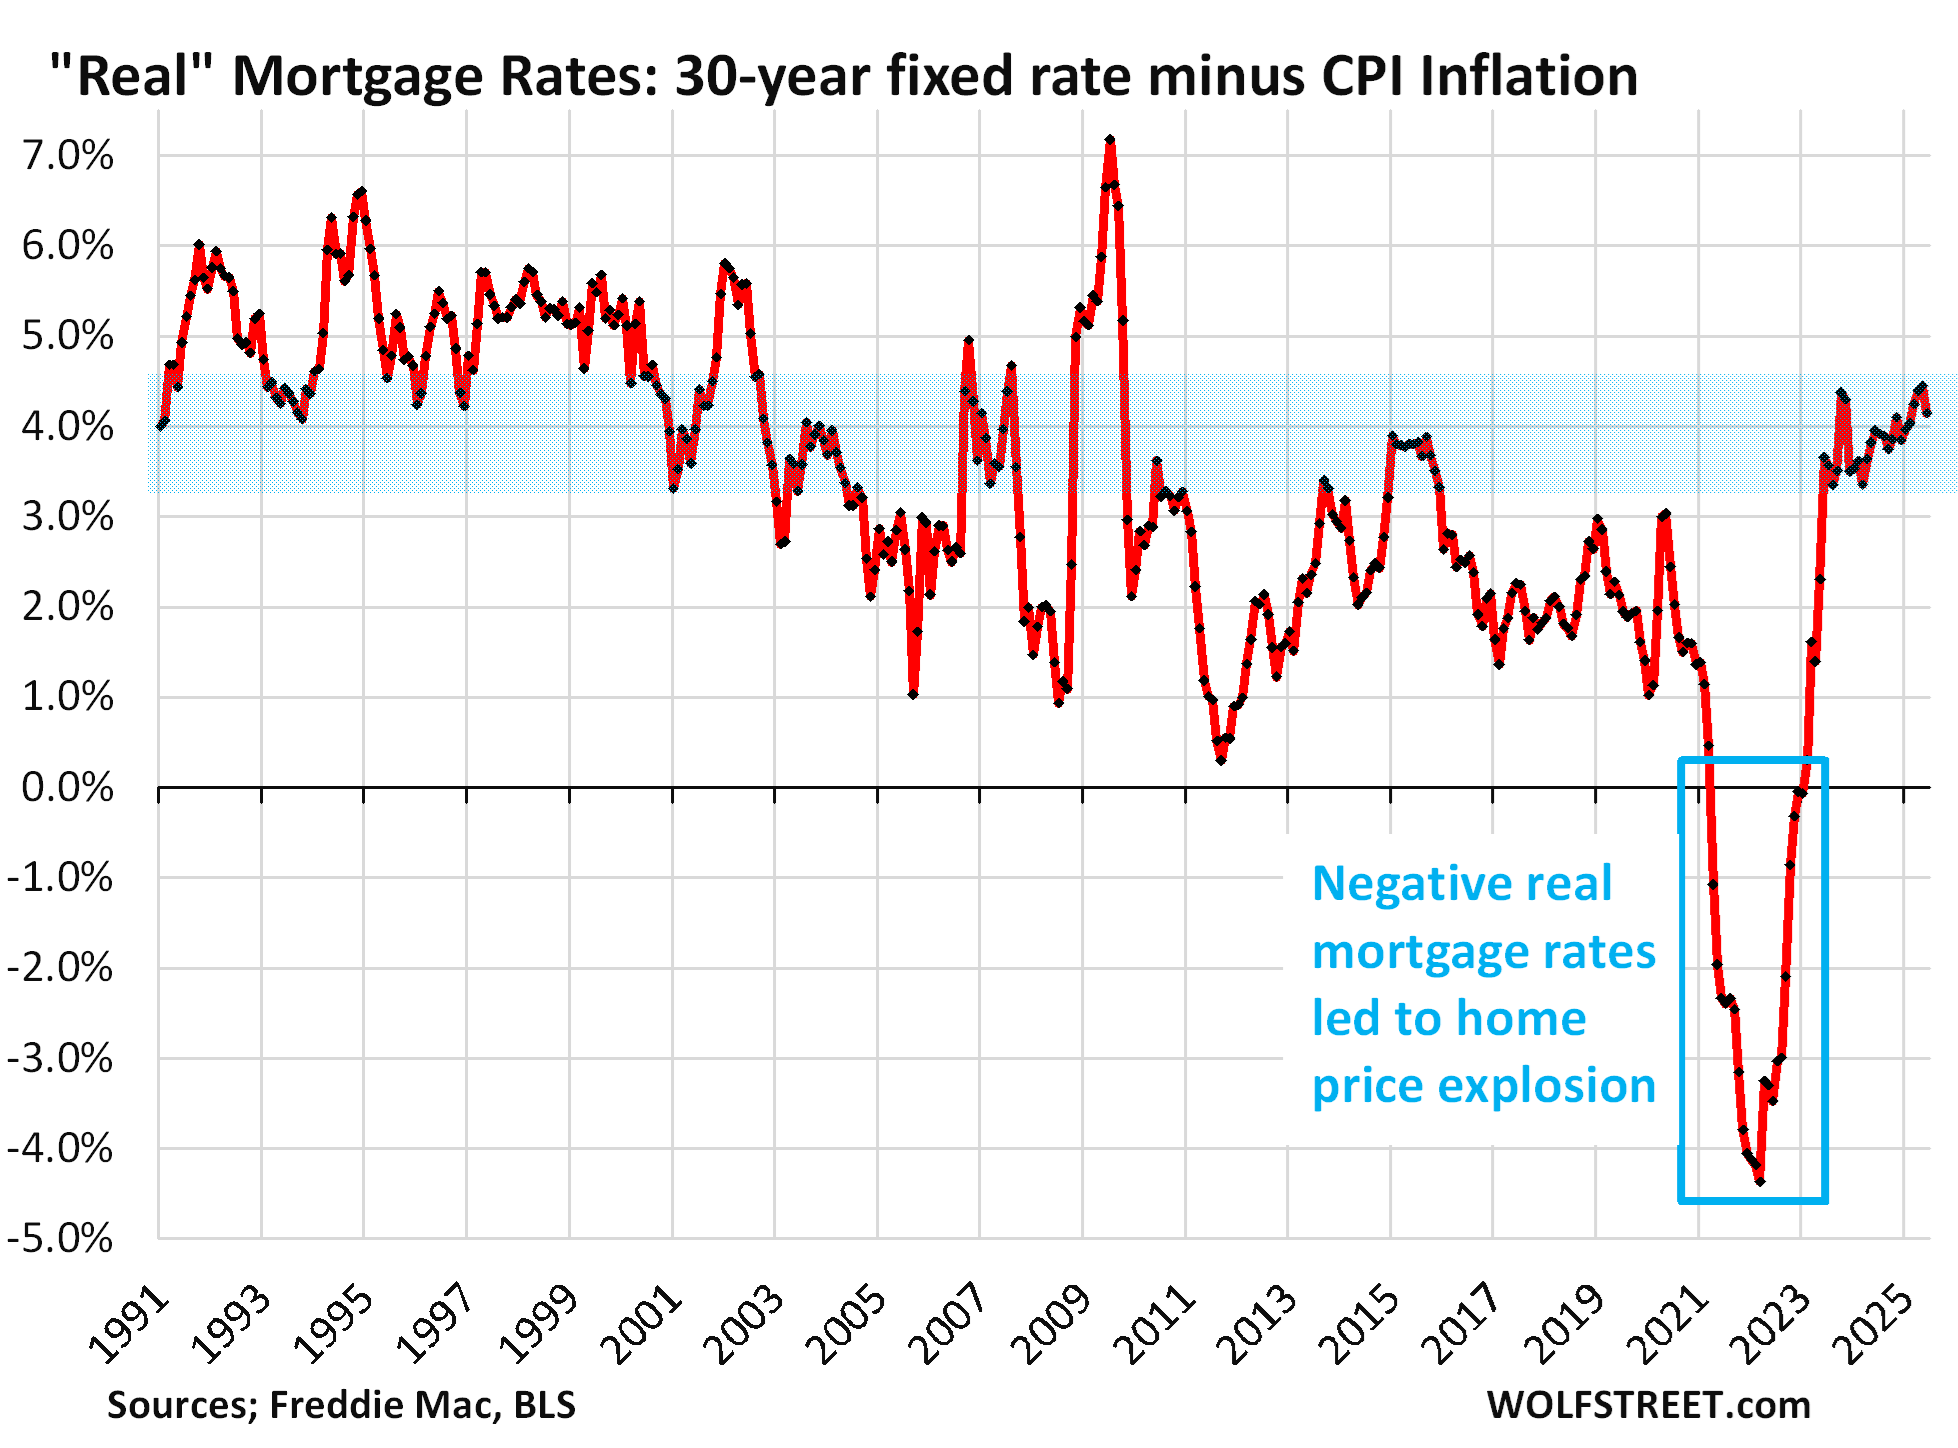
Housing price explosions like these – in Austin, 78% in three years – are indictments of the Fed’s monetary policies whose interest-rate repression via near-0% short-term rates and trillions of dollars of QE to push down long-term rates, flooded the land with liquidity and pushed down mortgage rates far below the rate of inflation (blue box in the chart below).
These negative “real” mortgage rates – mortgage rates minus CPI inflation – were as close to free money as it gets, and when money is free, prices no longer matter, and people pay whatever, and prices explode. And now there’s the hangover from those policies.
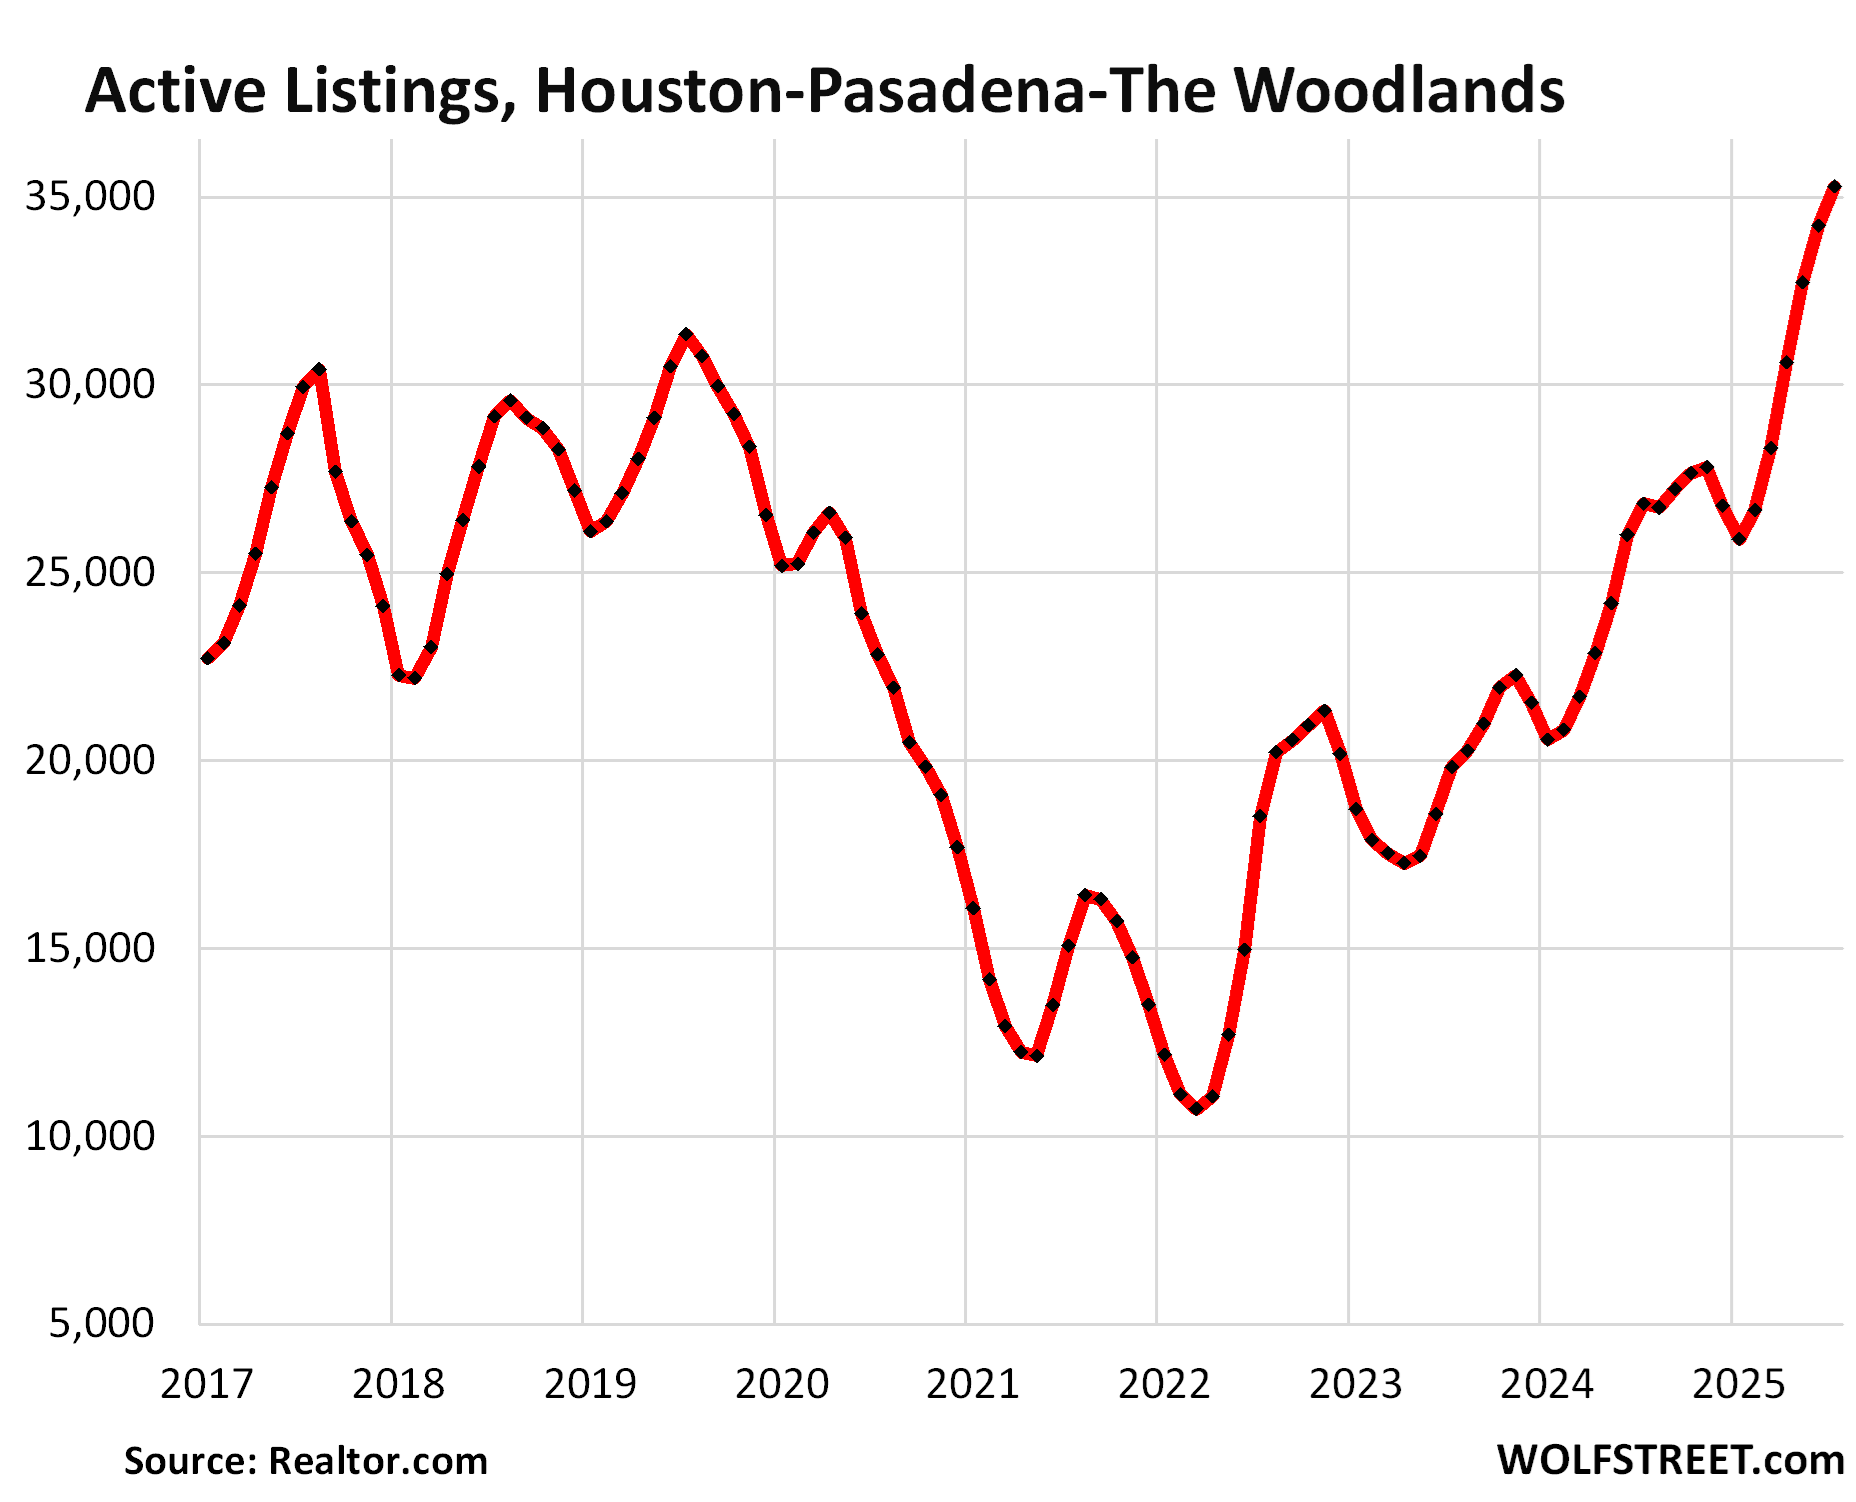
In the Houston-Pasadena-The Woodlands metro, active listings jumped by 31% year-over-year, and by 78% from July 2023, to 35,273 homes, the highest in the decade of data from Realtor.com.
The median number of days on the market before the home got pulled off the market or was sold rose to 50 days, right there with the years 2017-2020 (51 days).
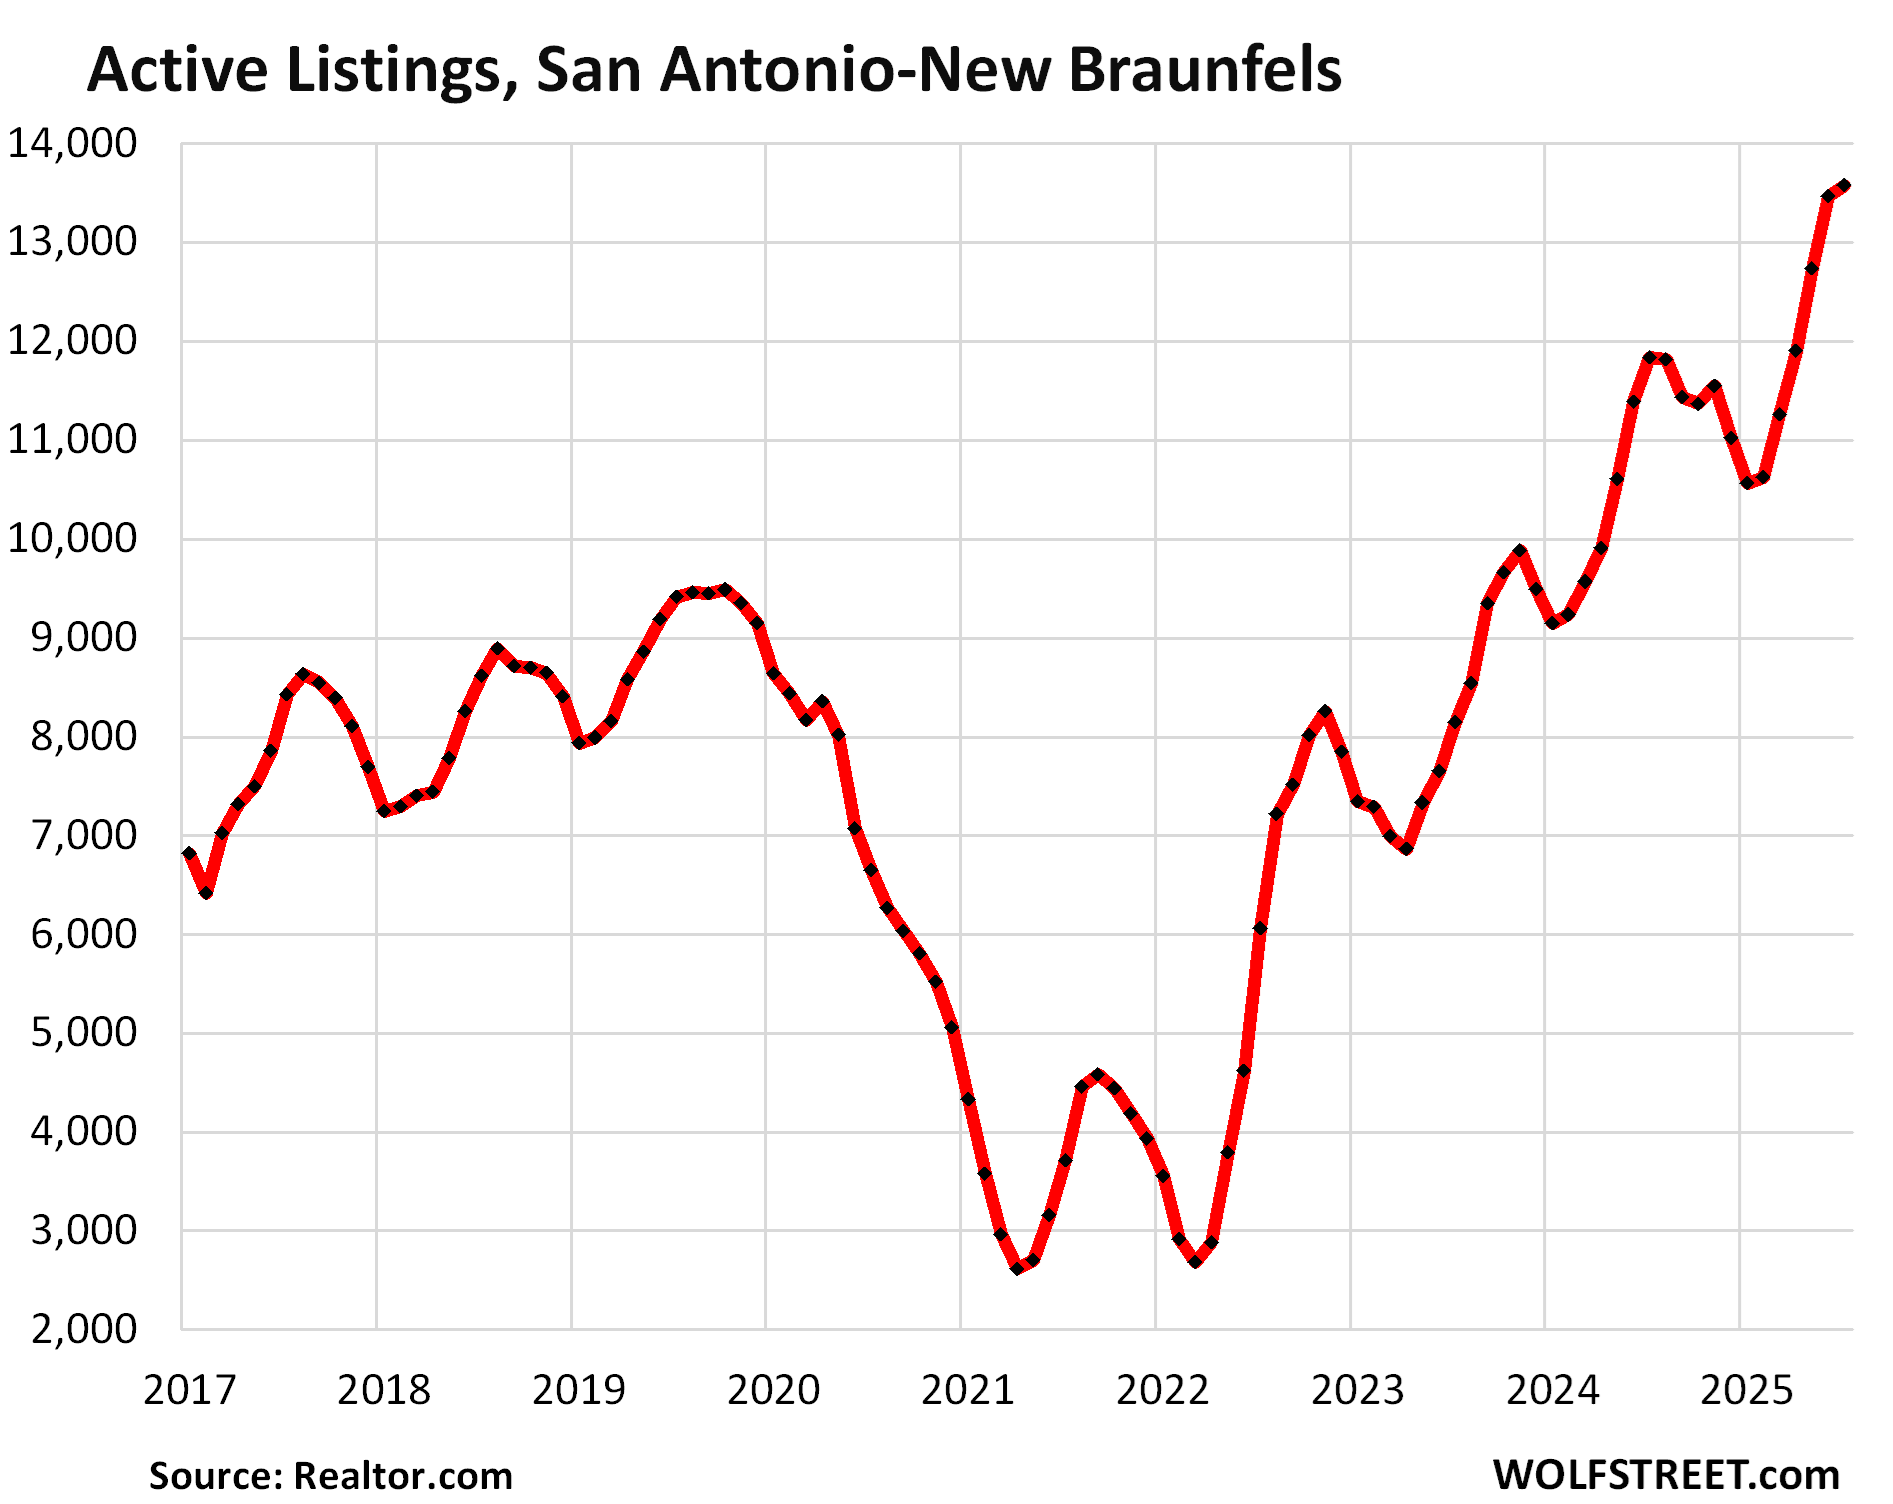
In the San Antonio-New Braunfels metro, active listings jumped by 15% from the already bloated levels a year ago, and by 66% from July 2023, and by 266% from July 2021, to 13,467 homes.
Compared to the Julys of 2017-2019, listings were up by 44% to 61%.
The median number of days on the market jumped to 65 days, the highest for any July in the decade of data. The runner-up was July 2024 at 57 days. In 2017 through 2019, days on the market ranged from 50-53 days.
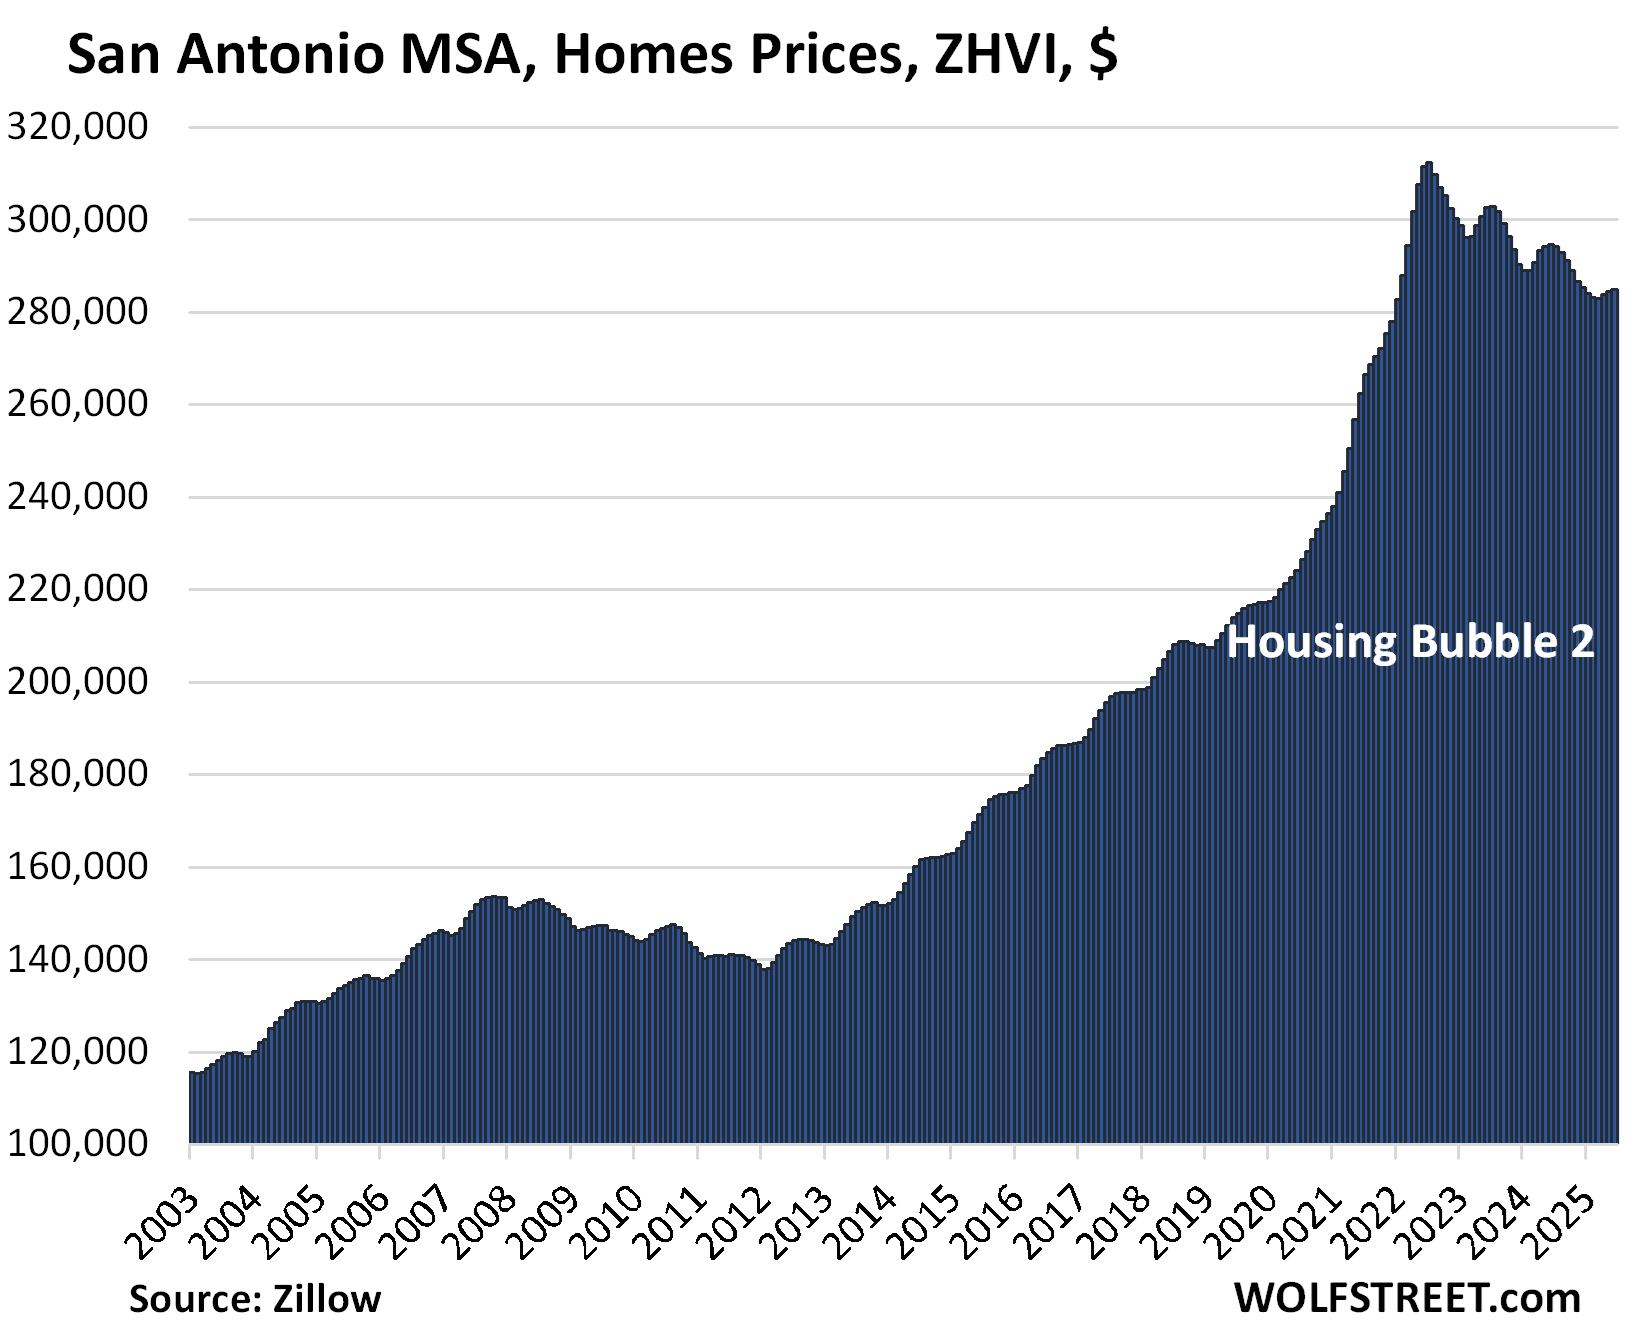
Home prices in the San Antonio metro have declined by 9% from their mid-2022 peak, far behind Austin (-23%), but ahead of Dallas (-7%) and Houston (-3%).
Enjoy reading WOLF STREET and want to support it? You can donate. I appreciate it immensely. Click on the mug to find out how:

![]()
We sold our house fairly quickly in Houston but we priced it to sell at $130 per sq ft. Our competitors, whom we smoked, are still up there at a delusional $150 per sq. ft., plus their homes are ugly. Thank goodness we closed on 7/18/2025, what a relief. We closed on our new home with lots of builder incentives, including a 2.99% mortgage rate, we are thrilled.
Yes, price solves demand and inventory issues. That’s what markets are for – to establish a price at which there is demand. But for some sellers, that’s a really hard concept to grasp.
It sounds like it was your neighbors in fact who were the ones smoking.
Ugly people matter too Wang
😂
I thought all the hype about having hard assets due to increasing money supply was a sure thing? They forgot to mention money supply is always growing, especially during the .com and housing bubble 1.0 and look how those turned out! 😂
Two words: carrying costs. Houses are money pits.
Just like a mutual fund that charges an annual 3% fee. heh.
Thanks WR for this article.
The prices need to fall 50% or so from its peaks to help common young Americans to be able to afford a shelter.
The inputs to housing have risen meaning housing can’t fall by 50 percent.
That’s a fallacy. Costs are irrelevant to prices. Stuff sells at a loss all the time. During the housing bust, builders sold at a loss all the time.
The cost of new builds probably has a price reduction floor because at a certain loss builders just stop existing/go bankrupt. Existing home prices are set by the market.
Did you wake up to a bong hit this morning, spencer?
Worse than that, with the price increases in various other aspects of home ownership like insurance, not to mention higher prices in things like food (thanks Biden).
Home prices need to be no more than $150k for Americans to be able to afford them again.
It’s a long way to the top – and a long fall to the bottom.
Biden: “You ain’t seen nothin yet Sucka”
Prices are already down significantly relative to wages.
Again, median household income for prime home buying age is over $110k.
Your back end payment can then be $40k with conservative underwriting.
That can accommodate a $400k mortgage, and a “typical” T&I component of about 2.5% of value.
Those of you waiting for a 2008 crash (again) will be disappointed.
It might be interesting to see a paper discussing the percent change in price = f(percent change in number of active listings, percent change in number of days on market). Maybe interact each term with price level. This would give us elasticities, and we could also see if price level makes a difference. A geographic location variable might be important, but maybe not. It could go back as far as data are available, which sounds like about ten years as I recall reading in the article. It would be nice to go back to 2010. Start with annual changes, and if it looks promising, go to deseasonalized monthly changes with varying lags.
Seems like if you geo-arbitraged because everything would be WFH, that may have not been a great bet.
How is it, you report on inventory, just as I stumble across stupid inventory subplots?
Re: Home prices are skidding lower across Texas
Texas is probably very relevant in this inventory build and the overhanging elephant on the affordability cliff — that nagging ongoing narrative, that homes are incredibly overpriced and beyond the means of the vast majority of the global population. Hence, the question of how a bubble pops:
Problem solved: Our politicians have been busy turning this problem around — by creating national legislation to make trailer homes Great Again:
“The proposed “Renewing Opportunity in the American Dream (ROAD) to Housing Act of 2025” aims to address the US housing crisis by increasing supply and improving affordability. The bill includes provisions specifically addressing manufactured homes and their role in increasing housing inventory”
All those people who’ve been outbid on $500,000 homes, or those waiting for existing built homes to reprice — can now fulfill their dreams, by rethinking a lifestyle in a manufactured home.
The obvious holdback on people has been the steel chassis frames, for these units —- but now, I guess, when these things are dropped off at the rental park — the next generation of owners will be chassis-less. That apparently will crash the cost of future units, as steel is super expensive.
I think this additional mix of mobile inventory into the existing home sales inventory will be just what Santa is waiting for!
Probably not the right time to add my manufactured community comment?
I have heard the future is modular housing because it can be made in a factory, it’s net zero, and eventually that factory will be filled with robots. Modern modular homes are also supposed to be incredibly energy efficient. I was talking a developer the other day and that’s where he saw the industry going because we’re deporting a large % of our construction workforce.
I’d love a 1,200 sq ft modular home as a first time homebuyer but wouldn’t dare in hurricane country. Gotta have block.
Most all hurricane prone areas of Florida require the same wind mitigation standards for both block homes and mobile/modular homes. The roof is still a concern with CBS homes. A strong enough storm will destroy and not differentiate
Modular homes have been a large part of our housing in my part of flyover for decades.
Just have to leave that ivory tower of yours and travel out to the great unwashed.
Don’t forget we also have 2 100k trucks
parked out front.
Riiiiiiiiight. Their “solution” is a lower standard of living. Such BS. It’s the end result of a faulty trickle-down economics model which really produced trickle-up poverty.
All that money-printing went into the pockets of the wealthy, resulting in a Cantillon Effect where they benefited from massive inflation. At the very end, billionaires like Jeff Bezos will be selling you the tent you are going to live in for the meager sum of 6 months wages.
Burn it all down and start over. This whole thing is over with.
Buying a house at 100 times monthly rent has always worked out in the Tampa market, especially as an investment. Excluding water front. They go at a premium.
In 2012-14 some houses sold for less than 100 times rent, and those were the bargains. We are a ways from that now, but it’s inching closer by the month begrudgingly.
I believe we will see 100 times rent again, this go around, but it’s gonna take a while. This doesn’t resolve itself over night. Most owners think they are simply entitled to those sky high prices of yesteryear, when selling. like it’s their right or something. Idk. I see it all around me. Perhaps greed, or stupidity…
With insurance premiums skyrocketing now, most cannot afford much more than 100 times rent mortgage, and that’s what we didn’t see until recently.
I used to live in the Hancock Park area of Austin. Went to Lee Elementary, lived on Texas Ave. My Dad being a rather poor AF newbie Captain, we couldn’t get officer housing at Bergstrom so settled for rentals in the $50-$75 range off base. Now the Texas Ave. area is still pretty darn hot compared to last year and as always, it comes down to location, location, location. Those $50 rentals are long gone. The house we lived in is probably $8-900k now. I checked sales for the last 6 months and things are selling at what I consider ridiculous prices. Taxes are through the roof! If it has slowed, it’s hard to see in the numbers I’m seeing.
Could you give us the home price charts for Dallas and Houston?
https://wolfstreet.com/2025/07/16/the-most-splendid-housing-bubbles-in-america-june-2025-the-price-drops-gains-in-33-large-expensive-metros/
This is through June. The July update will come next weekend.
“They” will continue to says there’s a housing crisis. Same everywhere. The narrative’s die is cast for awhile, facts be damned.
Texas has very high property taxes which are around 2.5% of house value which is around double that of California. Moreover, there are not many nice areas to live in Texas except a few in Dallas and Houston. An old college friend of mine inherited his grandparent’s house built back in the 1920s when they were founders of River Oaks on River Oaks Drive a few houses down from the entrance to River Oaks Country Club in the early 2000s and watched its assessed valuation skyrocket every year until it reached around $7 million and property taxes got jacked up to more than $160,000 at which time he decided to put the house up for sale back in 2011. Imagine what those numbers are now.
CA has a hefty income tax while TX has none. There are plenty of nice areas in Texas. Californians must think so as well since they move their in droves.
Some of those droves are now unfortunately coming back.
There most certainly are NOT many nice areas in the state of Texas which is a hodgepodge with few zoning restrictions. Most anyone who has moved there has come right back to California.
2024, net movement of Californians to Texas was 55,000, in-line with the annual average going back a decade.
Nice areas in Houston? Obviously you’ve never gone outside in the summer time in Houston.
Working in the energy business (oil and gas) for 40 years with 15 moves into cities like Tulsa Okc Denver Dallas Houston Tyler Midland have seen many more downward pressure on housing rather than appreciation when moved sometimes less than 1 year on the job, Hone size had tripled though house occupancy went to half. Human nature seems to gradually increase the size of homes if affordable. Sort of like farming. Farmers would want an adjacent farm for expansion if affordable but claimed he did not want all the land,
My point is demand drives price just what Wolf says not the cost of construction. People are more mobile than ever and technology is changing every aspect of life in the USA . So many variables in housing costs so the underlying theme is lower overall. Note the sales price in Houston below 130 a sq ft. Yet inventory is growing .
I sold my last home in Houston in 2005 for 100 a sq ft in Katy
3000 sq ft for 300k with pool.
6 years old .
The gen z kids are entering the first time homebuying market next . They are a slightly smaller group than millennials. Supply increasing and demand decreasing. Wolf charts showing the outcomes
TX vs FL. Which state will crash first?
Florida due to hurricanes and insurance costs is my guess.
According to the Realtors (yeah I know but they might be reliable in this instance because this is their business), national insurance rates are going up 8%.
Florida is projected to go up 9% this year.
Texas is also projected to increase 9%.
Why not at the same time? It’ll be a grand old party to watch.
5% yield minus real inflation minus taxes is a losing proposition.
But you all can keep boasting about your imaginary gains and genius strategies.
Cash, Metal, Property and no debt have been an outstanding investment strategy for a number of years now.
Houston market vs. Woodlands market… Two different animals
I don’t know where she was located, but I watched a YouTube “short” of a young woman narrating as she removed the stars & appliqués she had put up in her home in preparation to piant it all white again.
She said they had bought it by barely squeaking in on the monthly payment. Now between taxes & insurance that monthly had gone up $900 iirc correctly. They could no longer to afford the home and had to bail.
I genuinely felt sorry for her and her family. I’m sure an agent was telling everything would be great, and now a few years later that dream is dead.
I imagine this is playing out all over the country. The spikes in both insurance and taxes are beyond anyone’s control.
Sure thing. We bought our home in late 2020. The timing was very lucky and we got a good price and an even better mortgage rate. That said, our monthly payment has risen by 40% in under 5 years – all due to taxes and insurance. I expect them to rise further next year. We love our property, but I often suggest to my wife that we should just move into a double wide and let the weeds grow all around it.
The increasing cost of HOAs in these gated communities, and Insurance, buckling the real estate market
Can we talk about insurance profits?
The $169 billion profit amounted to a 90% increase from the previous year and a 333% increase from 2022.
When insurance companies said “climate change” they meant to say the climate of greed has changed….it’s on steroids now.
Because the average rent in Dallas is $1,417, you’ll want to make about $4,723 per month or $56,676 per year. Throw in $369/mo for the new Ford Ranger Lease and you are living high on the hog in Texas. Most folks young folks have figured it out, there is nothing exciting about diving into the TX housing market today.
Wolf, what part of declining house prices do you think may have to do with the usual suspects like Blackrock and other institutional single family home buyers / rich folks being happy with their 4-5% guaranteed returns in vehicles like MM’s? My concern about house prices is that as soon as interest rates drop a bit, these players come off the sidelines and buy up everything again.
Businesses and rich folks buying or holding single family homes due to historic wealth inequality (all that money needs to be put to work after all) scares the heck out of me for regular folks trying to just find a place to live.
1. BlackRock is a fund manager. It doesn’t buy houses. Never did.
2. The big single-family landlords that you mean (including BlackSTONE’s spinoff Invitation Homes) have become net sellers. They’ve started selling the houses they purchased in 2012 because prices have run up so much, and they’re cashing in. And they’re building entire development of rental houses, hundreds of nice houses in one neighborhood, with a pool, a leasing and maintenance office, etc. Some of these companies have their own homebuilding divisions. These communities of build-for-rent houses are much cheaper to operate than individual houses scattered all over the place. That won’t change with interest rates. They’re done buying individual houses. They bought very low, and they’re now SELLING those very high.