Federal government jobs fell by 22,000, to the lowest share of total payrolls since… whenever.
By Wolf Richter for WOLF STREET.
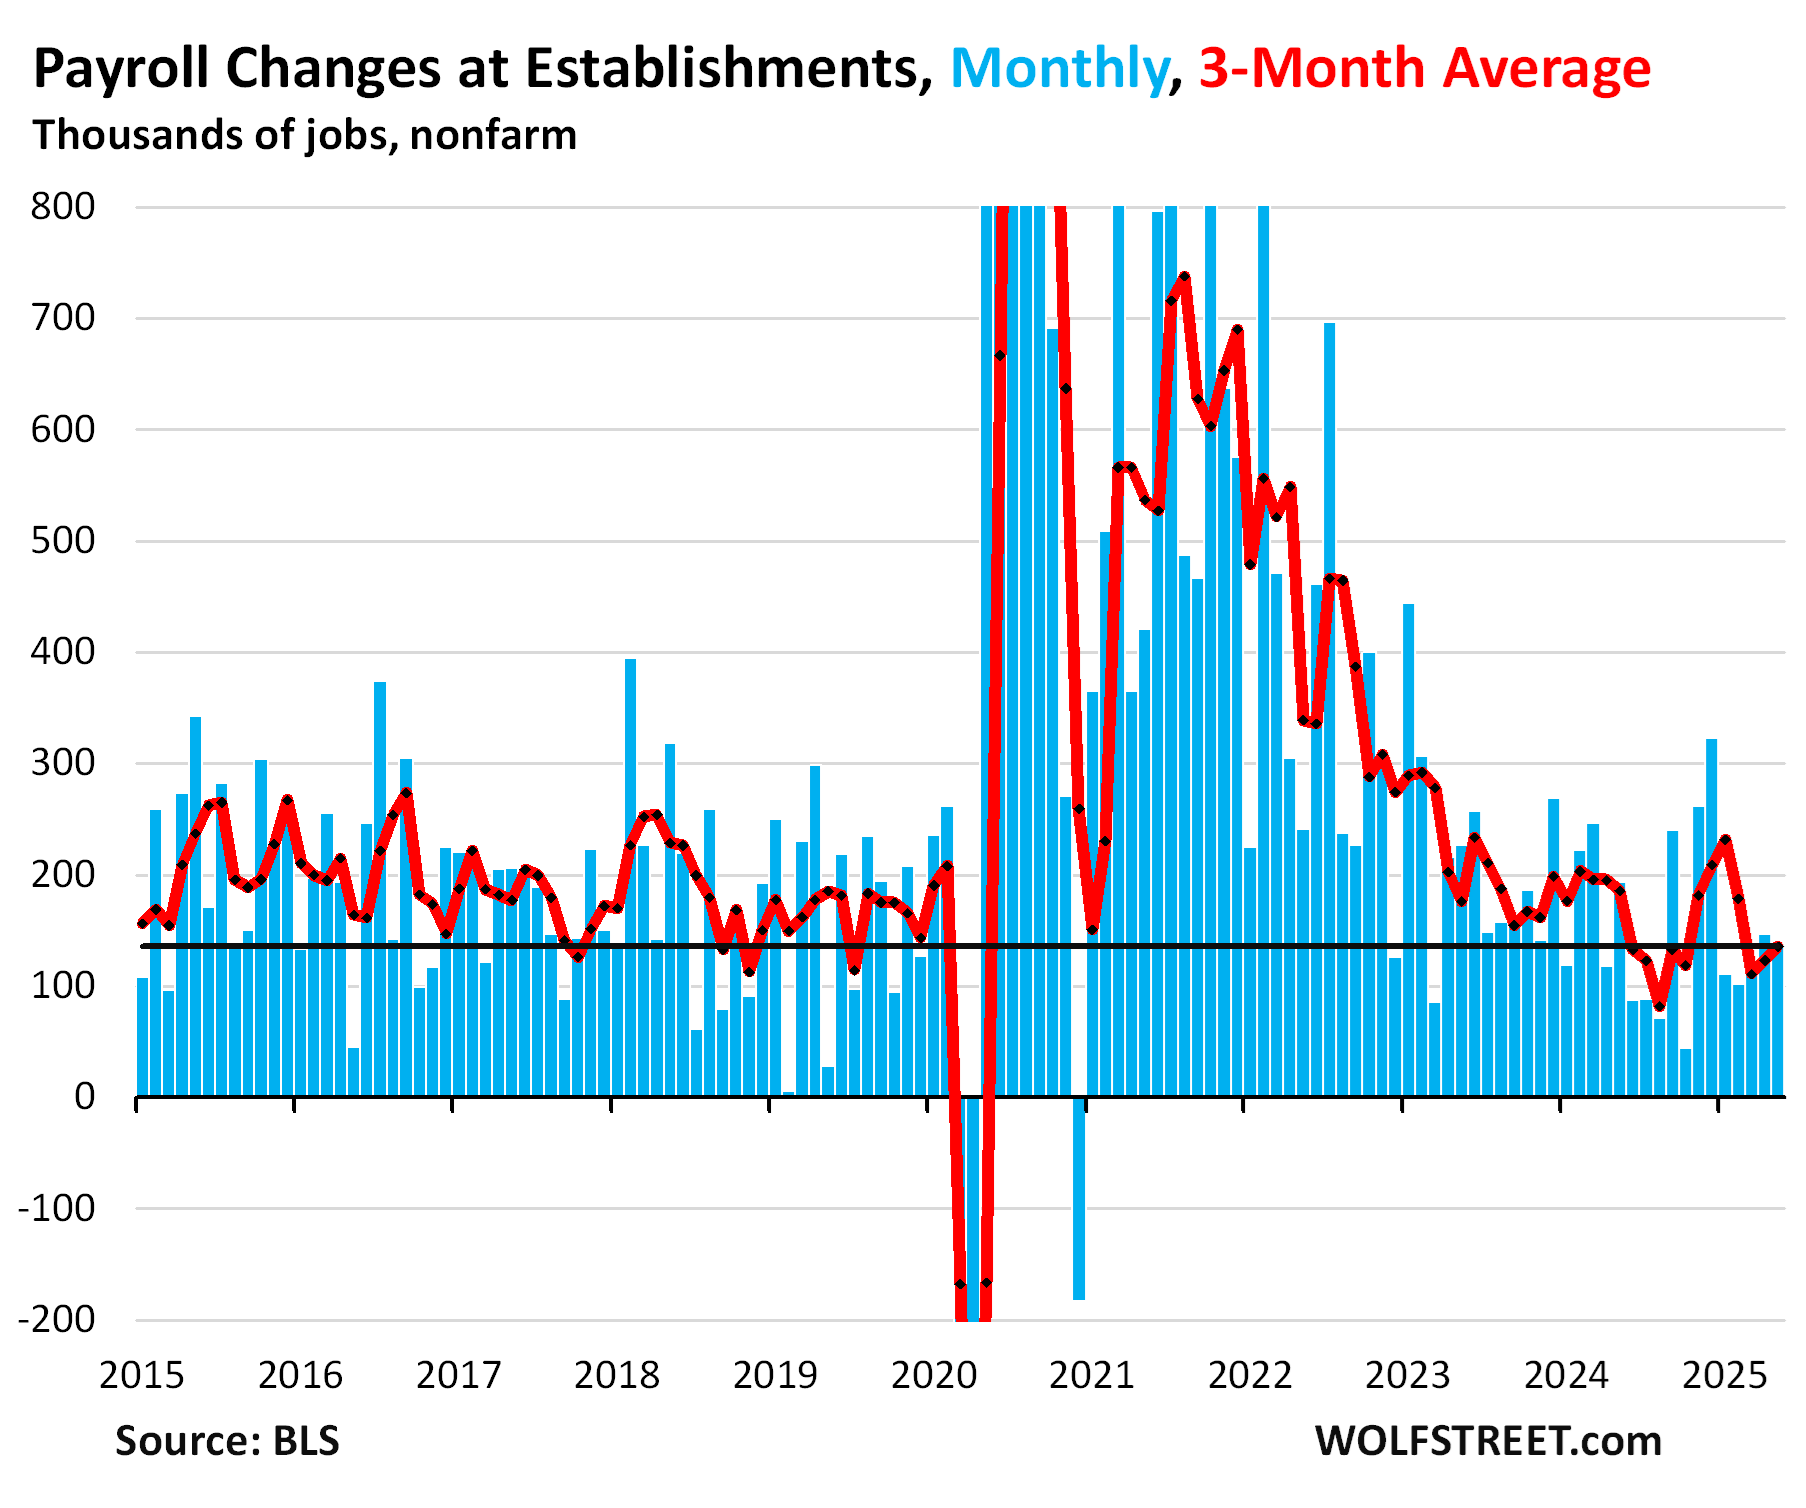
Total nonfarm payrolls rose by 139,000 in May, to 159.6 million, according to the Bureau of Labor Statistics today (blue columns in the chart). The increase of 139,000 new jobs is fine. It’s close to the 12-month average (144,000). It’s better than six months out of 12 in 2024.
Federal government jobs fell by another 22,000 in May. Excluding the federal government, the economy created 161,000 jobs in May. That is solid growth.
The three-month average, which irons out some of the month-to-month squiggles and includes the revisions, rose by 135,000 (red line in the chart). The low point was in mid-2024.
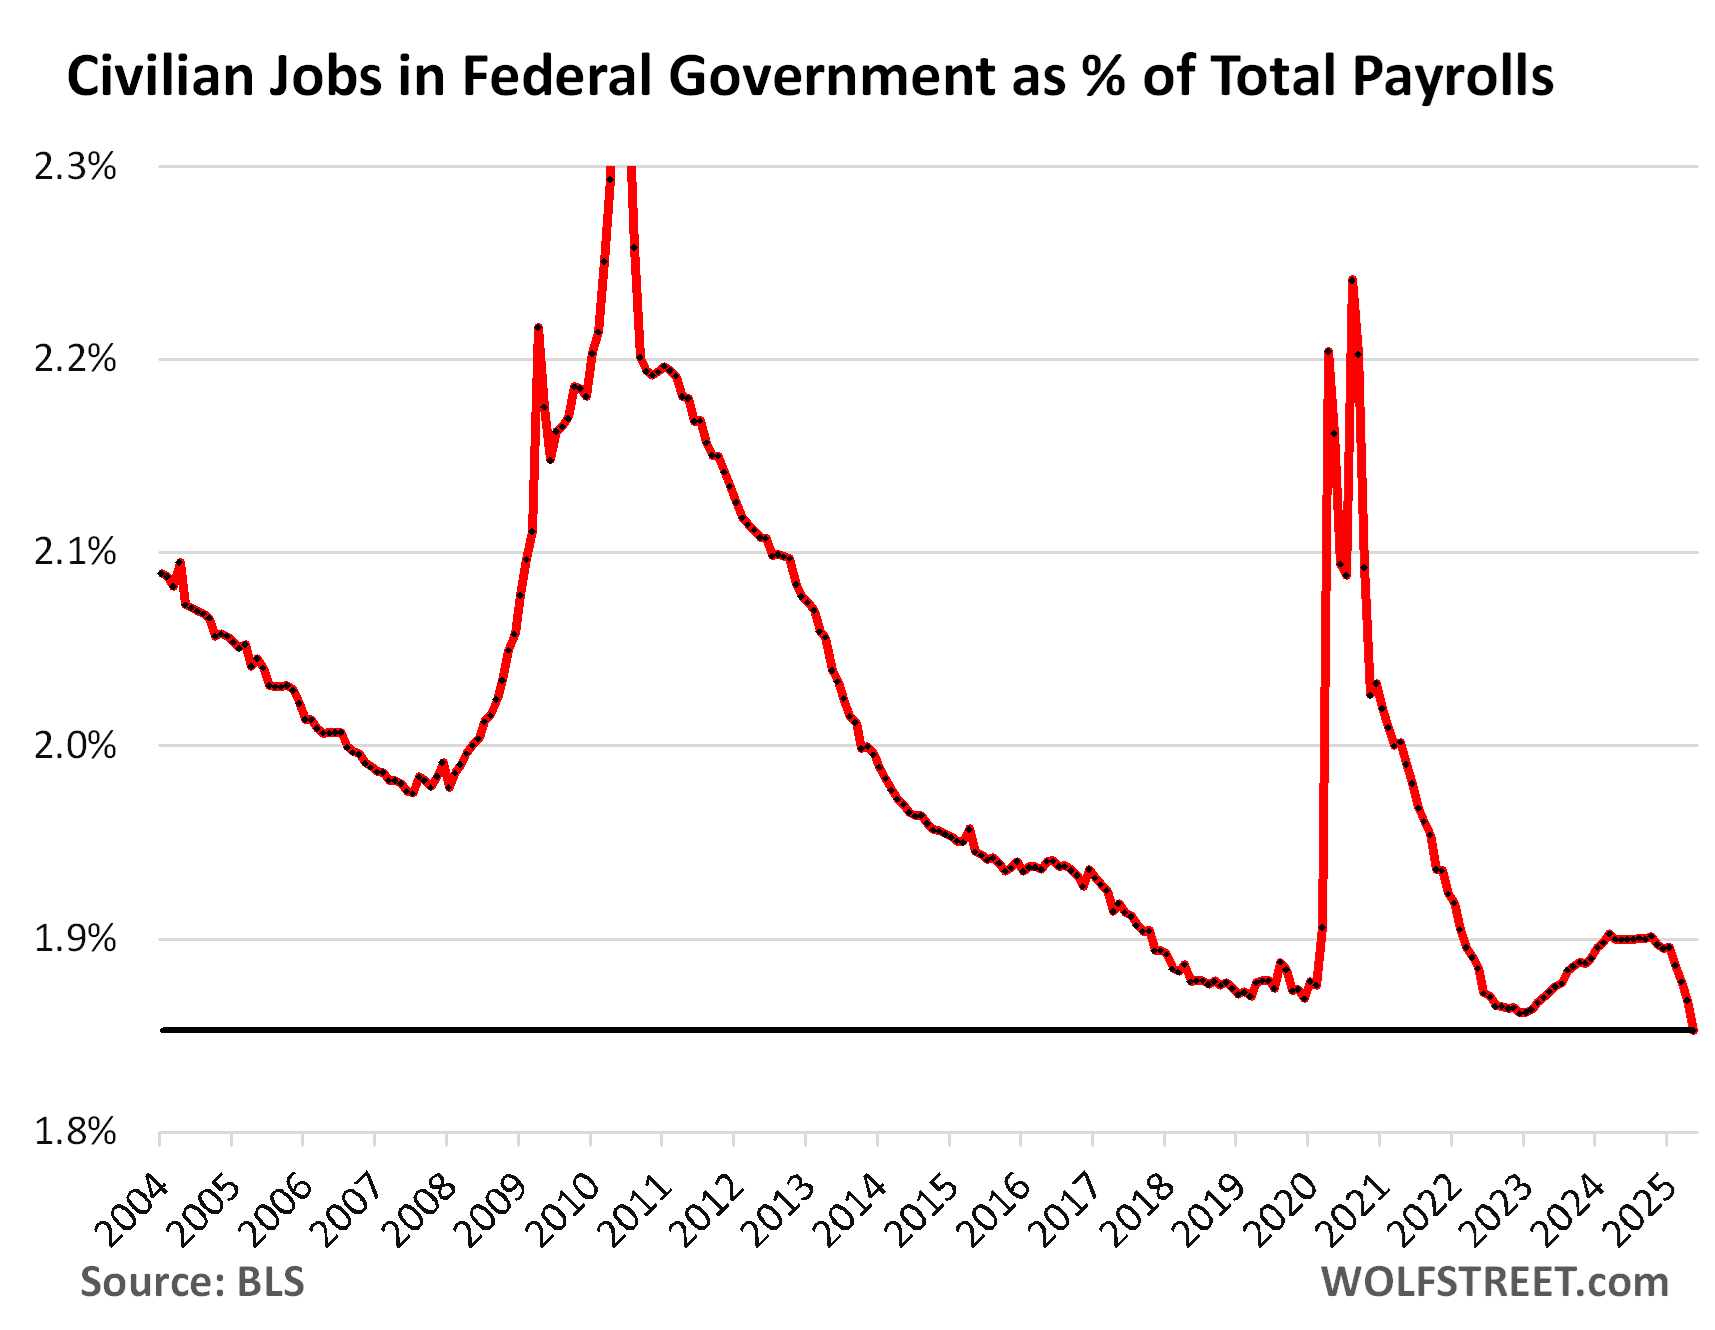
Without the federal government: Civilian jobs at the federal government fell by another 22,000 in May, bringing the job losses at the federal government over the past three months to 46,000.
Excluding federal government jobs, the economy created 161,000 jobs in May, up from April (160,000), and the most since December. The three-month average increased by 151,000 jobs. This is solid job growth.

The share of civilian jobs at the federal government dropped to 1.85% of total nonfarm payrolls, the lowest share since… whenever.
In 2022-2024, job growth at the federal government was a big driver of total job growth. This year, the opposite has been the case – total payrolls grew at a decent pace despite the decline in federal government jobs.
But the payrolls data still doesn’t show the full effects of the federal government job cuts so far: Workers on paid leave or receiving severance pay are counted as employed until they stop being paid.
And government payrolls don’t include employees working for companies that have contracts with the government and that are now getting laid off. These workers are counted in the various nongovernment categories, such as in the huge category of “Professional and business services,” where employment has been stagnating in recent months.
It’s an OK labor market. This is not a hot labor market anymore with labor shortages, like in 2021 and 2022. It’s an OK labor market that is growing at an OK pace.
But wages rose faster, and that’s good for workers, spending, consumption, savings, and future investment — all of which are good for economic growth now and in the future. But higher wages might provide some fuel for inflation.
The Fed has been talking about the possibility that the crackdown on illegal immigration might tighten up the low end of the labor market and put upward pressure on wages, and higher wages would stimulate demand a little and support economic growth, which might add a scintilla of fuel to inflation.
And especially service providers that employ workers at the lower end of the pay scale, such as the hospitality industry, might try to raise prices as labor costs rise. But they’re always trying to raise prices until their sales drop.
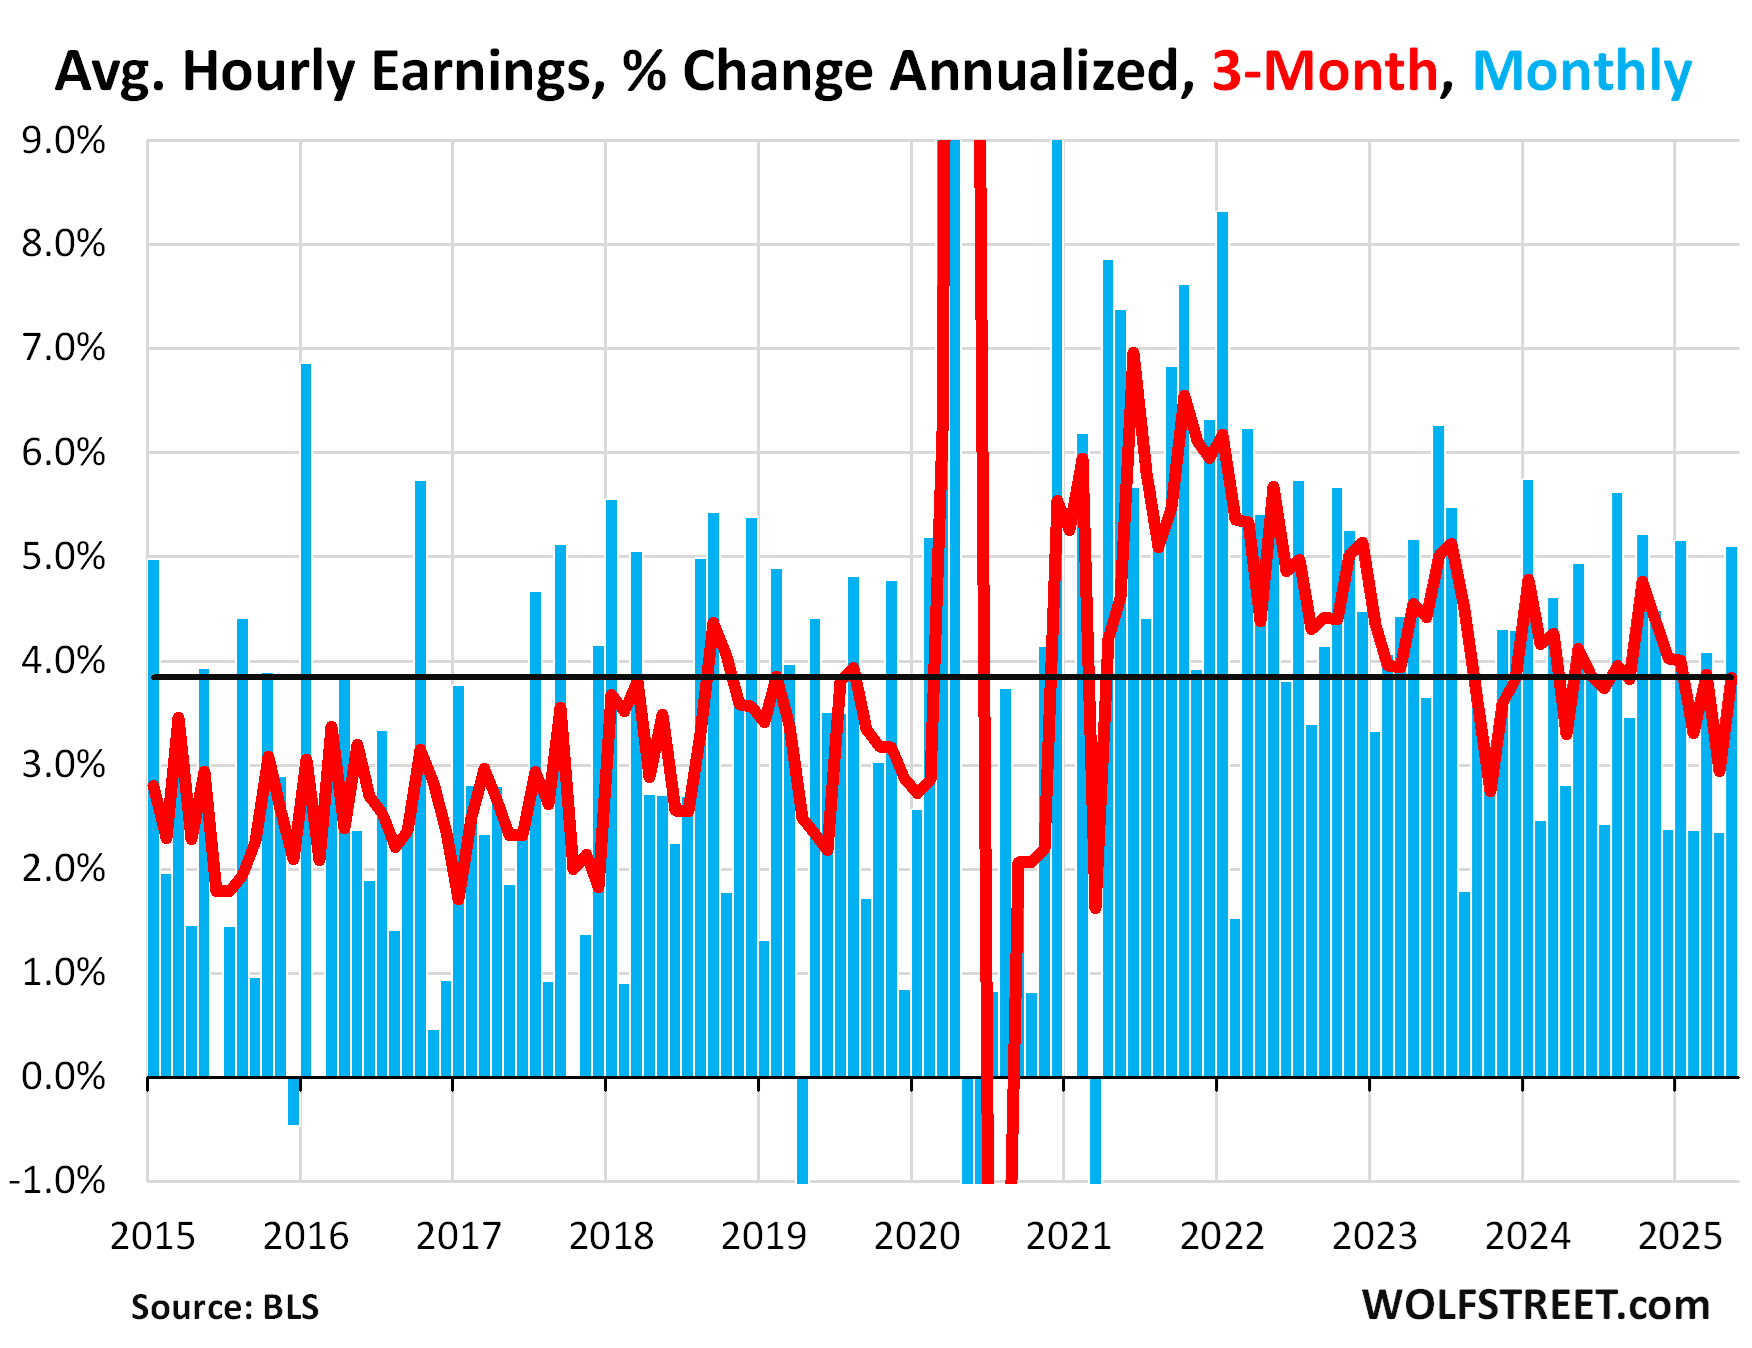
Average hourly earnings jumped by 0.42% in May from April (5.1% annualized), according to the establishment survey by the BLS today.
The three-month average growth (red line) accelerated to +3.8% annualized, at the top end of the range that prevailed during the strong labor market in 2018 and 2019.
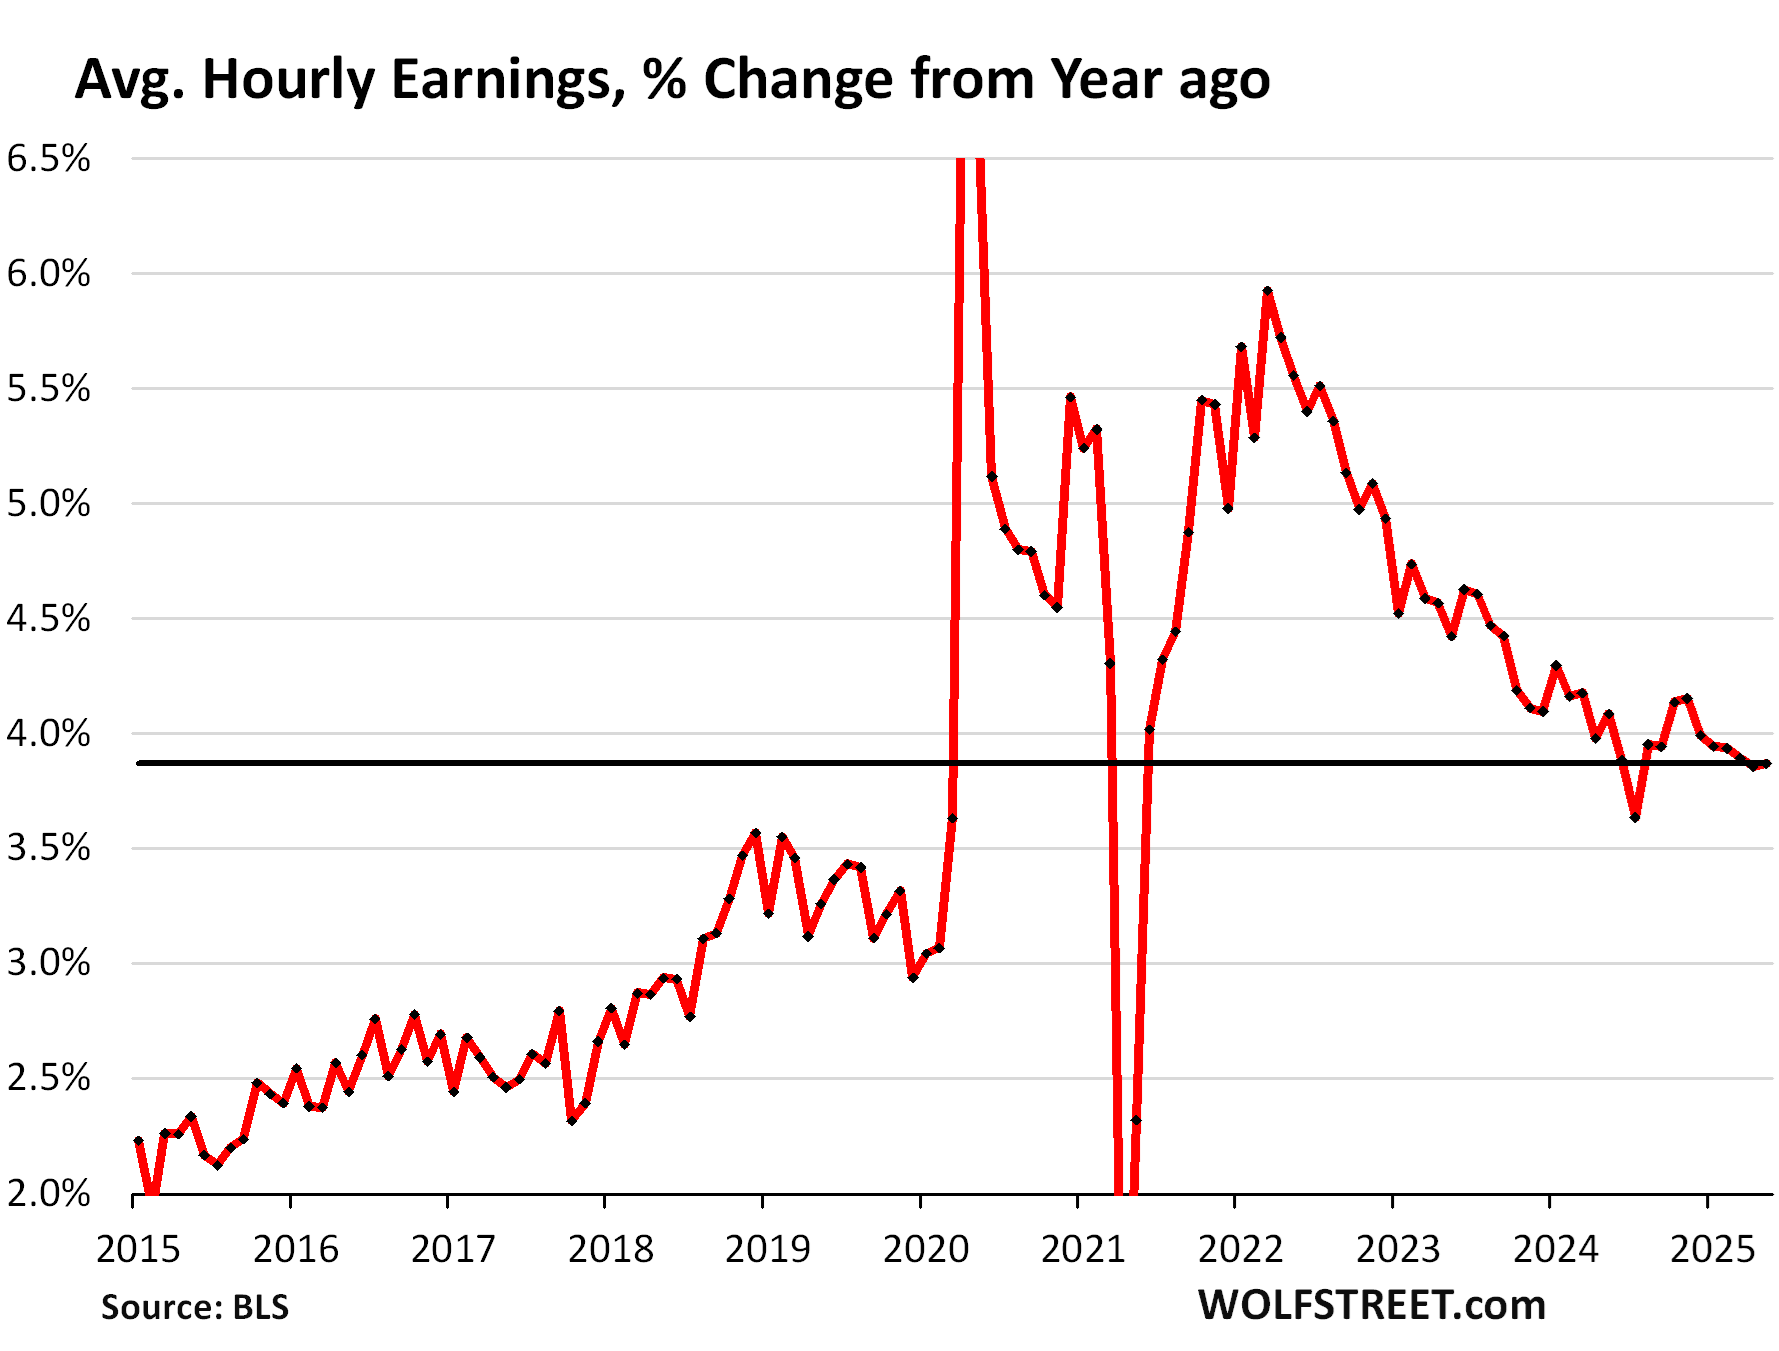
Year-over-year, average hourly earnings rose by 3.9% in May, slightly faster than in April, but same pace as in March, and this seems to be where wage growth has stabilized recently, well above the wage growth before the pandemic.
Unemployment rose by 71,000 in May to 7.24 million people who were actively looking for a job during the survey period, according to the BLS household survey data today.
With the sudden inclusion in the household survey data this year of the surge in immigrants in 2021-2024 (we discussed this here), the major components of the household survey data jumped in 2025 through May by:
- Labor force: +1.96 million
- Total employment+ 1.61 million
- Unemployment: +351,000
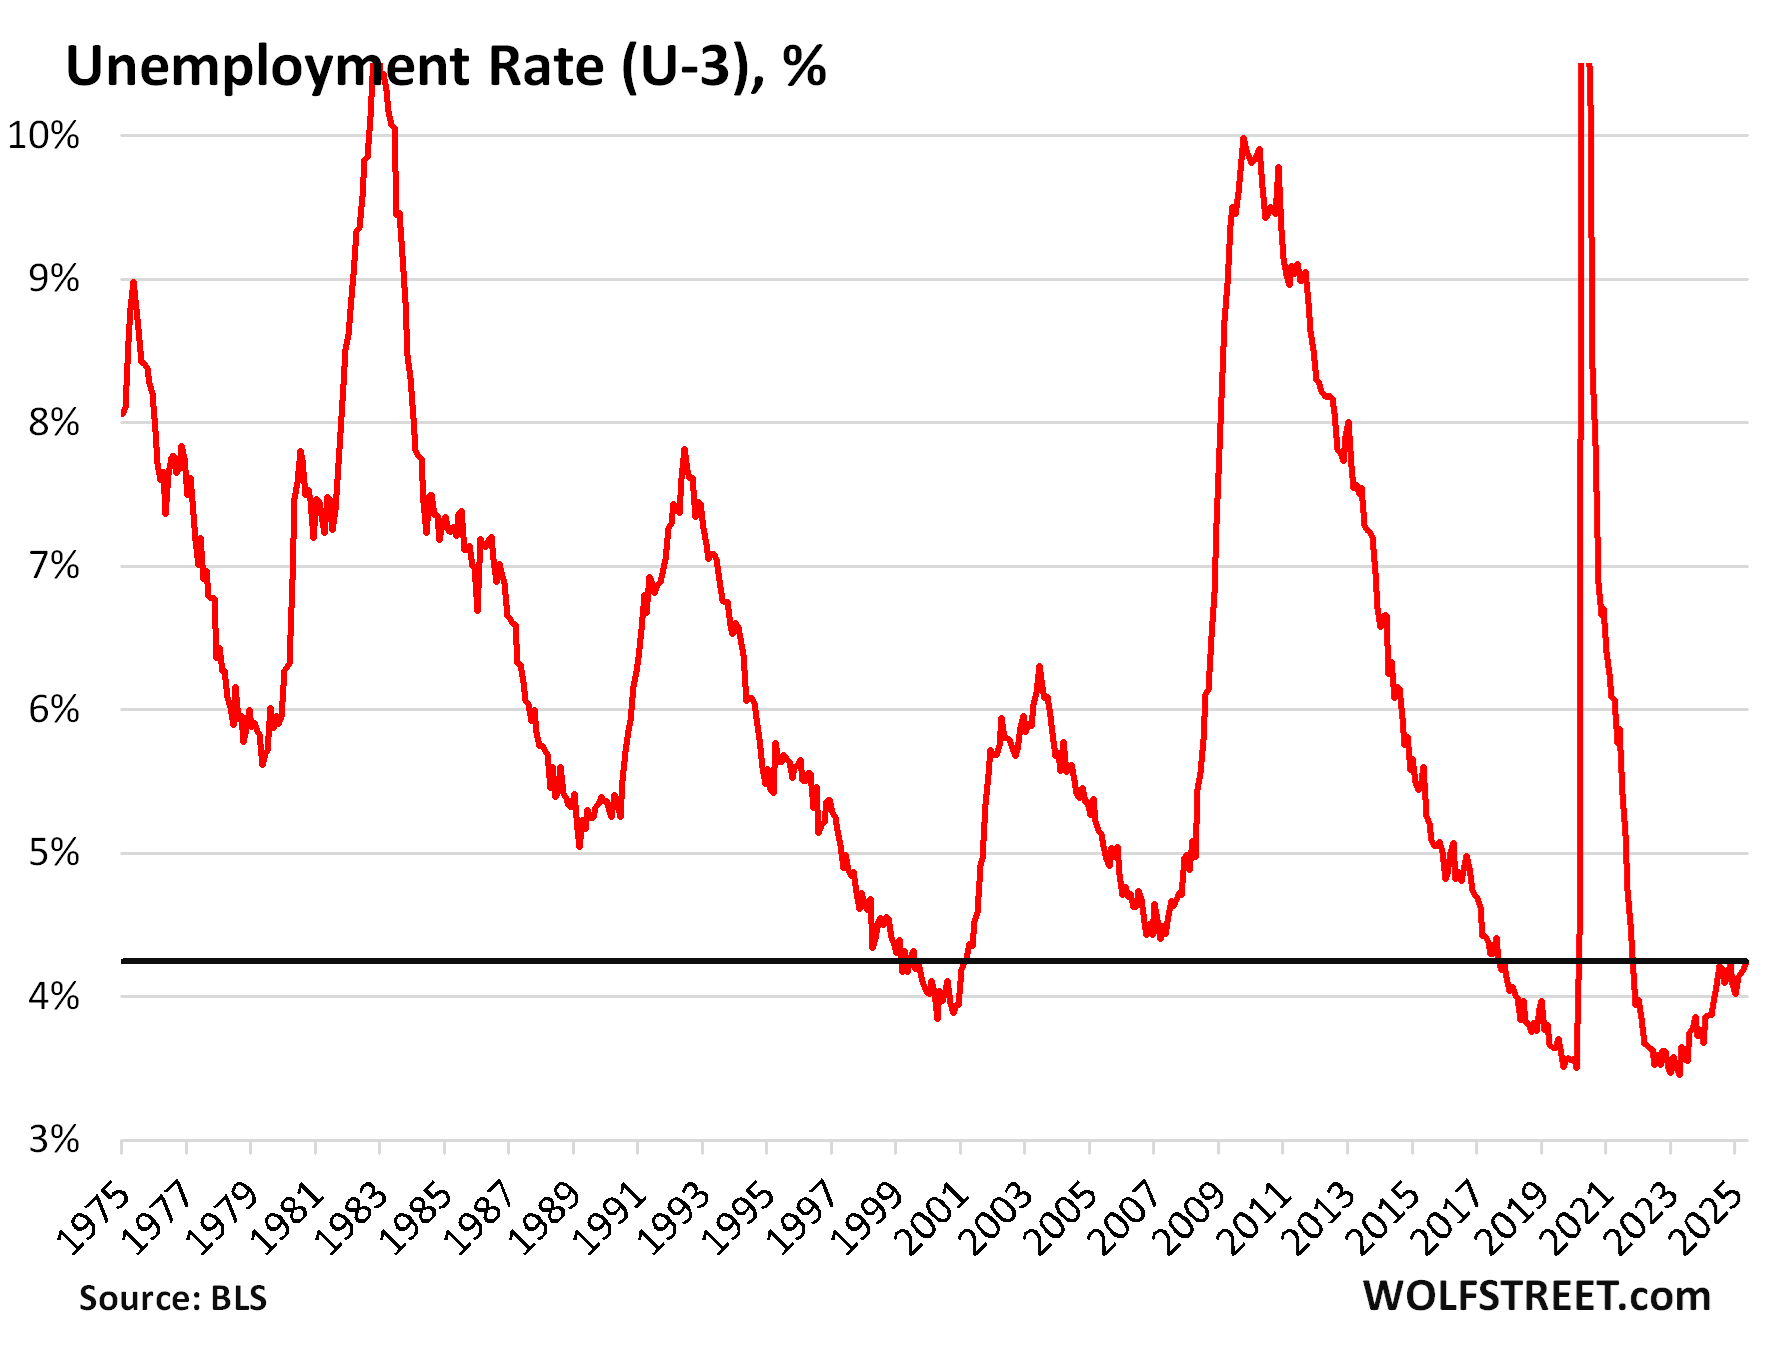
The headline unemployment rate (U-3) remained at 4.2% in May. Since June 2024, the unemployment rate has stabilized at the historically low range of 4.0% to 4.2%.
The unemployment rate = number of unemployed people who are actively looking for a job (7.24 million) divided by the labor force (170.5 million).
An unemployment rate of 4.2% is historically relatively rare and indicates a solid balanced labor market, despite the large-scale influx in just three years of millions of immigrants. And it remains below the Fed’s median projection at the March meeting of 4.4% for the end of 2025:
Enjoy reading WOLF STREET and want to support it? You can donate. I appreciate it immensely. Click on the mug to find out how:

![]()
Came here to say, I still don’t understand half of this stuff but Wolf, but the other 50% I understand it because of you!
I’m not surprised. QT has dwindled to a trickle and an enormous QE(ish) Omnibus Spending Bill looms. Still President Trump demands Tax Cuts and more Pork on top of a Rate Cut.
I sometimes feel for “Too Late” Powell. How can a full percentage interest be justified??
1. “QT has dwindled to a trickle…”
Fed Balance Sheet QT: -$36 Billion in May, -$2.29 Trillion from Peak, to $6.67 Trillion, Lowest since April 2020.
2. “…enormous QE(ish) Omnibus Spending Bill”
“enormous”: yes, most definately
“QE(ish)”: opposite, QE pushes down long-term yields, this bill pushes up long-term yields… because there is nothing QE about it; the government will have to borrow HUGE amounts of money to fund these expenditures.
This kind of deficit spending does increase demand in the economy. But QE increased demand in the asset markets.
100% … 2020’s Hartnett theme …
QE->QT
Monetary excess -> fiscal excess
Deflation->Inflation
intermediate potentially stagflation?
LA passed a new ordinance in May for workers in the city’s hotels and airports to $30 per hour by 2028. With bennies it’s closer to $40 an hour.
Why would federal jobs be excluded? I’m thinking jobs are jobs and in any company or industry layoffs are cyclical.
RTGDFA
And not just the title before you post BS.
Chart #1
Numbers in paragraph #1 and #3.
Duh.
I love love this site because it is driven by data. So this was a bit surprising: “In 2022-2024, job growth at the federal government was a big driver of total job growth”
Federal government job growth 2022-2024: 100,000
All other job growth 2022-2024: 7,000,000
The numbers were neutral, better than expected by most doomsayers.
Still, the U3 unemployment chart looks like an ominous sign of something pretty bad is about to happen. Unemployment started to rise while the Biden administration was spending massively during the last two years. And if history repeats, once it starts to rise it will create a massive spike unemployment soon. Then again, the aging population, lower immigration and bringing back manufacturing might change the pattern.
the unemployment rate has been between 4.0% to 4.2% for 11 months in a row, since June. This is very low, and it has NOT risen in 11 months. There is nothing “ominous” about it. All it did in 2023 through mid-2024 is rise from the labor-shortage levels to what is still a very low unemployment rate.
Agreed. But your longtime chart shows no extended phase of flat unemployment rate during the last 50 years. Maybe this is the start of a prolonged period of sustained growth and low unemployment, but your chart suggests otherwise. So what would make it different this time?
We never before had a lockdown that caused half the economy to shut down suddenly, and then free money started flooding the economy and caused the labor shortages as people didn’t want to go back to work. This situation has never before happened in our lives. Nothing compares. That’s why all the infallible recession predictors for the past three years have been wrong.
It seems that Fed had found the right formula to prevent recession. Economic cycle no longer exists. Universities must rewrite every book on macroeconomics.
Not the Fed. Congress. Deficit spend over $2 trillion a year and it’s not difficult to see why the economy hums along.
Based on what I know, I’ll start getting a nervous, when 1st-time unemployment claims reach 275K. That seems to be a point at which one can say the labor market is on the precipice of really starting to soften. My expectation is that level of 1st-time claims, if sustained or something close to that level for upwards of 6 weeks, would push us up to at least 2M continuing claims. At that point, it would, IMHO, be a sign a labor turbulence ahead.
Be that as it may, NOBODY knows when we may reach those sustained levels of claims.
I agree. For now, the labor market seems to be on a 7 out of 10 footing.
The graph of “Payroll Changes at Establishments without Federal Government” shows a clear upward trend starting five months ago (the blue columns). This is important because I am interested in trends (because I am a trendy guy). The other graph “Avg. Hourly Earnings, % Change Annualized” shows wage growth (the blue columns again), and suggests wage inflation is not slowing down. These combined say to me the employment situation is solid, and maybe getting stronger. I don’t much care about the unemployment rate, which would be more informative if broken down by race, and broken down by sex (as sometimes happened to me when I was younger). I certainly don’t care about federal jobs.
Would be interesting to also pull out state and local government jobs.
Also, 2022-2024 did the federal government hire its way out of a recession/increase in unemployment?
Looks very much like it. Massive government spending pushed up GDP – and still is. Sooner or later inefficient capital allocation by government and the private sector (hiring binge) should cause further increase in unemployment. The question is how fast and where will it top out.
Good description. The massive government spending funded by massive government borrowing. So the question is how sustainable this is.
Also, Wolf has always argued that inflation has been understated. I have heard a good explanation for the inflated US GDP and incomes and that is the inflated prices for non-tradable services. As an example, the research provided comparision for Youtube premium charges in the US and Turkey. The difference was three or four times. And the same applies to most services, which, as we all know, make uo 75 to 80 percent of the US GDP. Hance, the big difference in GDP rankings on PPP basis.
The jobs market is not being hurt by the millions of undocumented immigrants because they’re doing jobs that the natives don’t want to do, and there’s room to soak up the newcomers’ energies. A good example is working in a chicken processing plant, rendering poultry. It’s hard work, unpleasant work, but the illegals will do it. This makes the corporate chieftains happy, for they need a labor force that will stick with it.
Wold this might get buried, I looked around on the webs but do you have a good place for wage growth vs inflation?
Seems to me that is what we should all be focusing on.
This is inflation-adjusted per-capita disposable income, in dollars and YoY % change. Disposable income is income from all sources minus payroll taxes. Inflation-adjusted per-capita disposable income in April was up 3.0% yoy. During the period of high inflation, it declined, and people fell behind, as you can see in the chart:
This is awesome! Thanks Wolf. I appreciate it.
So it seems like things are doing okay
People had a lot of catching up to do after the period of high inflation. Wage increases were big, but they lagged. So people on average fell quite a bit behind, and then when the big wage increases kicked in and inflation cooled, they started catching back up. Looks like they’ve caught up by now on average.
Wolf, yeah that chart is nuts. I knew it got bad, but I didn’t realize it was that bad.
These two charts are based on the government’s measurement & reporting of price inflation. Which may have been understated over the period.
Curious what the disposable income of the lower half of workers is?
Betcha it ain’t 50k
Nevermind, looked it up.
Thx
I would love to see the Federal funds rate superimposed on the unemployment (U3) data…
You’d be disappointed. It’s meaningless. Correlation is next to none. Sure you could superimpose the federal funds rate on the amount of rainfall. Looks similar.
So you say…