Our Drunken Sailors may be in a crappy mood, but that doesn’t stop them.
By Wolf Richter for WOLF STREET.
The big thing – from a data-geek point of view – in today’s retail sales report by the Census Bureau was that the entire data series was rejiggered for several factors, including two massive changes going back to Adam and Eve, well, back to the beginning of the data series in 1992:
- The shift to the 2017 North American Industry Classification System (NAICS) from the 2012 NAICS, which altered how retailers are categorized and shifted retailers (and their sales) between major categories.
- Removal from the data of mom-and-pop retailers that don’t have employees. The current employer-only retail sales are obviously lower than the prior version that included sales by non-employer retailers.
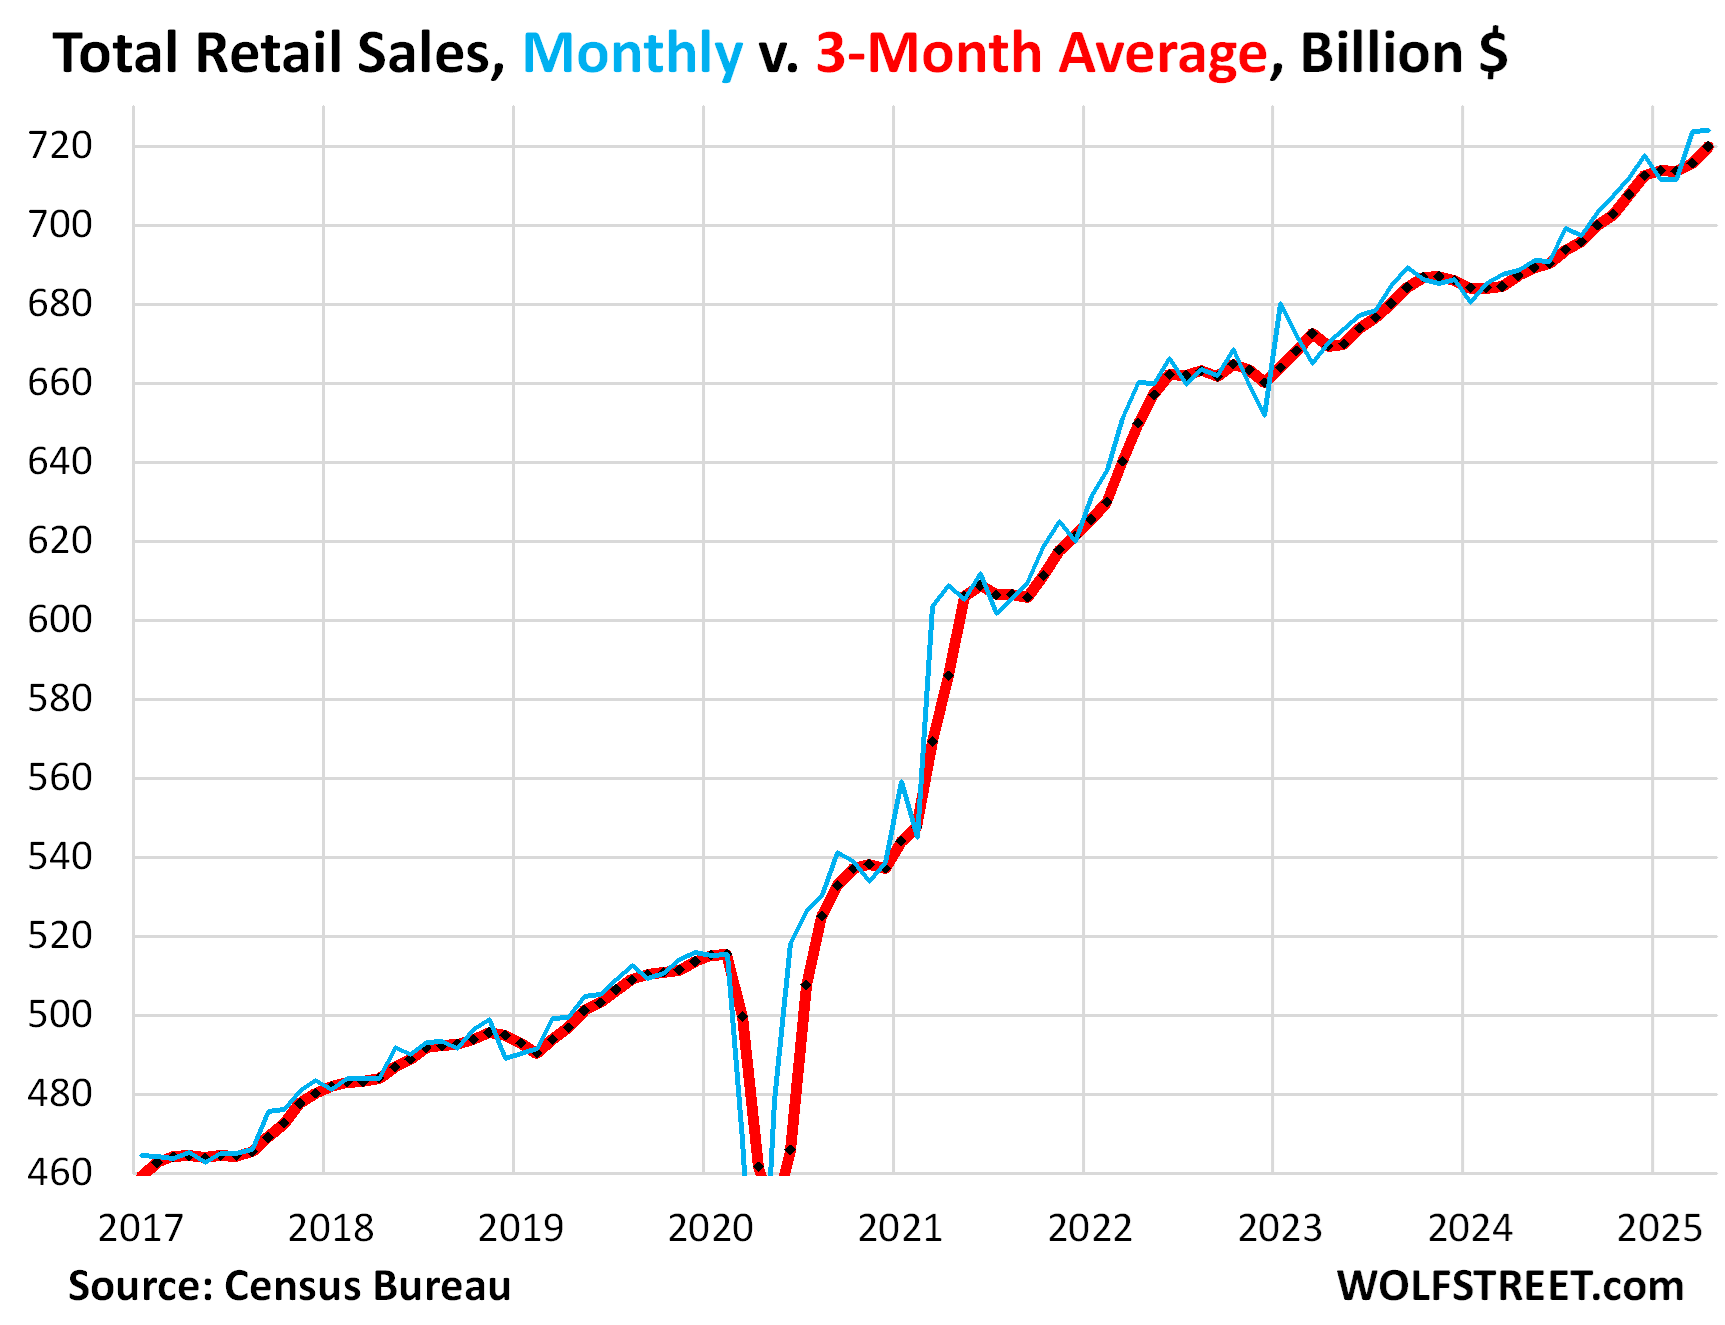
Drunken Sailors: Within this new data series, retail sales growth in March was revised up to a gigantic +1.7% gain (+22% annualized) from the already huge +1.4% gain reported a month ago, seasonally adjusted. In April, sales rose 0.1% on top of the jump in March, to a record $724 billion, and were up by a substantial 5.2% year-over-year, peppered by the continued spike in sales at restaurants and bars, the ultimate discretionary spending.
The three-month average retail sales, which irons out the month-to-month squiggles, rose by 0.6% (+7.3% annualized) in April from March. People have been in a foul mood in sentiment surveys because they hate high prices and inflation, and because the media and social media whack them over the head on a constant basis with clickbait nonsense. But they’re still out there spending money and having fun (month-to-month in blue, three-month average in red):
Retail sales by the largest categories of retailers.
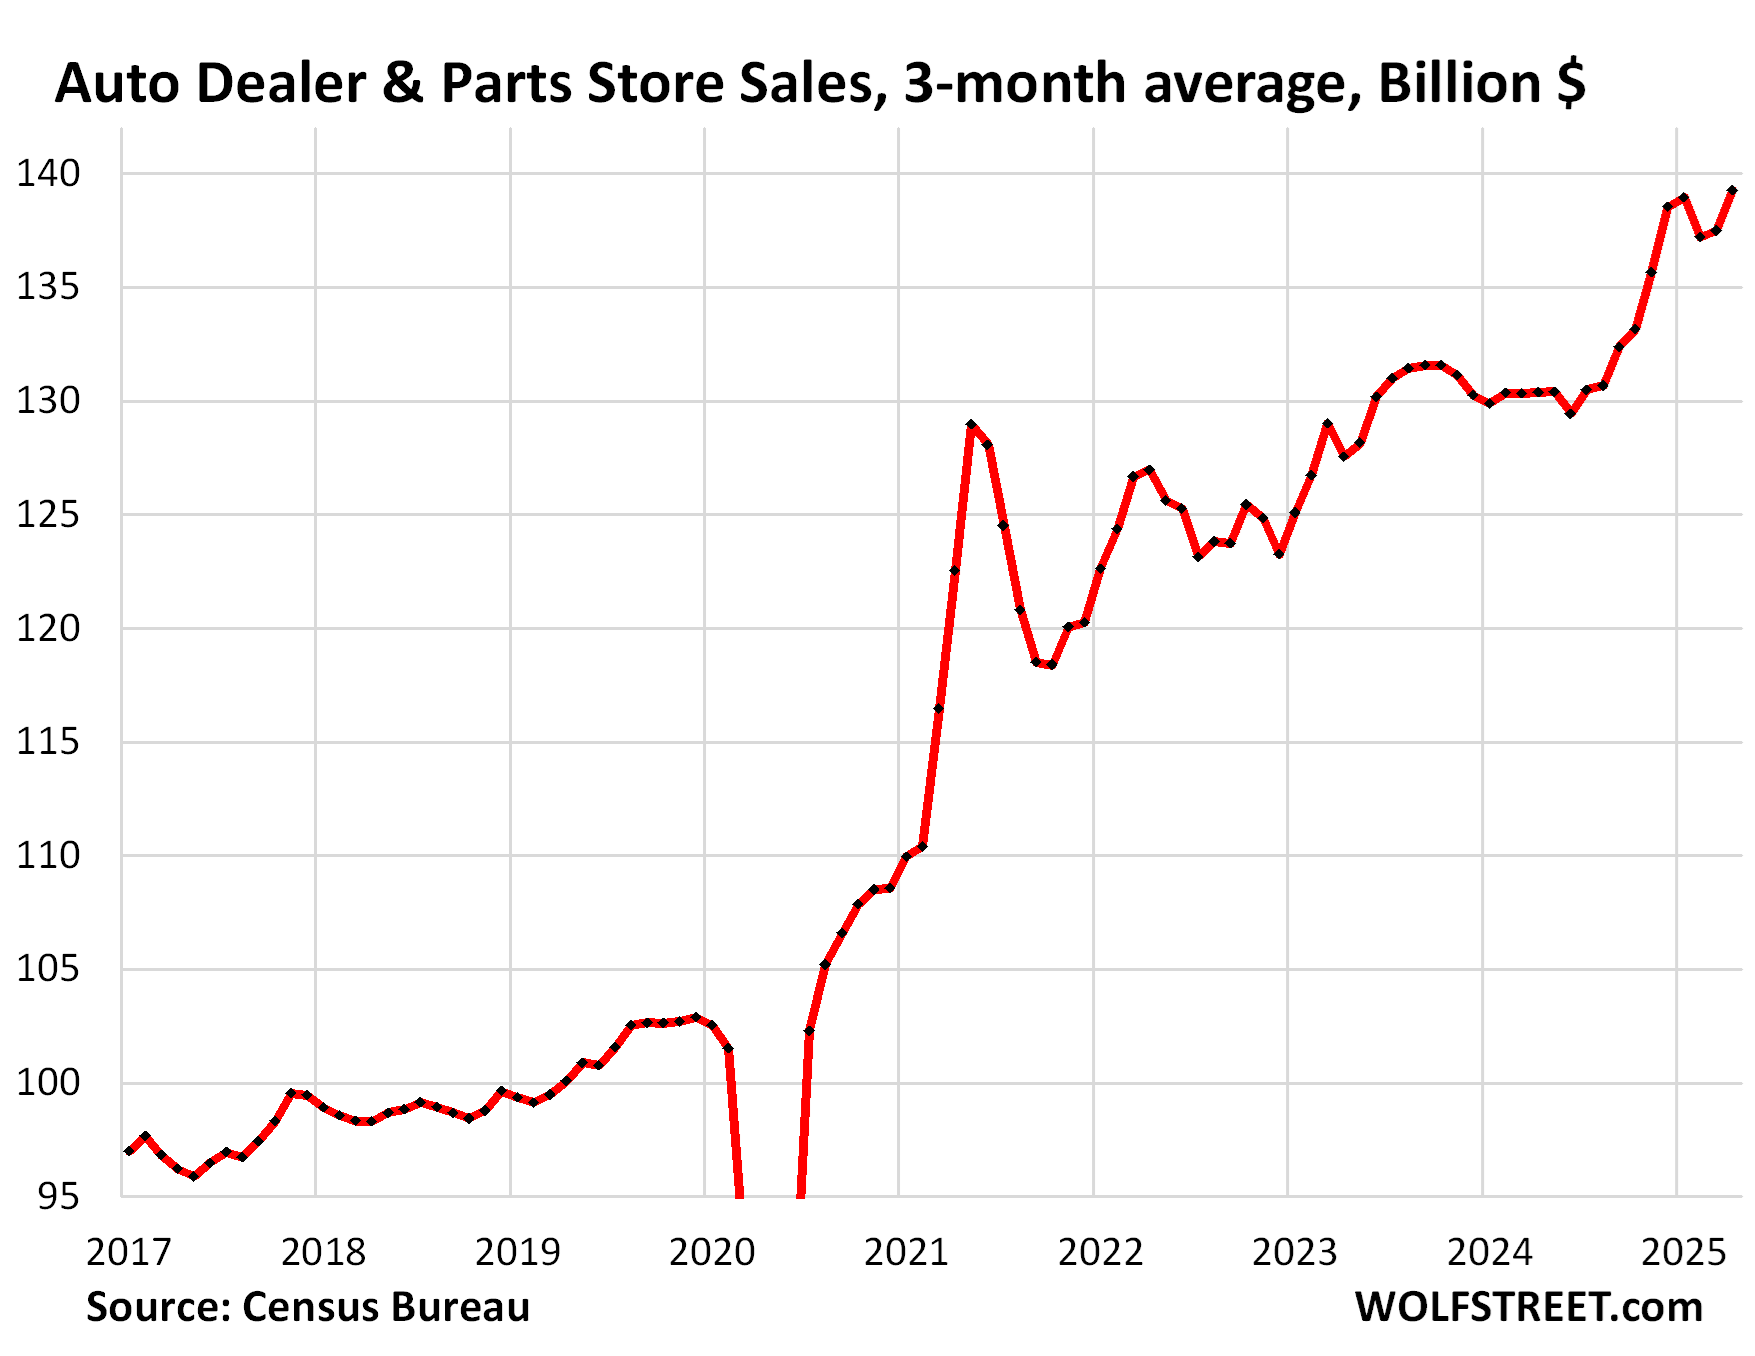
New and used vehicle dealers and parts stores (#1 retailer category, 19% of total retail sales): Sales dipped a hair from the huge record March, to $142 billion, seasonally adjusted, but jumped 9.4% year-over-year.
The three-month average sales jumped by 1.3% in April from March and was up by 6.8% year-over-year. We can see the spike in the second half of 2025, the drop early this year, and the next step higher to a new record:
Ecommerce and other “nonstore retailers” (ecommerce retailers, ecommerce operations of brick-and-mortar retailers, and stalls and markets, #2 category, 17% of total retail sales), seasonally adjusted:
- Sales: $124 billion
- Month-to-month: +0.2%
- Year-over-year: +7.5%
- 3-month average: +0.6%

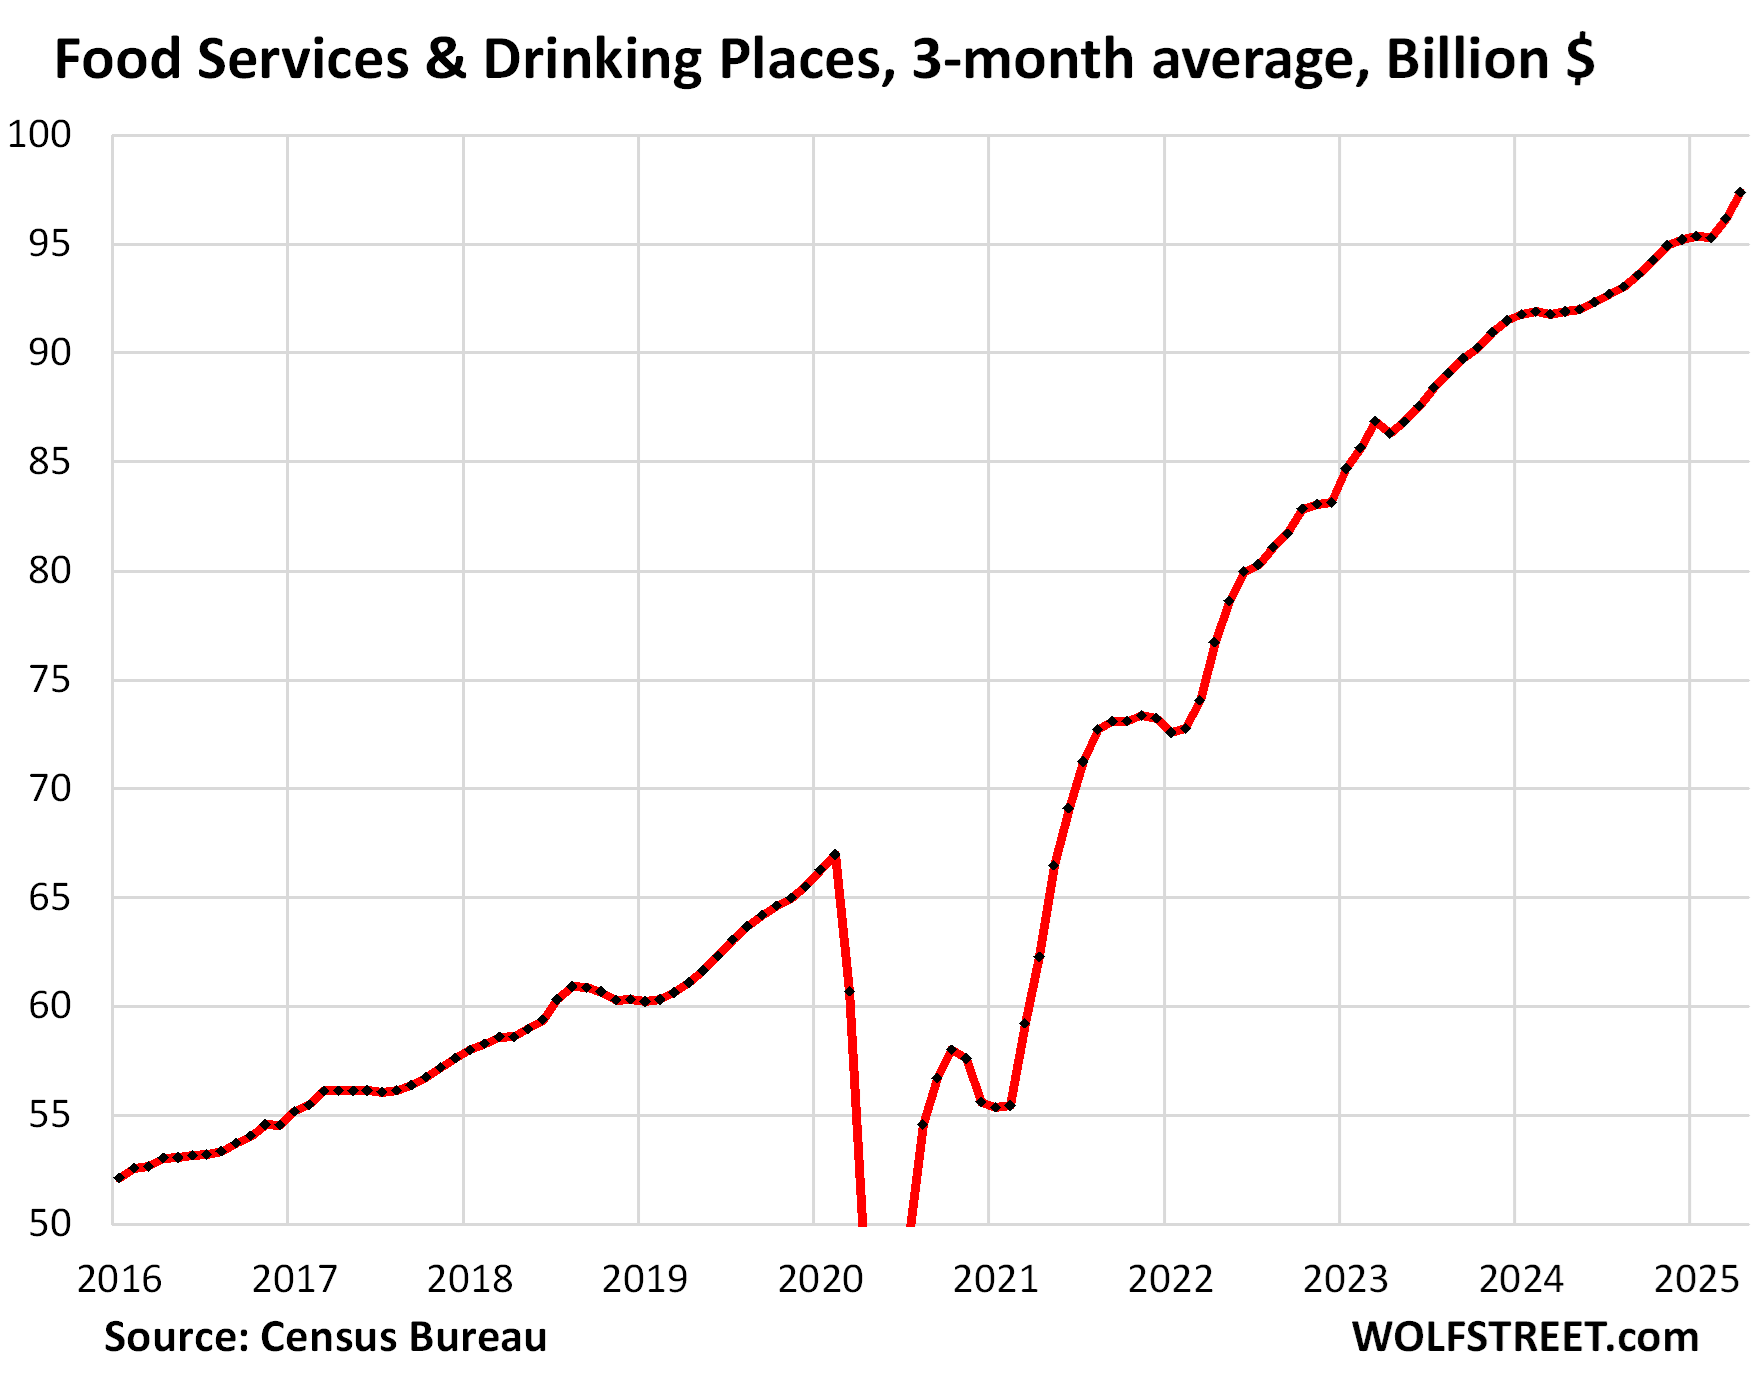
Food services and drinking places (#3 category, everything from cafeterias to restaurants and bars, 13% of total retail sales). Most of it is discretionary spending – money that consumers want to spend.
Our Drunken Sailors, as we’ve come to call them facetiously and lovingly, are back on track. Maybe widespread bad weather kept them at home in early 2025, but they splurged in March and April:
- Sales: $99 billion
- Month-to-month: +1.2%
- Year-over-year: +7.8%
- 3-month average: +1.3%
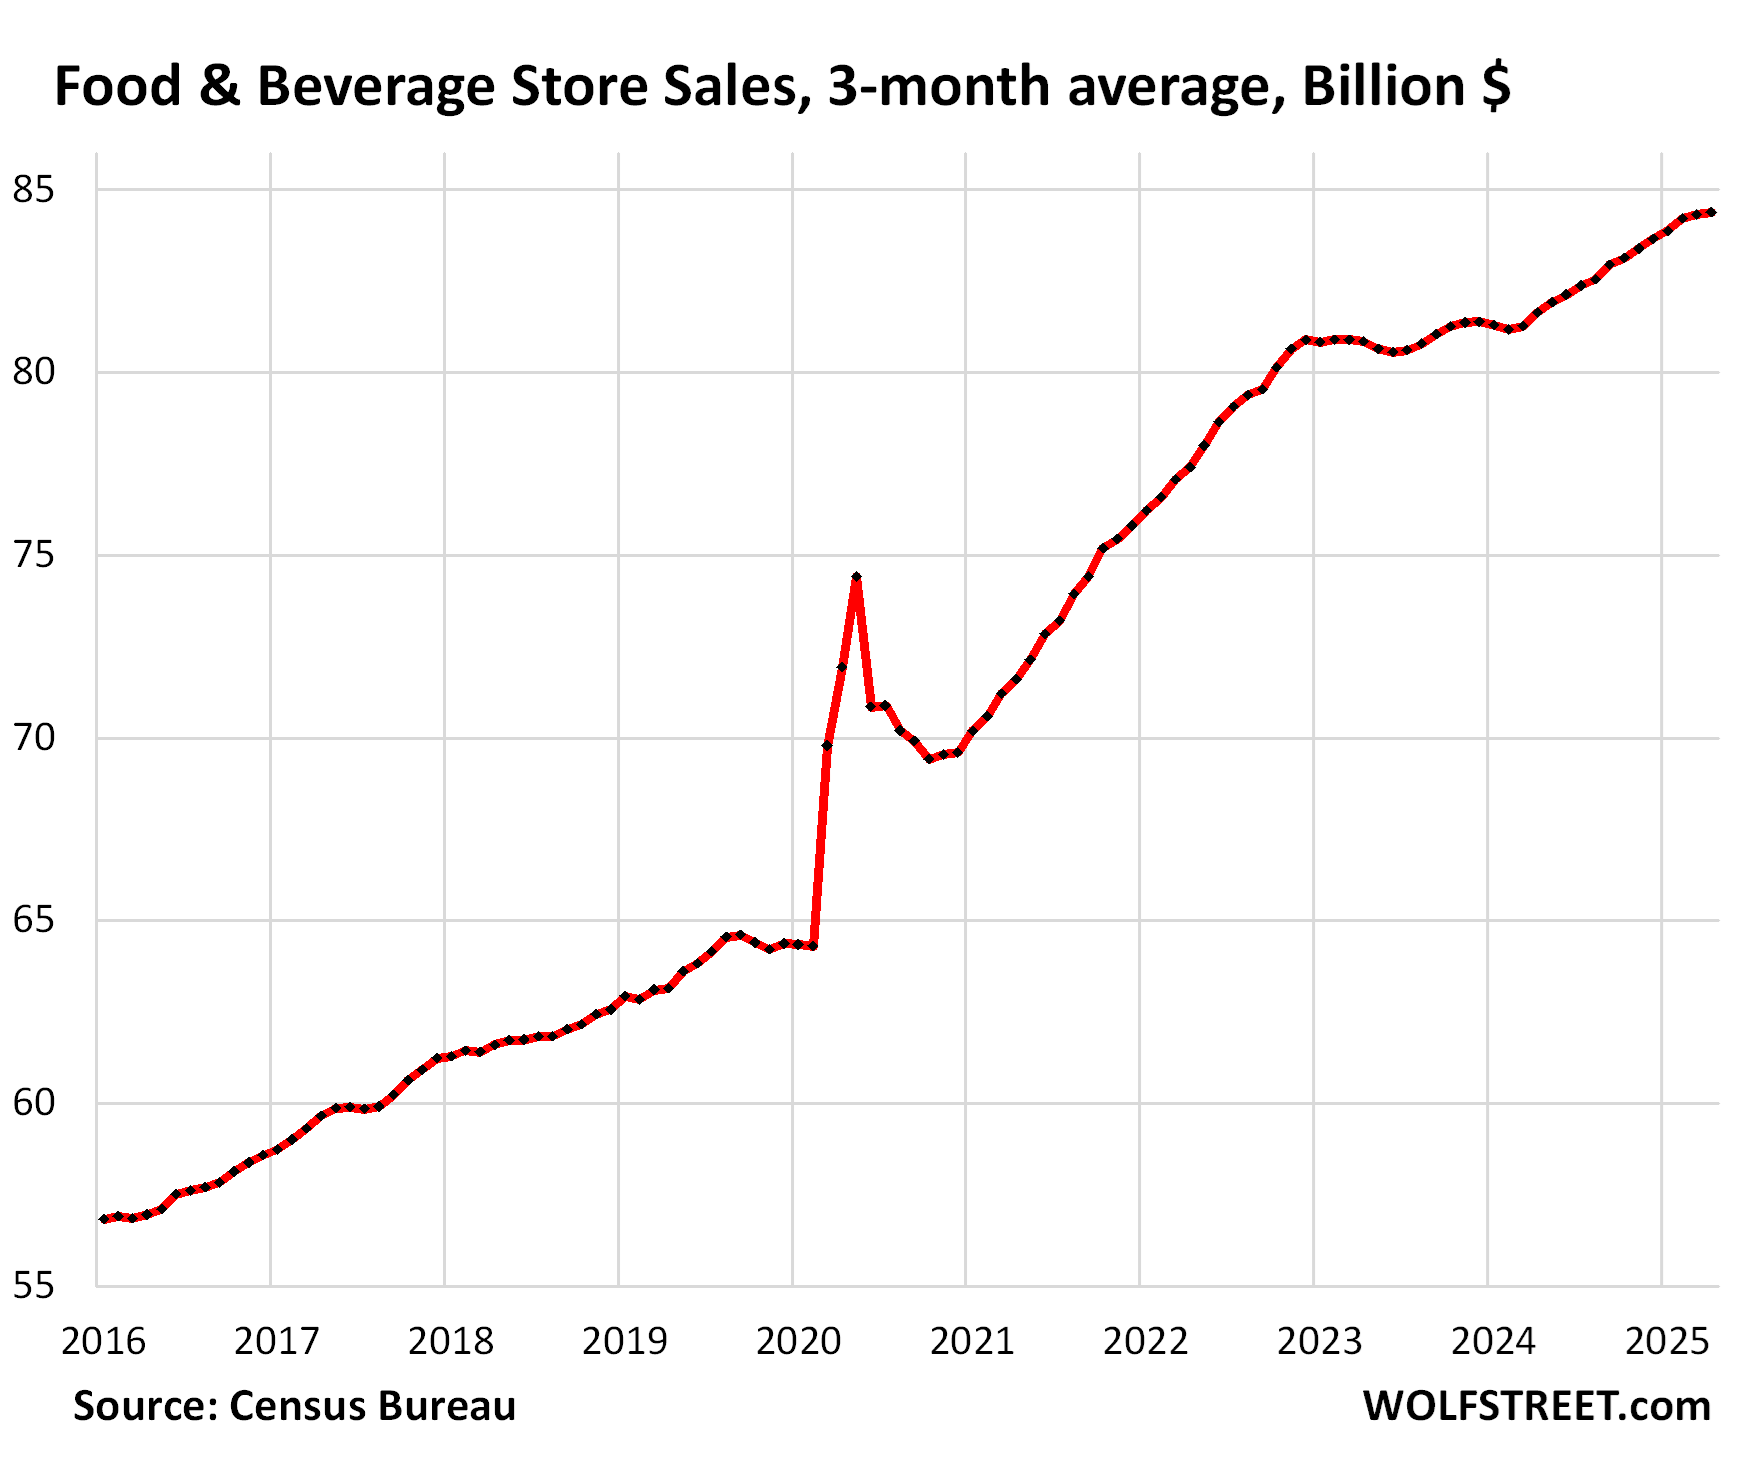
Food and Beverage Stores (#4 category, 12% of retail sales).
- Sales: $84 billion
- Month-to-month: unchanged
- Year-over-year: +2.7%
- 3-month average: +0.1%
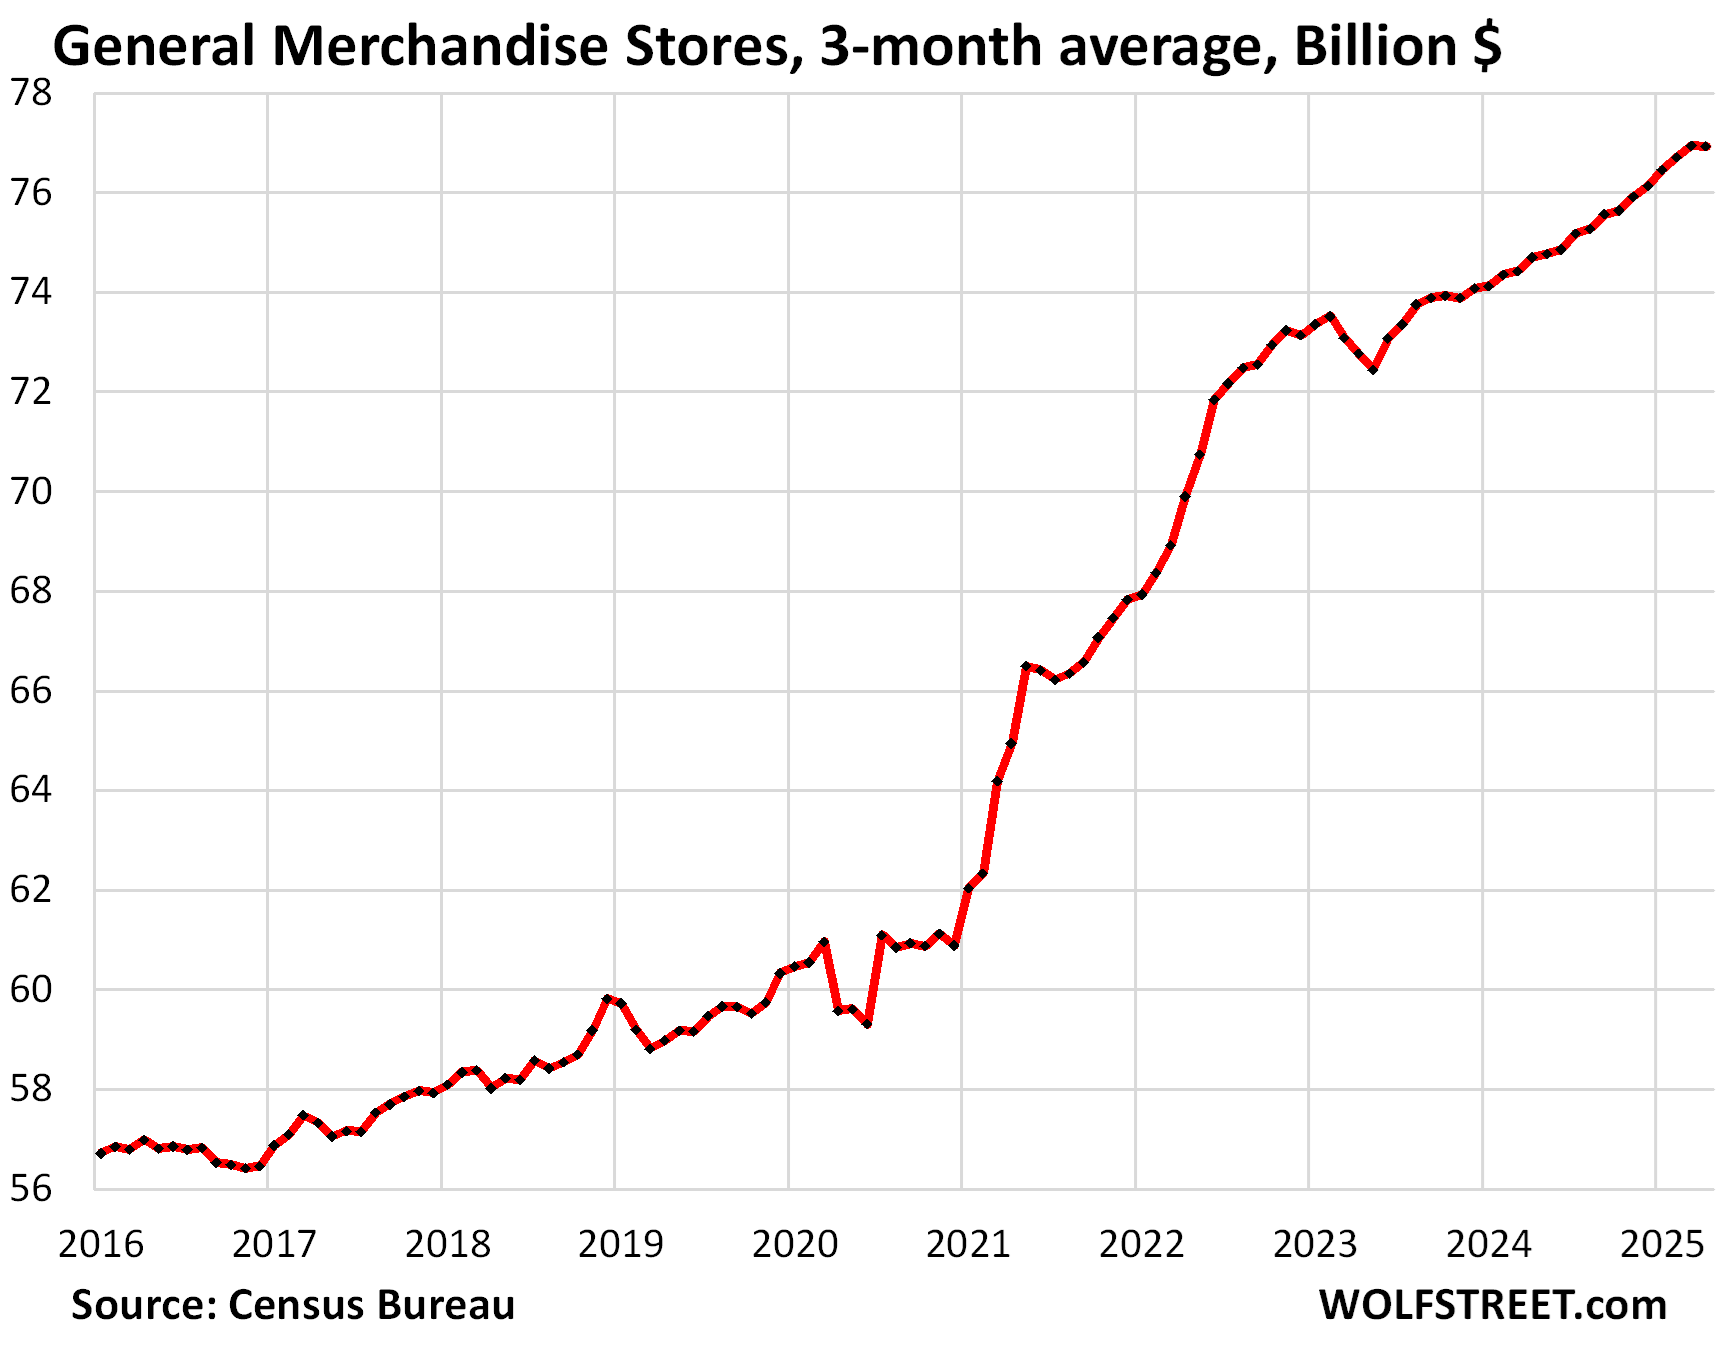
General merchandise stores (#5 category, 11% of retail sales), including retailers such as Walmart, which is also the largest grocer in the US, but not including their huge ecommerce sales; they’re included in “nonstore sales” above.
- Sales: $77 billion
- Month-to-month: -0.2%
- Year-over-year: +2.8%
- 3-month average: unchanged
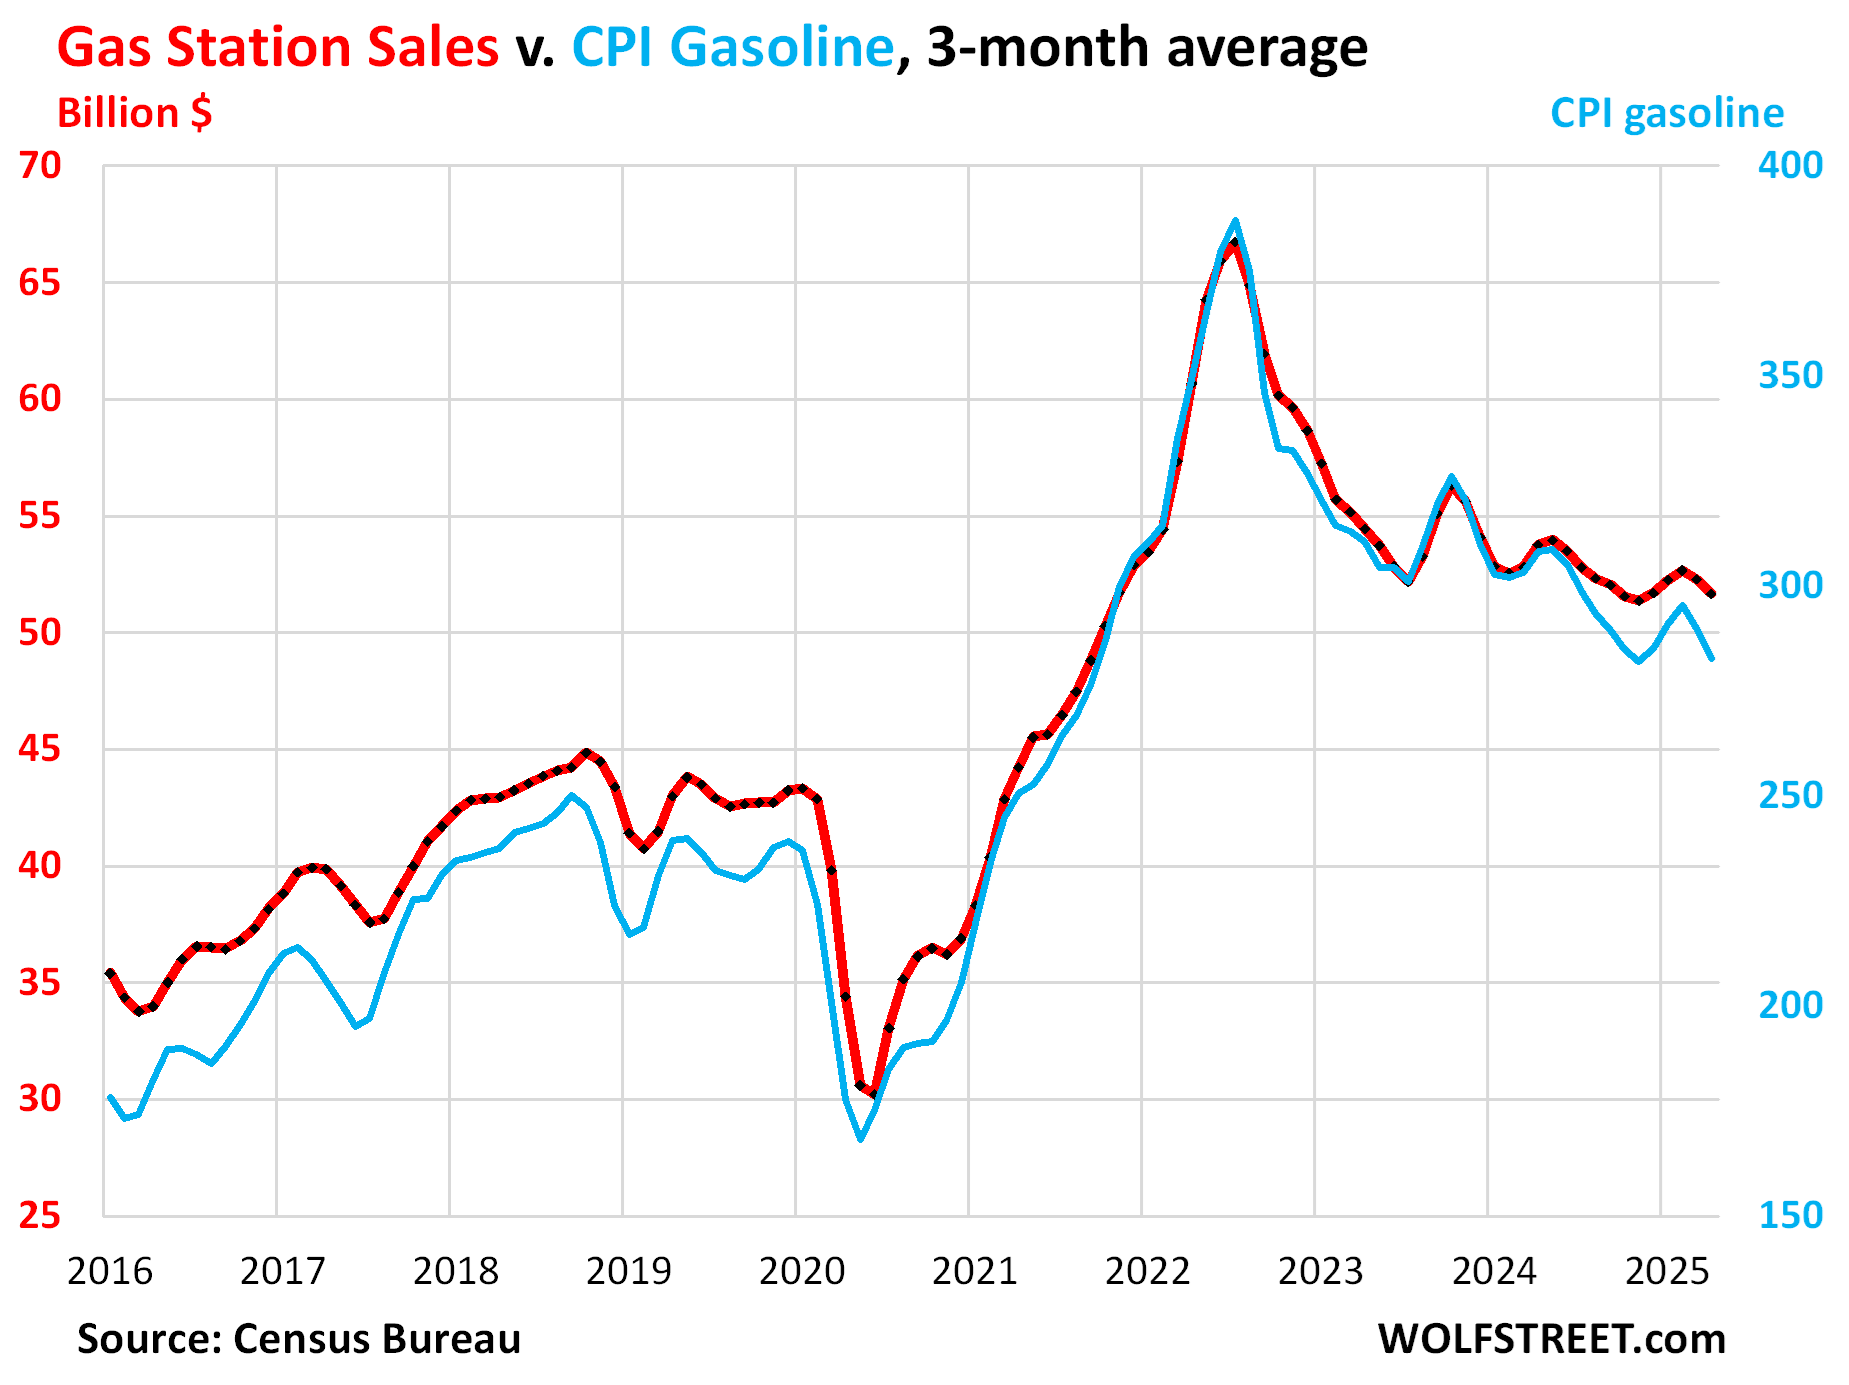
Gas stations (#6 category, 7% of retail sales). Dollar-sales at gas stations move in near-lockstep with the price of gasoline. The price of gasoline started heading lower in mid-2022. The price declines pushed down dollar-sales at gas stations. Sales at gas stations also include all the other merchandise gas stations sell:
- Sales: $51 billion
- Month-to-month: -0.5%
- Year-over-year: -6.8%
- 3-month average: -1.2%
Sales in billions of dollars at gas stations (red, left axis); and the CPI for gasoline (blue, right axis):
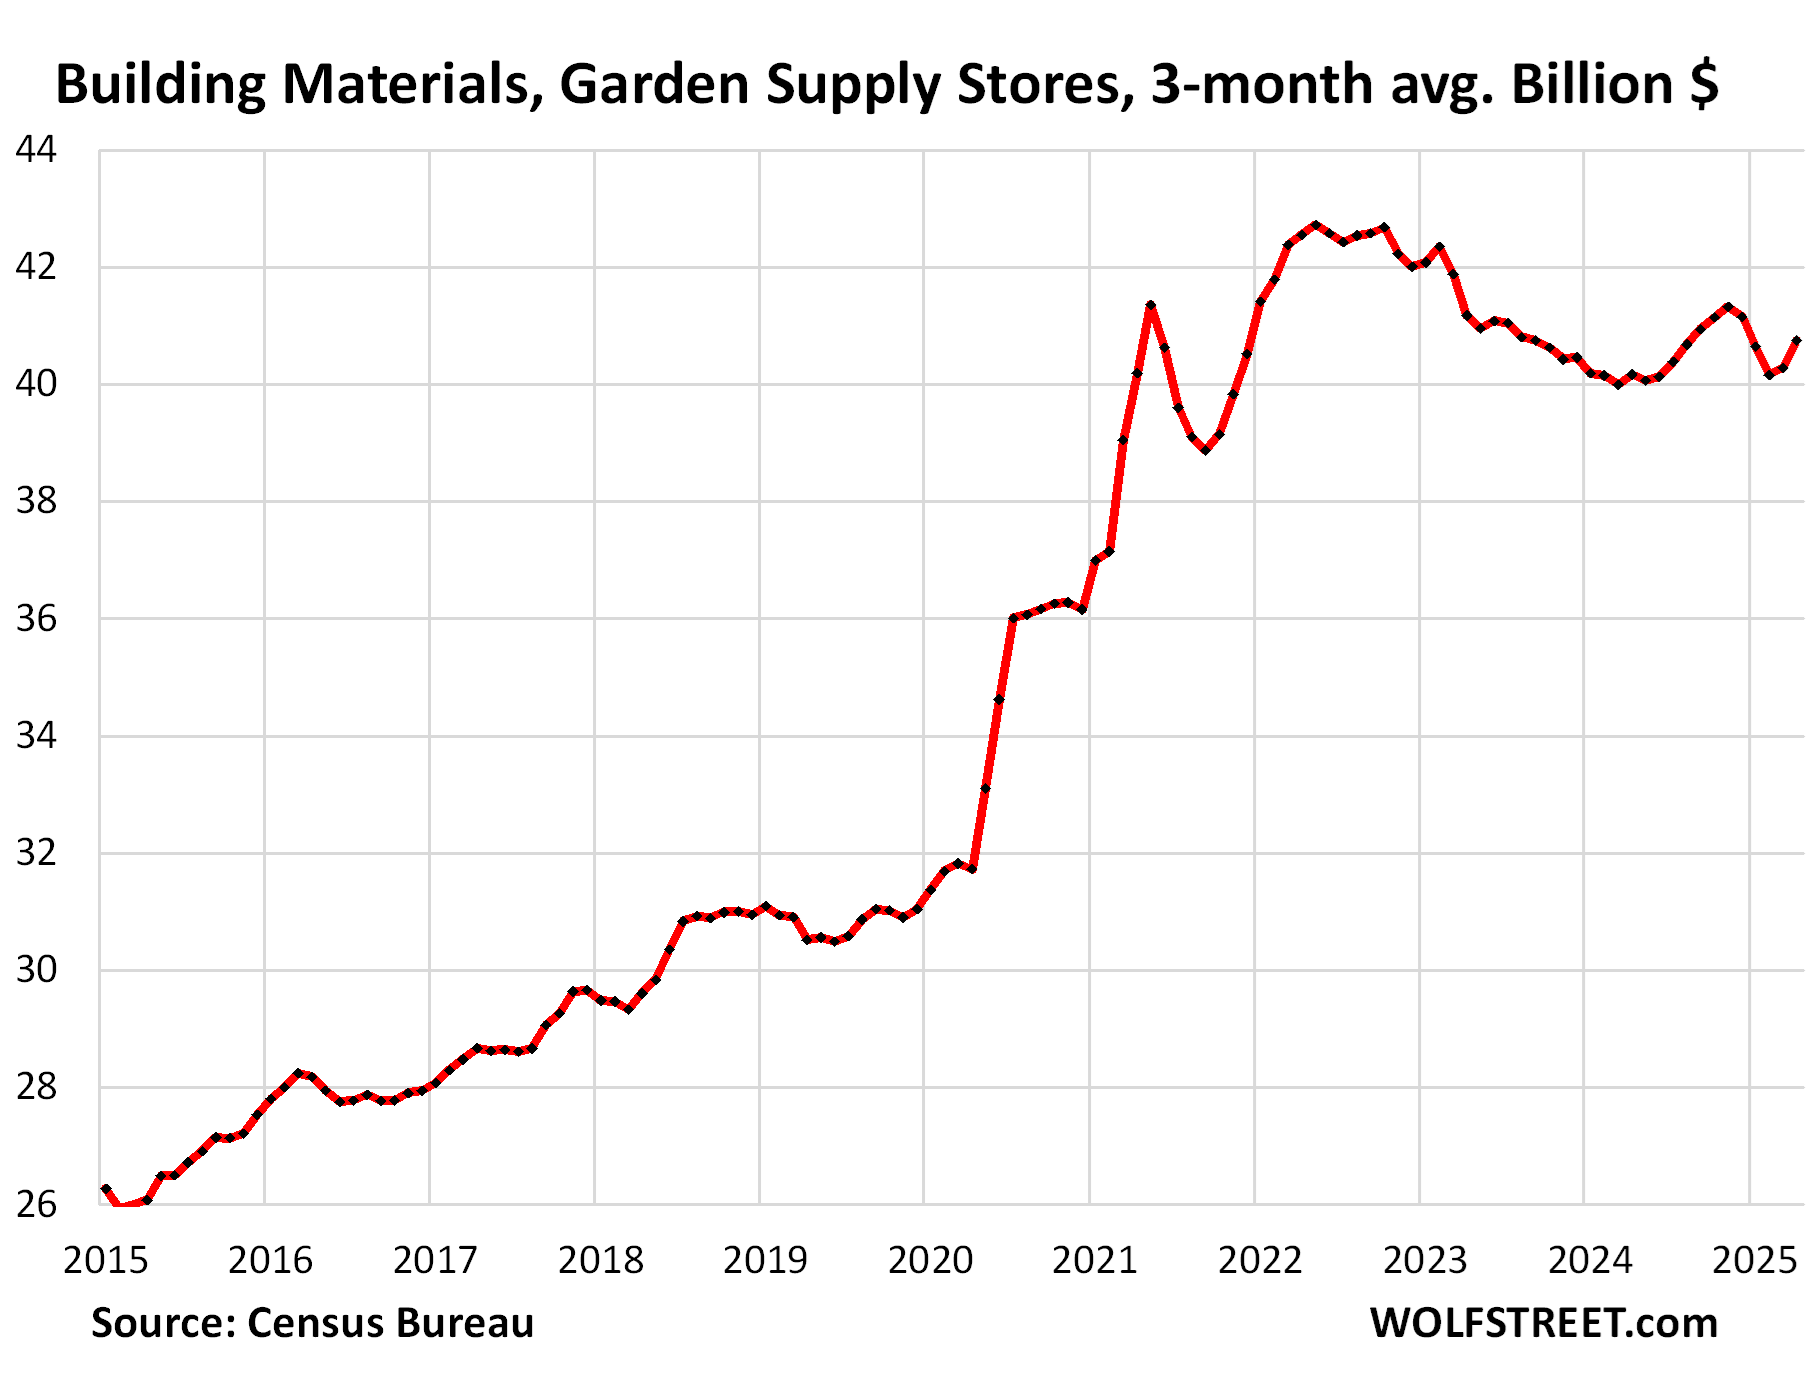
Building materials, garden supply and equipment stores (#7 category, 6% of total retail):
- Sales: $41 billion
- Month-to-month: +0.8%
- Year-over-year: +3.2%
- 3-month average: +1.2%
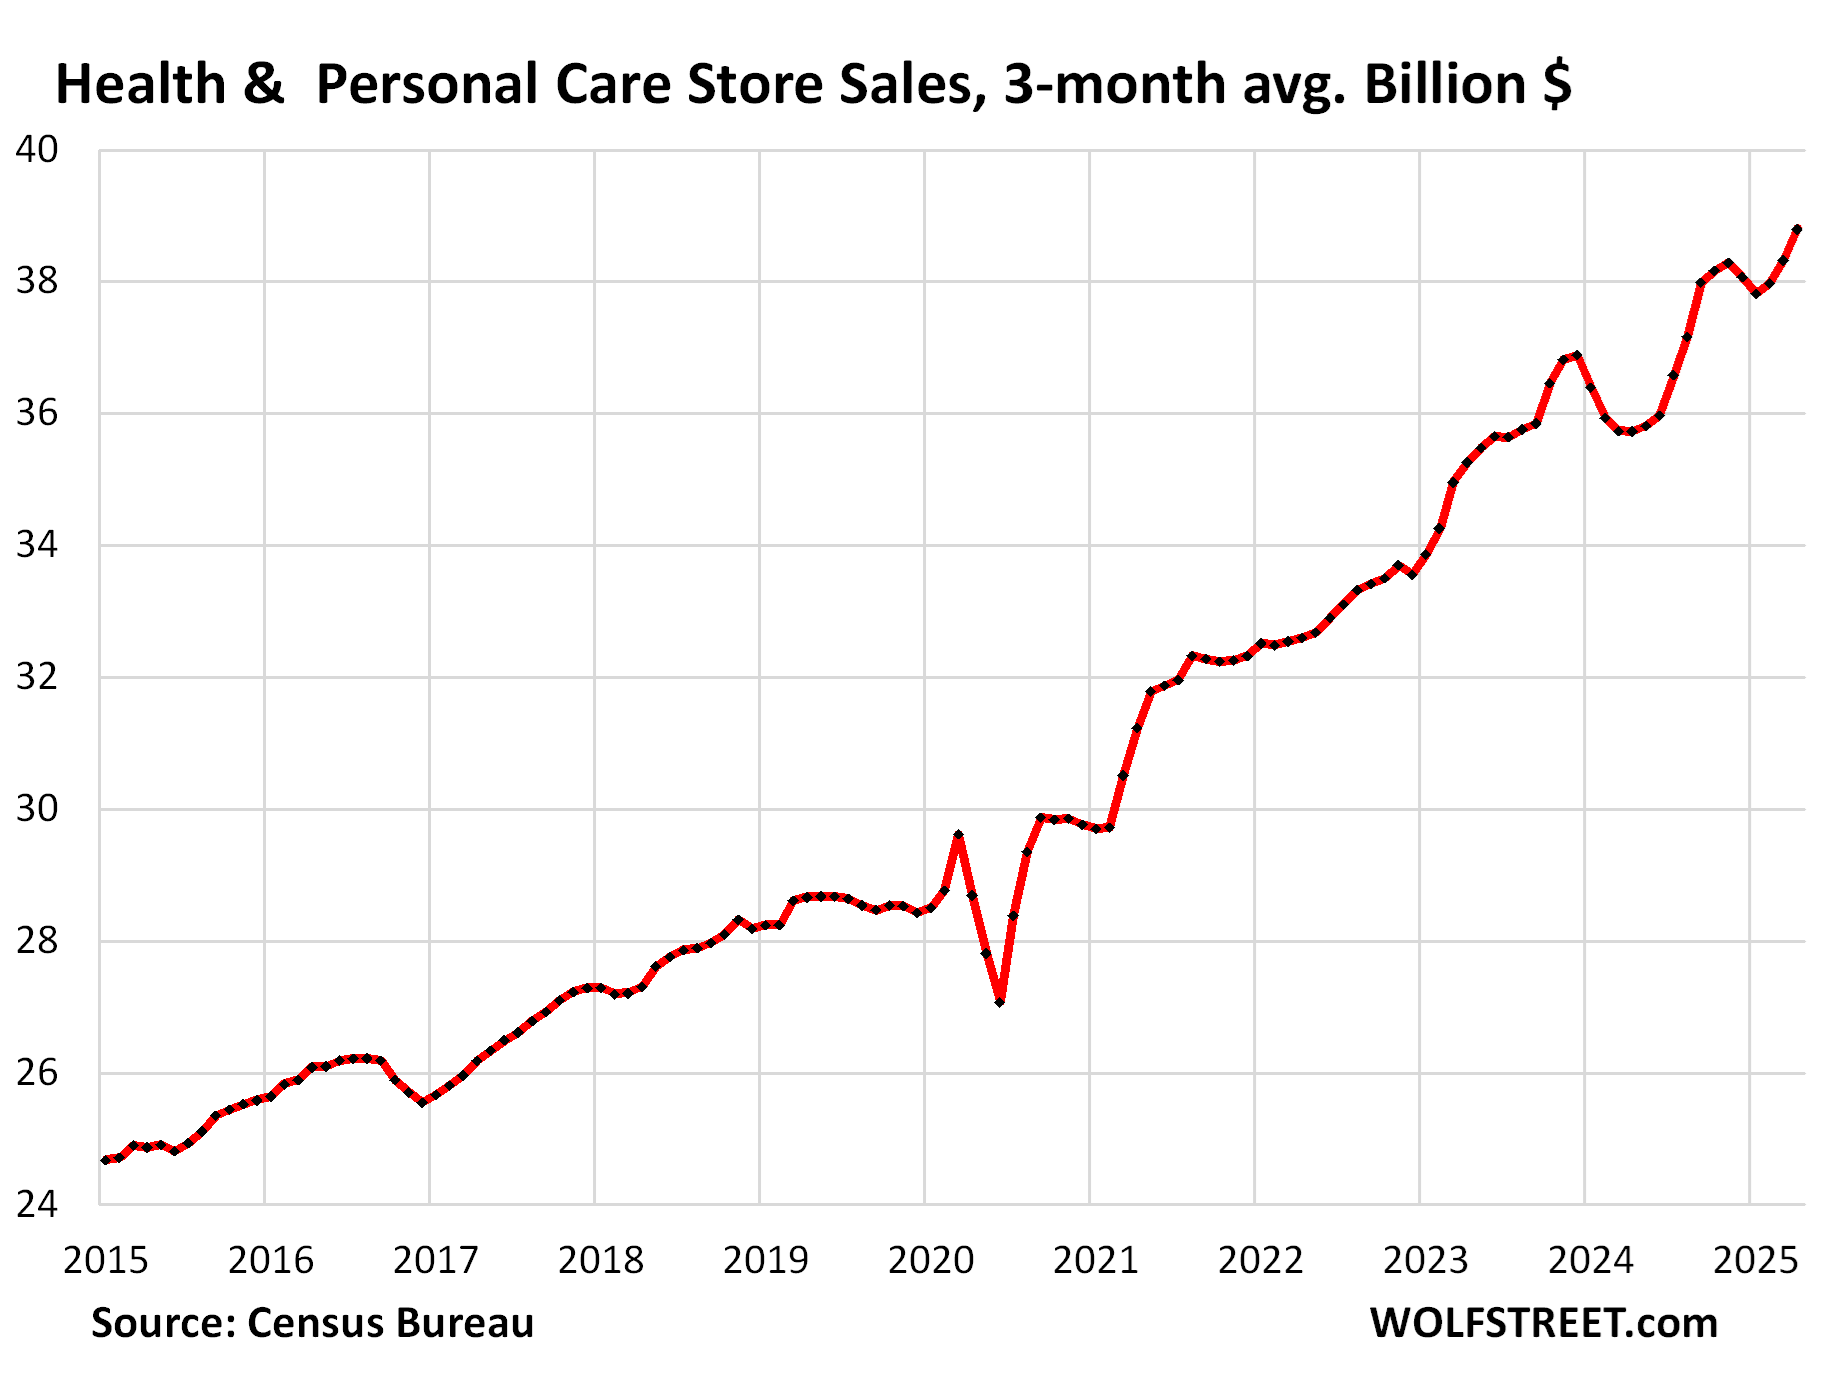
Health and personal care stores (#8 category, 5% of total retail:
- Sales: $39 billion
- Month-to-month: -0.2%
- Year-over-year: +8.5%
- 3-month average: +1.2%
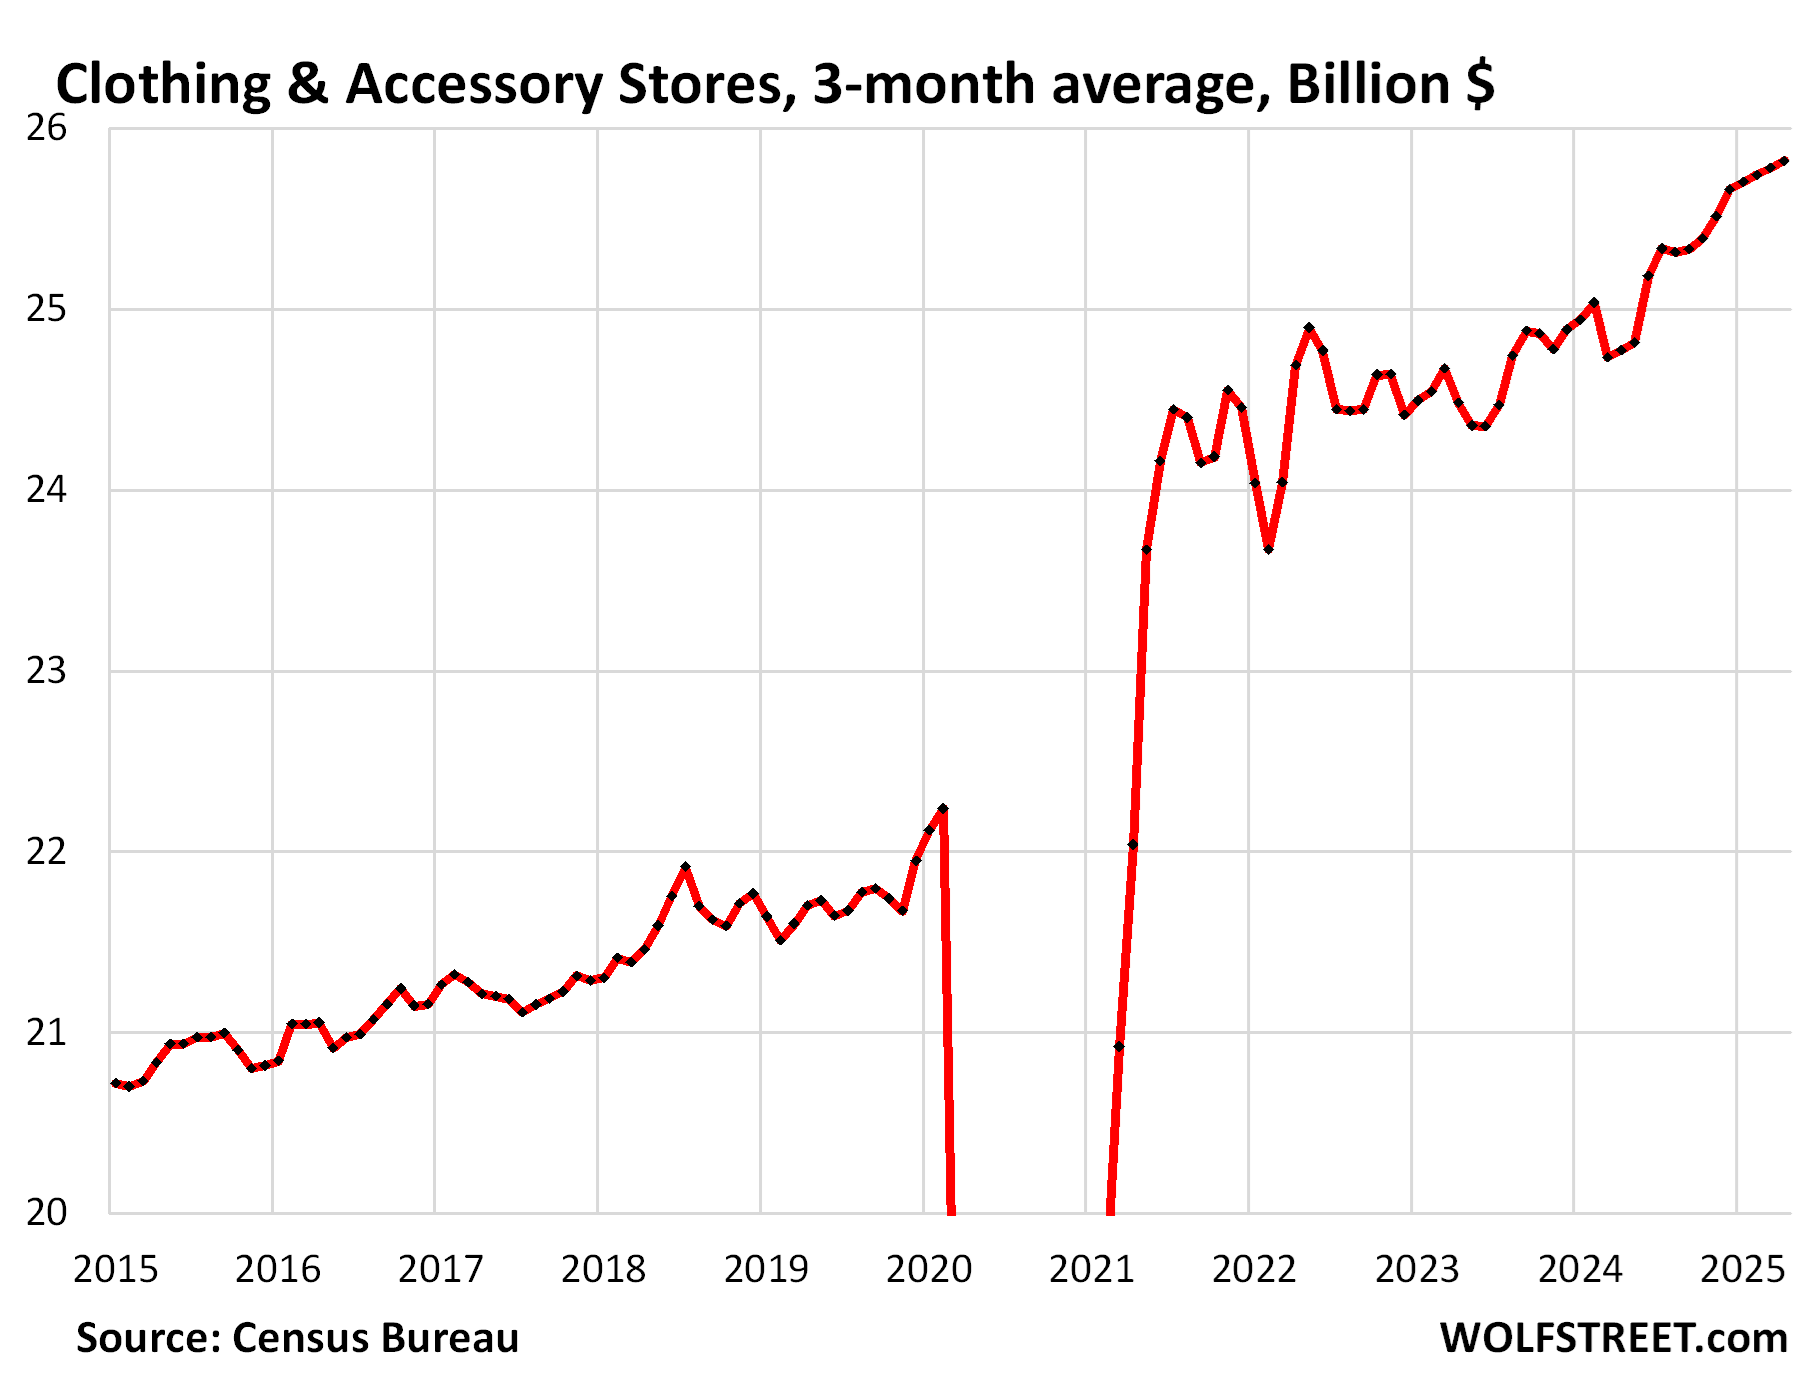
Clothing and accessory stores (#9 category, 4% of retail):
- Sales: $26 billion
- Month-to-month: -0.4%
- Year-over-year: +3.5%
- 3-month average: +0.2%
Enjoy reading WOLF STREET and want to support it? You can donate. I appreciate it immensely. Click on the mug to find out how:

![]()
Amazing resiliency, if that’s the right word. Sailors, by all means, congratulations, you first, enjoy, thanks for your service, I’ll be right behind you *wink*.
There are still to be found “mom-and-pop retailers”? That species was wiped out long ago in my region. Go Capitalism.
Walmart was held off in various small towns by local elected officials who didn’t like them very much. When the dam broke, it washed away all the mom and pop-sters.
Sure
No Wallyworld in my town.
20 miles away it goes in and like a nuke bomb the blast wave decimates every mom n pop for 60 miles out.
Wouldn’t it make sense for Walmart to partner with these mom and pop retailers to compete with Amazon by offering limited SKUs, exploiting the delivery efficiencies by using a single vehicle with the Walmart 20 miles away, allowing the retailer to excel in customer service by knowing what each customer needs and wants are. Small Town Concierge. In the old days, every successful small town shop keeper knew the idiosyncratic desires of everyone in town.
The alternative is a daily brown van with a long curved Peyronie’s painted on the side with no help to the local economy or culture.
Howdy Folks. Another excellent report showing some of US will never stop doing what we do. No matter what comes, we continue on.
Squirrels do it better.
Also, GDP now (something we should barely pay attention to, but I am because the media went crazy over it), is up to 2.5% for the second quarter.
We saw a big GDP drop from import surge, we’ll probably see a big DGP gain from decline in imports.
We saw a “small” GDP drop (-0.3%) due to a HUGE historic spike in imports.
Any data yet on whether we’ll see a historic drop in imports, with consequent impact on GDP calc?
Not sure about “historic” but shipping data points at a substantial drop of imports in Q2.
We routinely see big drops in only the 1st quarter of a weak economy. You wonder about their seasonal maladjustments?
there simply can’t be a recession for so long as the federal government is running $2 trillion deficits. period.
Reply fail!
True and I believe the FED looks at a different measure of “GDP” than most. I believe it strips out government expenditures and imports. I could be wrong though
It looks at all GDP measures, but yes, “Final sales to private domestic purchasers” is one of them, and it does provide some clarity about US private domestic demand from consumers and businesses, including fixed investments by businesses. It is GDP less exports, less imports, less government consumption expenditures, less government gross investment, less change in private inventories. It covers about 87% of GDP and presents the core of the private US economy.
Adjusted for inflation, final sales to private domestic purchasers jumped by an annual rate of 3.0% in Q1, attesting to the strength of private domestic demand and investments by consumers and businesses.
I made a big deal out of it in my GDP article here:
https://wolfstreet.com/2025/04/30/q1-gdp-whacked-by-massive-spike-in-imports-on-tariff-frontrunning-consumer-spending-grew-business-investment-soared/
The blue columns show the growth rates (left axis), the red line shows the dollars (right axis):
This is a wonderful concept/chart – I don’t recall coming across them before (I have some related questions/observations…but those can wait).
My original question (whose Ctrl-F RTGDA brought me here…) is this…do the original set of up top charts reflect nominal or real expenditures?
If nominal, then perhaps the citizenry is sour not because they are happy Drunken Sailors…but rather because they are *actually* much closer to treading water in the frozen Atlantic after the SS USD accelerated itself into the iceberg.
They aren’t waving, they’re (not quite) drowning.
Retail therapy. People just won’t deny themselves no matter what financial situation they are in. The stories are legion.
Yeah man I remember reading that one. It was a great article!
I think I will take out a HELOC and buy some Waste Management stock with the money.
I was an appraiser for 40 years. I lost count of the number of HELOC appraisals I did. Peopke buying news cars, putting in resort pools, exotic vacations, you name it.
You can’t trust Peopke as far as you can throw them.
Dang Peopkes!
;)
Invest in storage! Drunken sailors need a place to store all their lemons
For auto sales: we can see the spike at the end of 2024 (not 2025)
Can you see the spikes in Q1 better now?
https://wolfstreet.com/2025/04/03/our-drunken-sailors-are-back-new-vehicle-sales-surge-in-march-after-rising-in-january-february-best-q1-since-2019/
https://wolfstreet.com/2025/04/14/our-drunken-sailors-are-back-sales-of-used-vehicles-surge-in-march-same-as-new-vehicles-overall-retail-sales-might-look-good/
DM: Kroger, America’s second biggest grocer overcharges customers by listing false sales prices
The tactics are alleged to have lead to customers paying an average of 18 percent more on affected items.
Kroger is facing scrutiny after an investigation alleged the grocery giant has been overcharging customers by listing expired sale prices on shelves — only to ring up full prices at checkout.
The second largest grocery chain in the US used the tactic in at least 14 stores across 14 states and Washington DC, the report by the Guardian US and Consumer Reports alleges.
‘Secret shopper’ tests at stores in March, April and May found more than 150 items labeled on shelf edges with outdated discounts that no longer applied at the register.
This produced an average 18 percent markup on the items found, according to the report.
But some items jumped by as much as 60 percent.
On average, the expired discount tags were two weeks out of date, meaning that thousands of Americans could have ended up spending more than they expected on items they thought were discounted.
It comes as consumers are feeling the pinch with high grocery prices as well as the prospect of substantial price increases on everyday items as a result of Trump’s tariffs.
Food prices have rose 24 percent between 2020 and 2024, according to the US Department of Agriculture.
Never been to a Krogers, but I can say other places I shop (big names) routinely show one price on the shelf only then for you to get charged another price. Sometimes it’s because of fine print on the shelf that makes you think that’s the sale item, but in reality it isn’t. Other times it’s confusion over which item is which, organic or not, and other times it’s just unexplainable.
If you use the app to see the sales, those are always accurate for me.
On Reddit an employee was saying they do not get the sales tags out to them fast enough to update. They actually ship them?
And who doesn’t shop by the circular or the app?
But also have had this happen rarely on a VIC sale, canned California tomatoes were full price instead of half. Went to the customer counter and received a refund.
Their apps have coupons and fuel point bonuses you can add also.
Is this evidence that consumers have capitulated to inflation?
It’s going to be interesting to see what the tariffs do. I’m doing a lot of shopping at the moment after a recent move, and I’m seeing price rises being announced left, right and centre. Looks to me like businesses have decided as a collective to *try* and pass the tariffs on to customers en masse (and a little bit more, I wouldn’t be surprised). Will it work?
The “means-of-payment” money supply is up 7 percent since its bottom last September. Only a “black swan” will slow this economy.