Active listings in San Diego +70% yoy, Los Angeles +50%, San Jose & Silicon Valley +67%; San Francisco metro +43% (highest April since at least 2016)
By Wolf Richter for WOLF STREET.
It’s not that new listings are that high; they’re not. It’s that the homes that have been listed for sale aren’t selling, and the new listings pile on top of it, and overall inventory is suddenly ballooning at an astonishing rate. The same dynamic is taking place in other markets, and we discussed the the situation in Florida the other day. Now we’ll look at four major markets in California – Los Angeles County, San Diego County, the San Francisco metro, and San Jose metro (which include Silicon Valley) – and California overall.
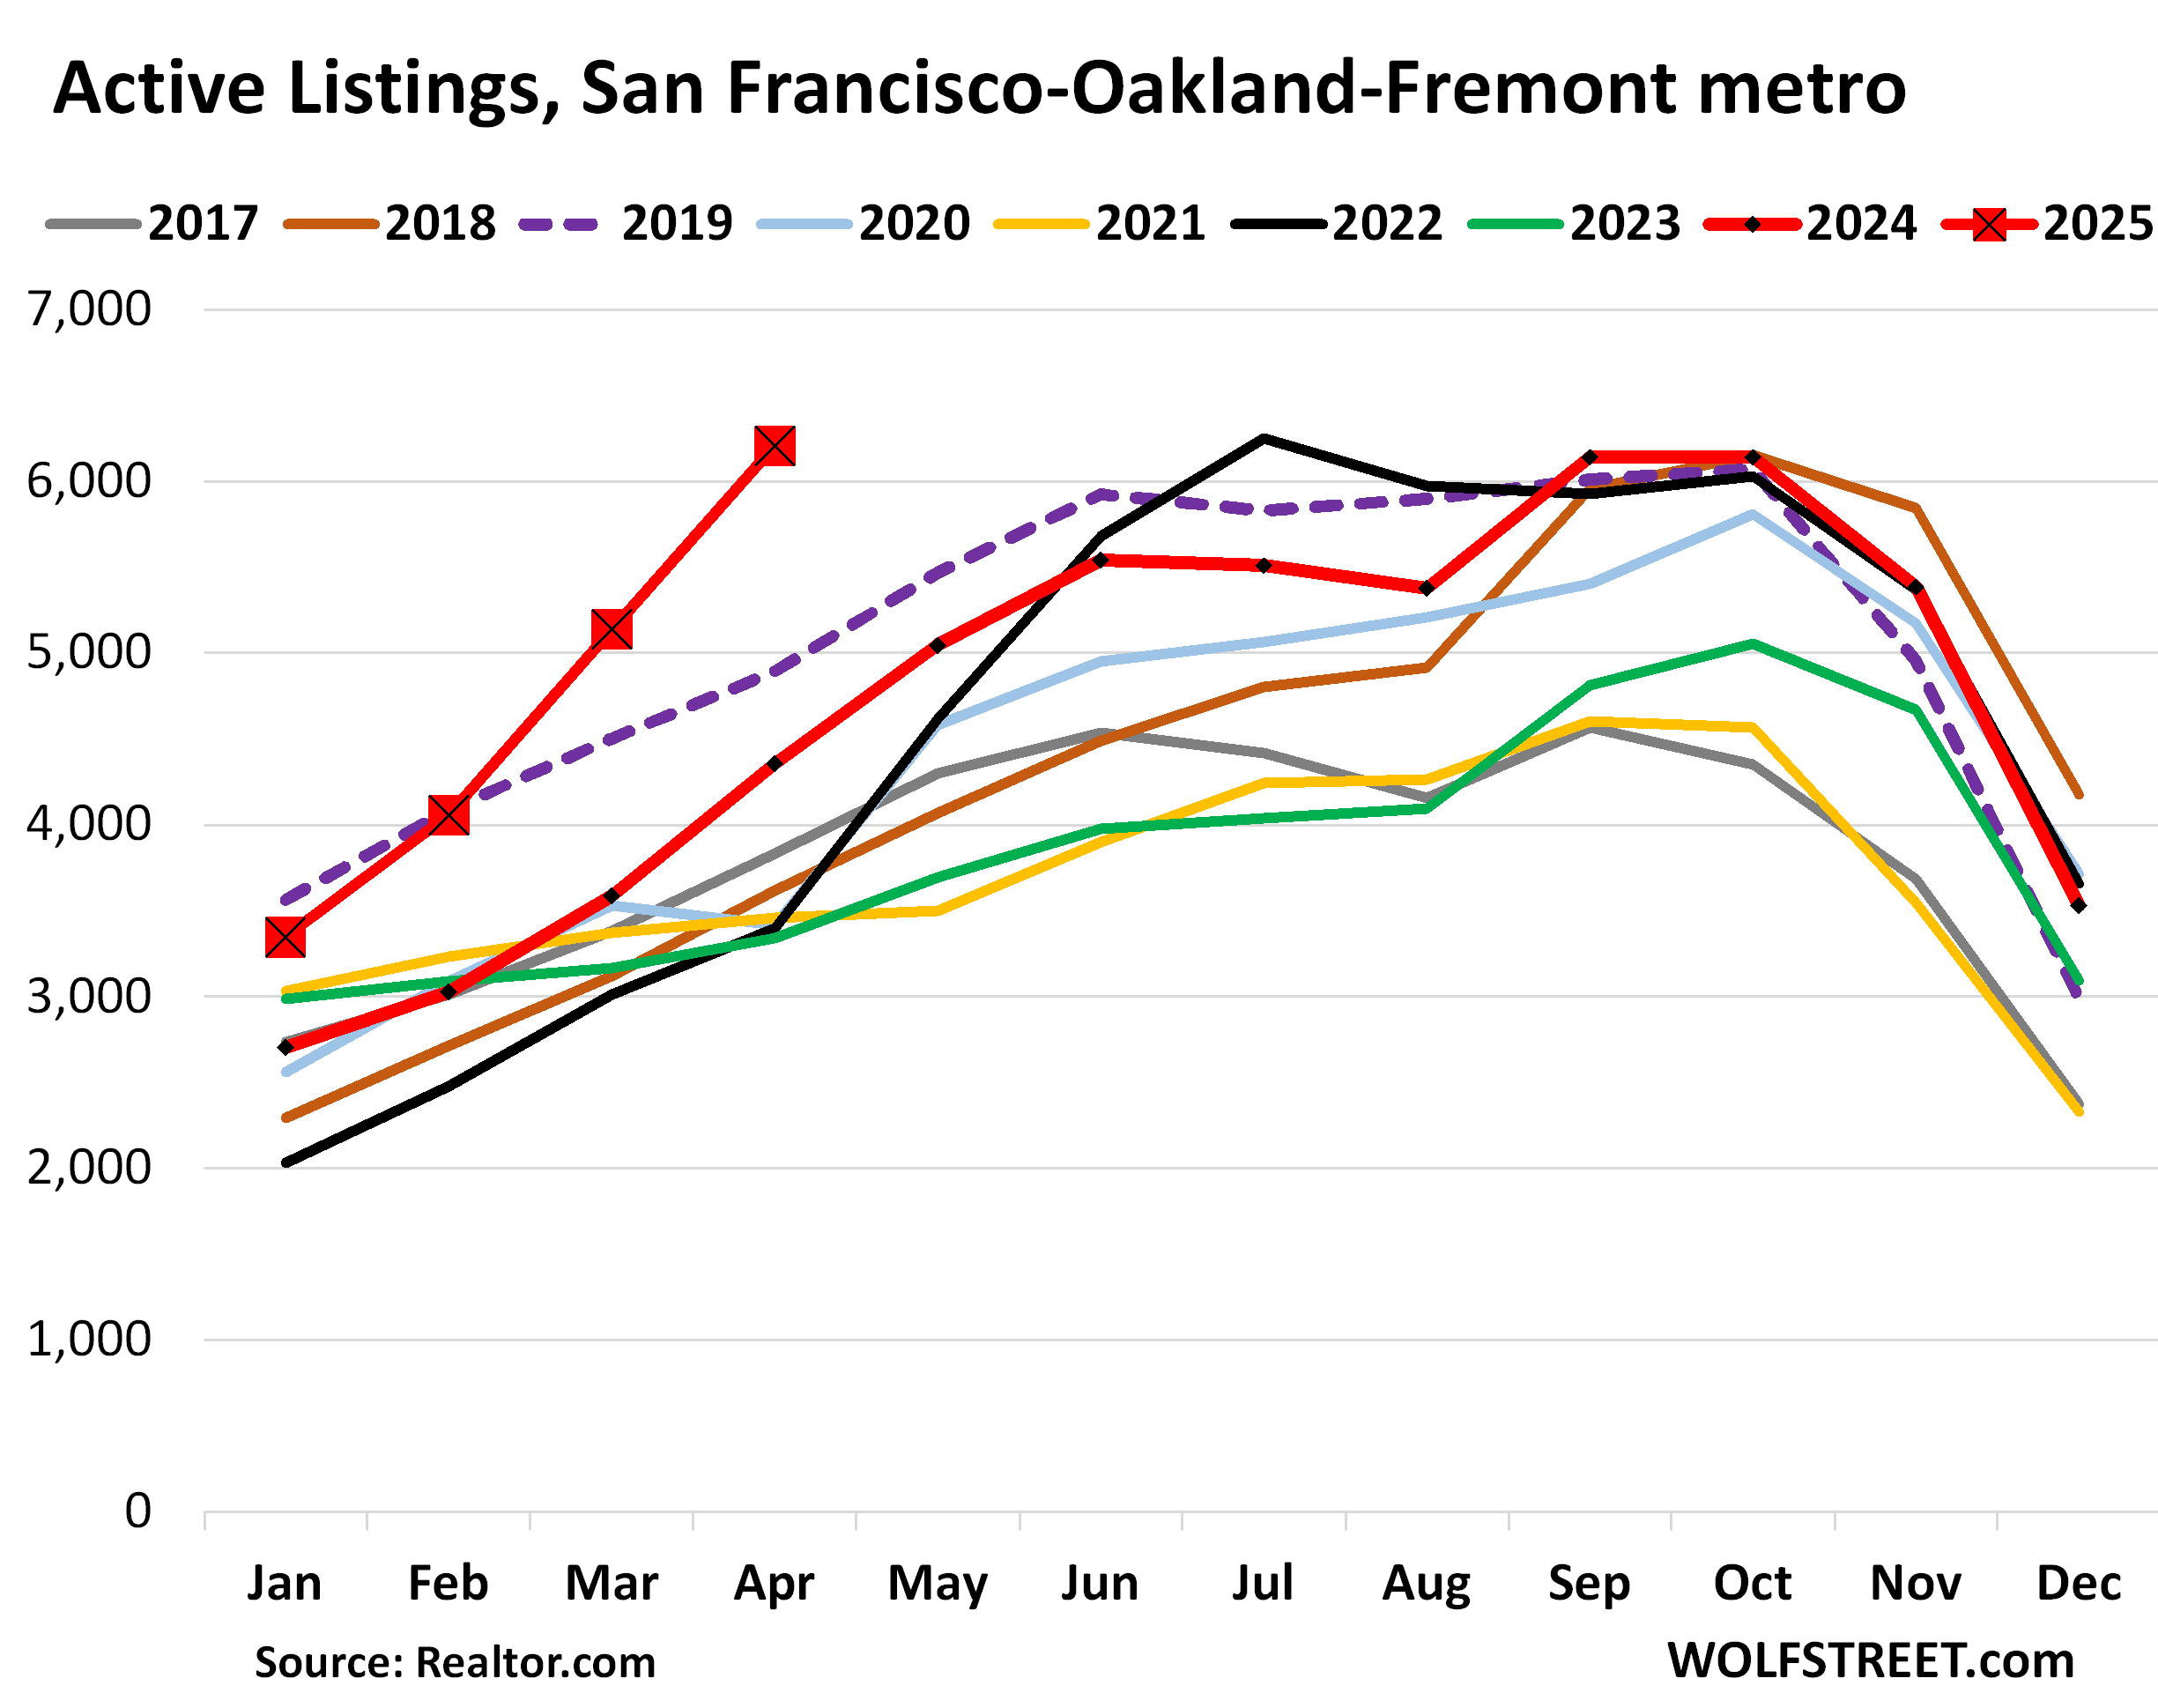
San Francisco-Oakland-Fremont metro: Year-over-year, active listings jumped by 43% in April, after three massive month-to-month spikes in a row of +21% in April, +27% in March, and +21% in February. The 6,208 homes for sale were by far the most for any April in the data from realtor.com going back to 2016. Compared to April 2019 (purple dotted line), active listings were up by 27%. That was quick, how fast that endlessly hyped “housing shortage” has evaporated.
This metropolitan statistical area (MSA) includes the counties of San Francisco and San Mateo (which includes the northern portion of Silicon Valley), part of the East Bay, and part of the North Bay.
Active listings are homes for sale that do not have a pending sale. They’re the “unsold” inventory. Total inventory, on the other hand, includes active listings (unsold inventory) plus inventory with a pending sale (sold inventory).
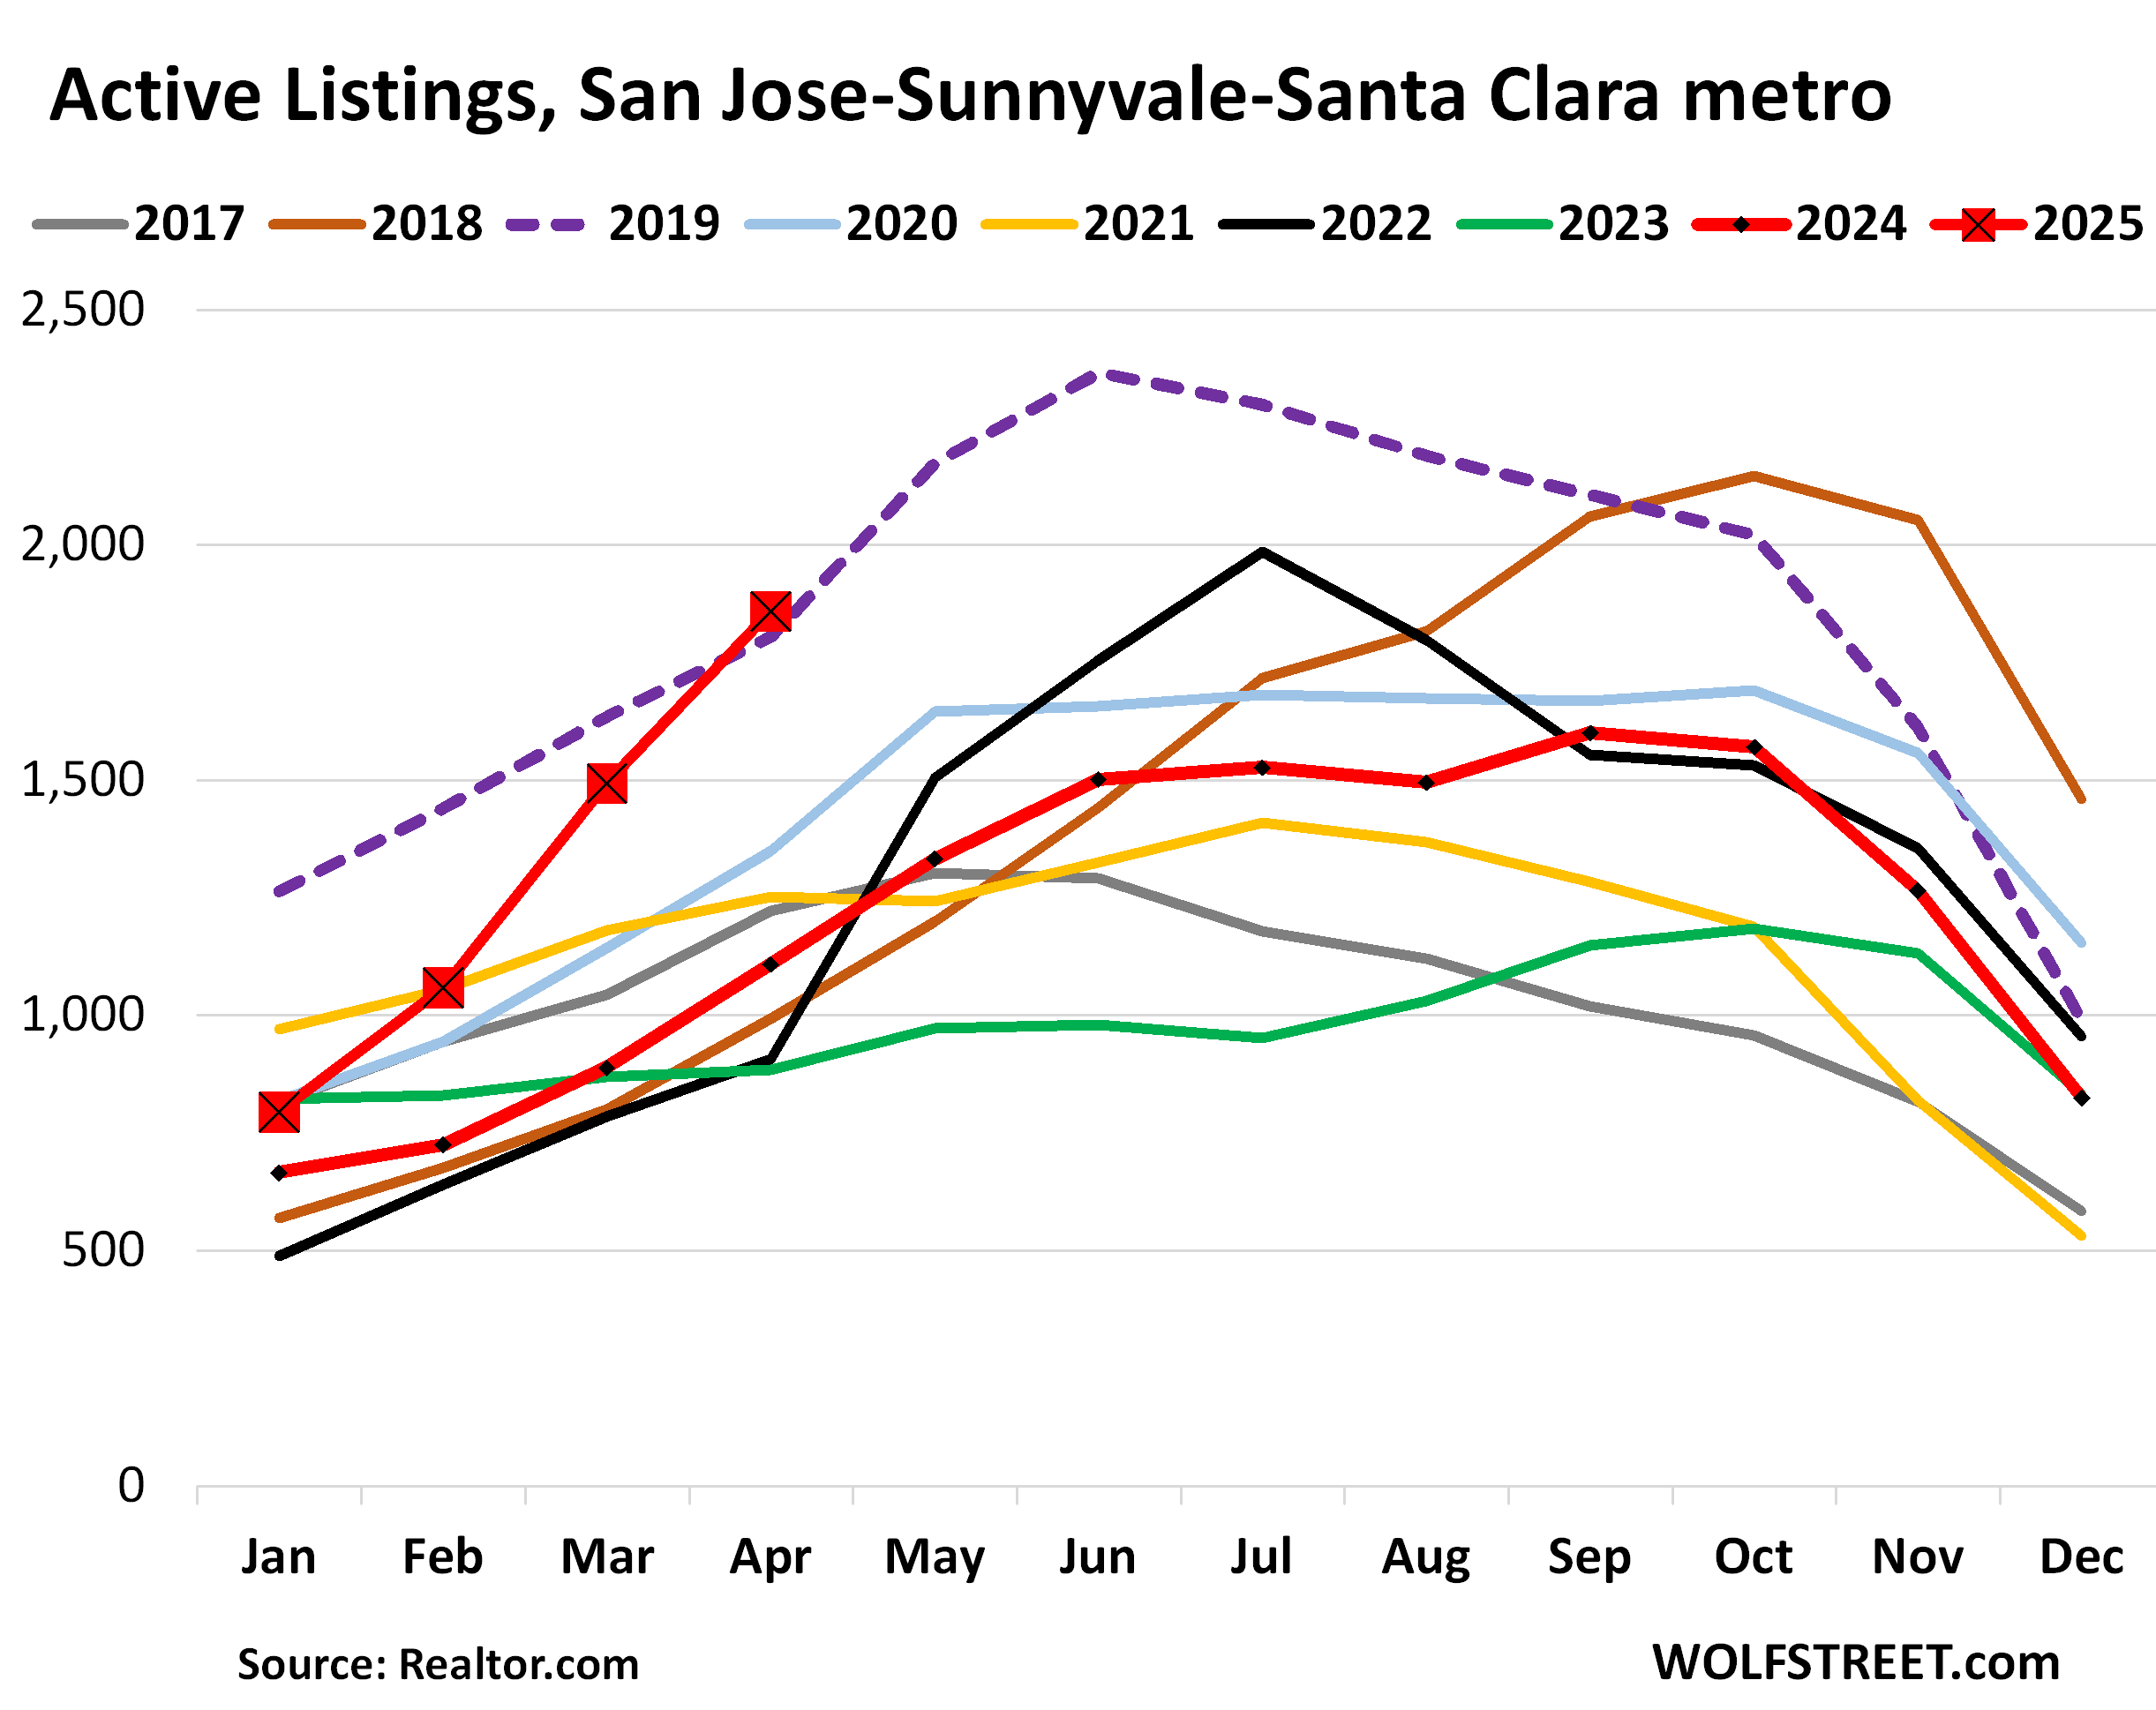
San Jose-Sunnyvale-Santa Clara metro: Active listings spiked by 68% year-over-year in April, after the three month-to-month spikes in April (+25%), March (+41%), and February (+33%). The 1,859 homes for sale were the most for any April in the data from realtor.com going back to 2016.
Compared to April 2019, active listings were up by 3%. In April 2024, active listings were still down by 39% from April 2019. That’s how fast inventory changed.
The MSA includes Santa Clara County (San Jose and the southern part of Silicon Valley) and goes south into rural areas.
In late 2018, amid the Fed’s slow rate-hike cycle back then, the average 30-year fixed mortgage rate rose to 5%, after having surpassed 4% earlier in 2018, and home sales stalled, and inventories rose sharply in the second half of 2018 (brown line) and into 2019 (dotted purple line). It’s this inventory pileup of 2019 that the current inventory has now surpassed:
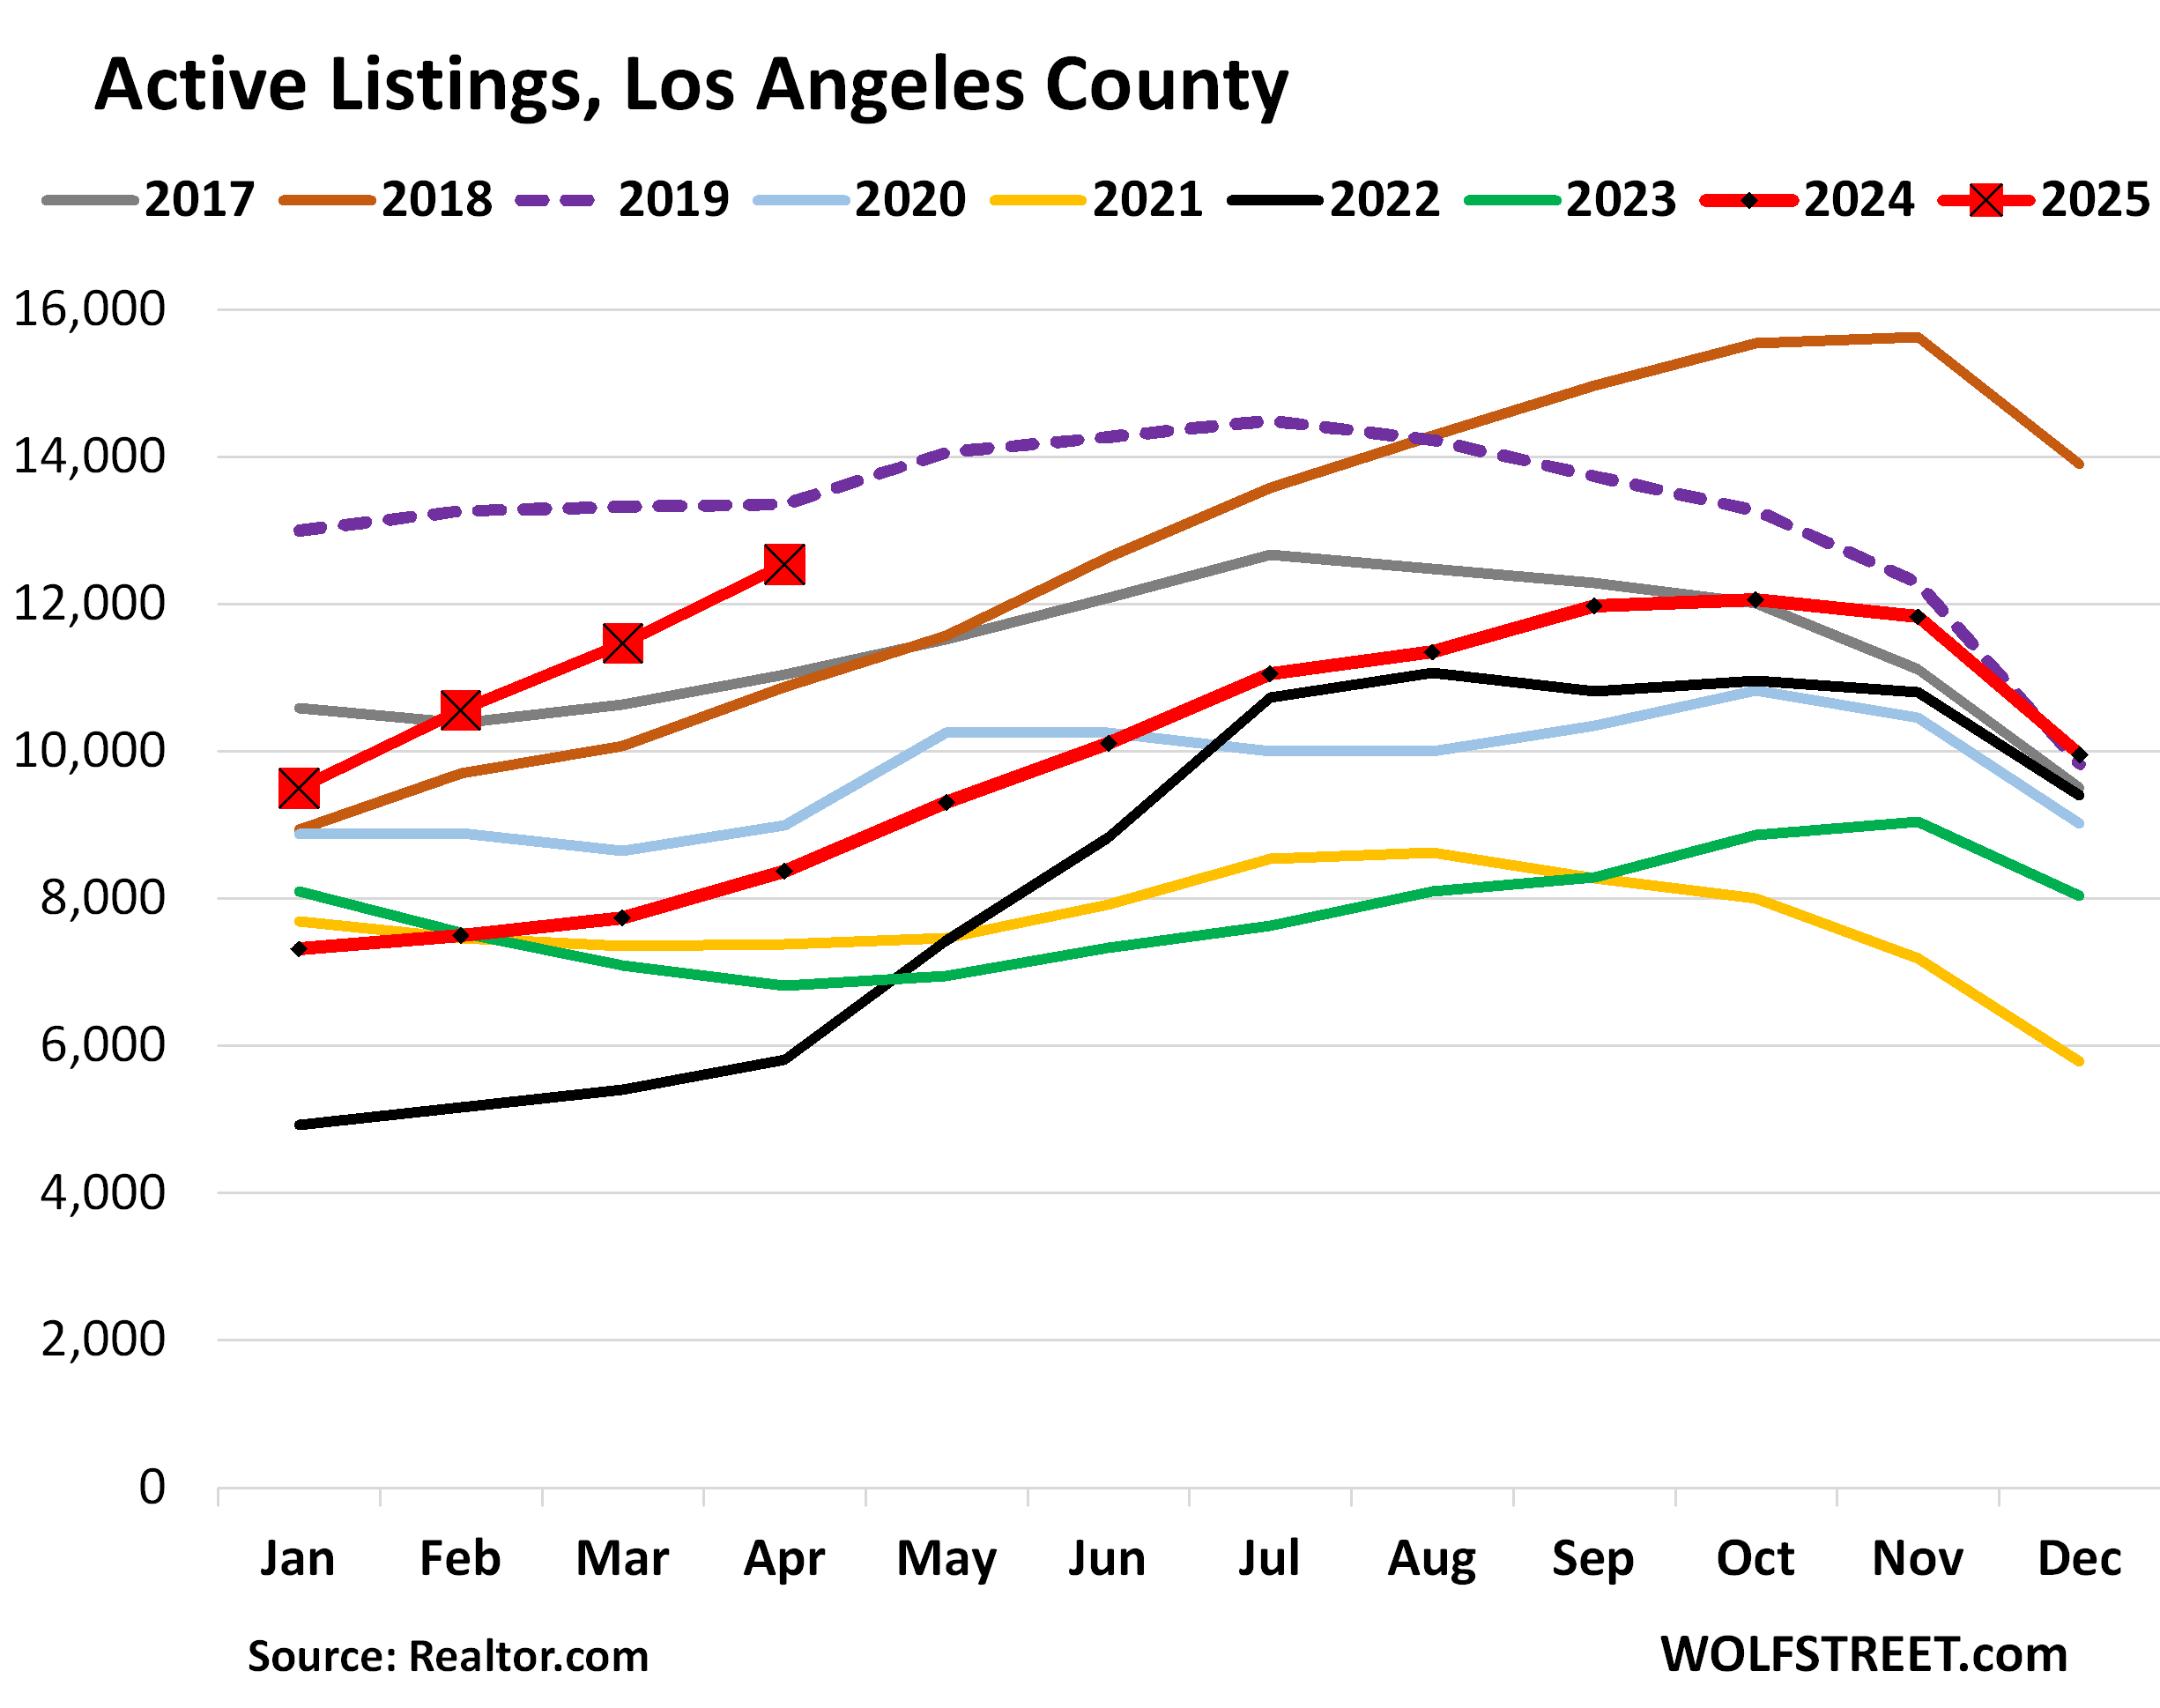
Los Angeles County: Active listings spiked by 50% year-over-year in April, to 12,535 homes for sale, the most for any April in the data from realtor.com going back to 2016, except 2019 (purple dotted line).
Active listings were 6% below April 2019, but have been rapidly catching up, from being 27% below in January, and given the trend in 2025 so far, may surpass 2019 over the next few months.
Note the inventory pile-up in the second half of 2018 (brown line), when mortgage rates hit 5%, and into 2019. That’s the inventory level that 2025 is now lining up to surpass.
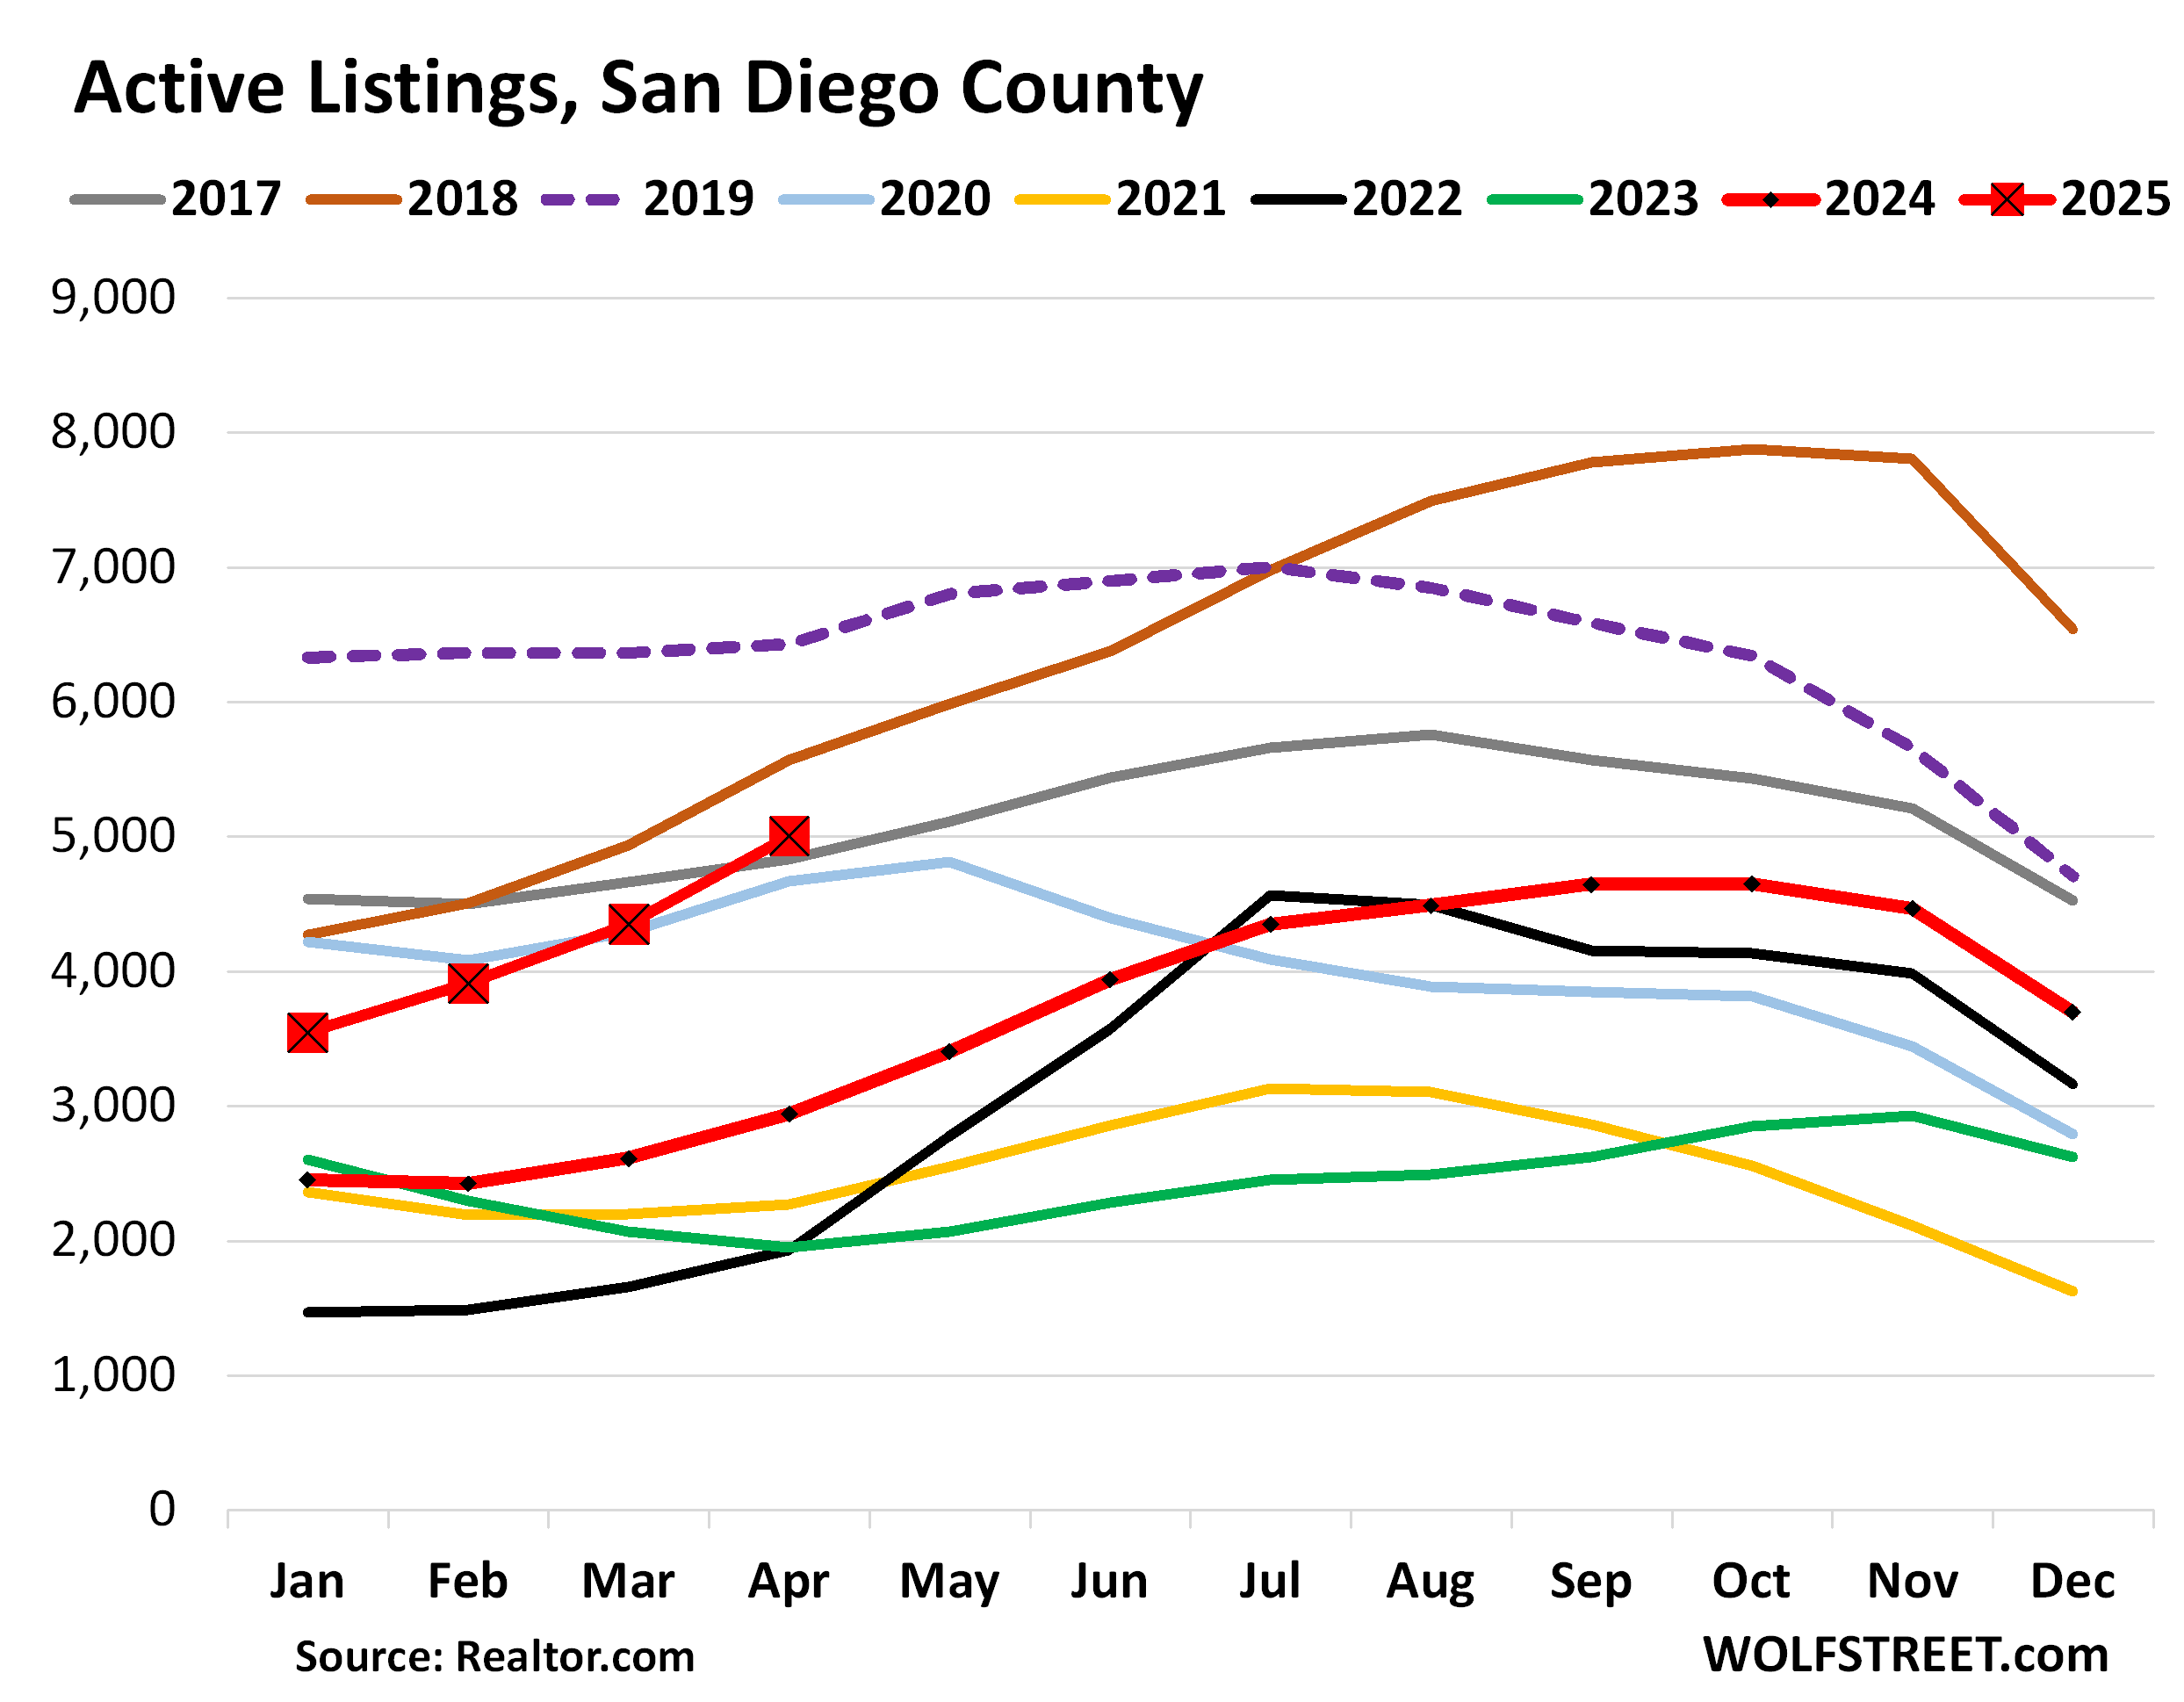
San Diego County: The surge of active listings got a late start, but it’s making up with a vengeance. Active listings spiked by 70% year-over-year, to 5,004 homes for sale, the highest for any April since 2019 and 2018, but higher than 2017, in the data going back to 2016.
Compared to 2019 (dotted purple line), active listings in 2025 halved the gap over the past four months, from being 44% below in January to being just 22% below in April.
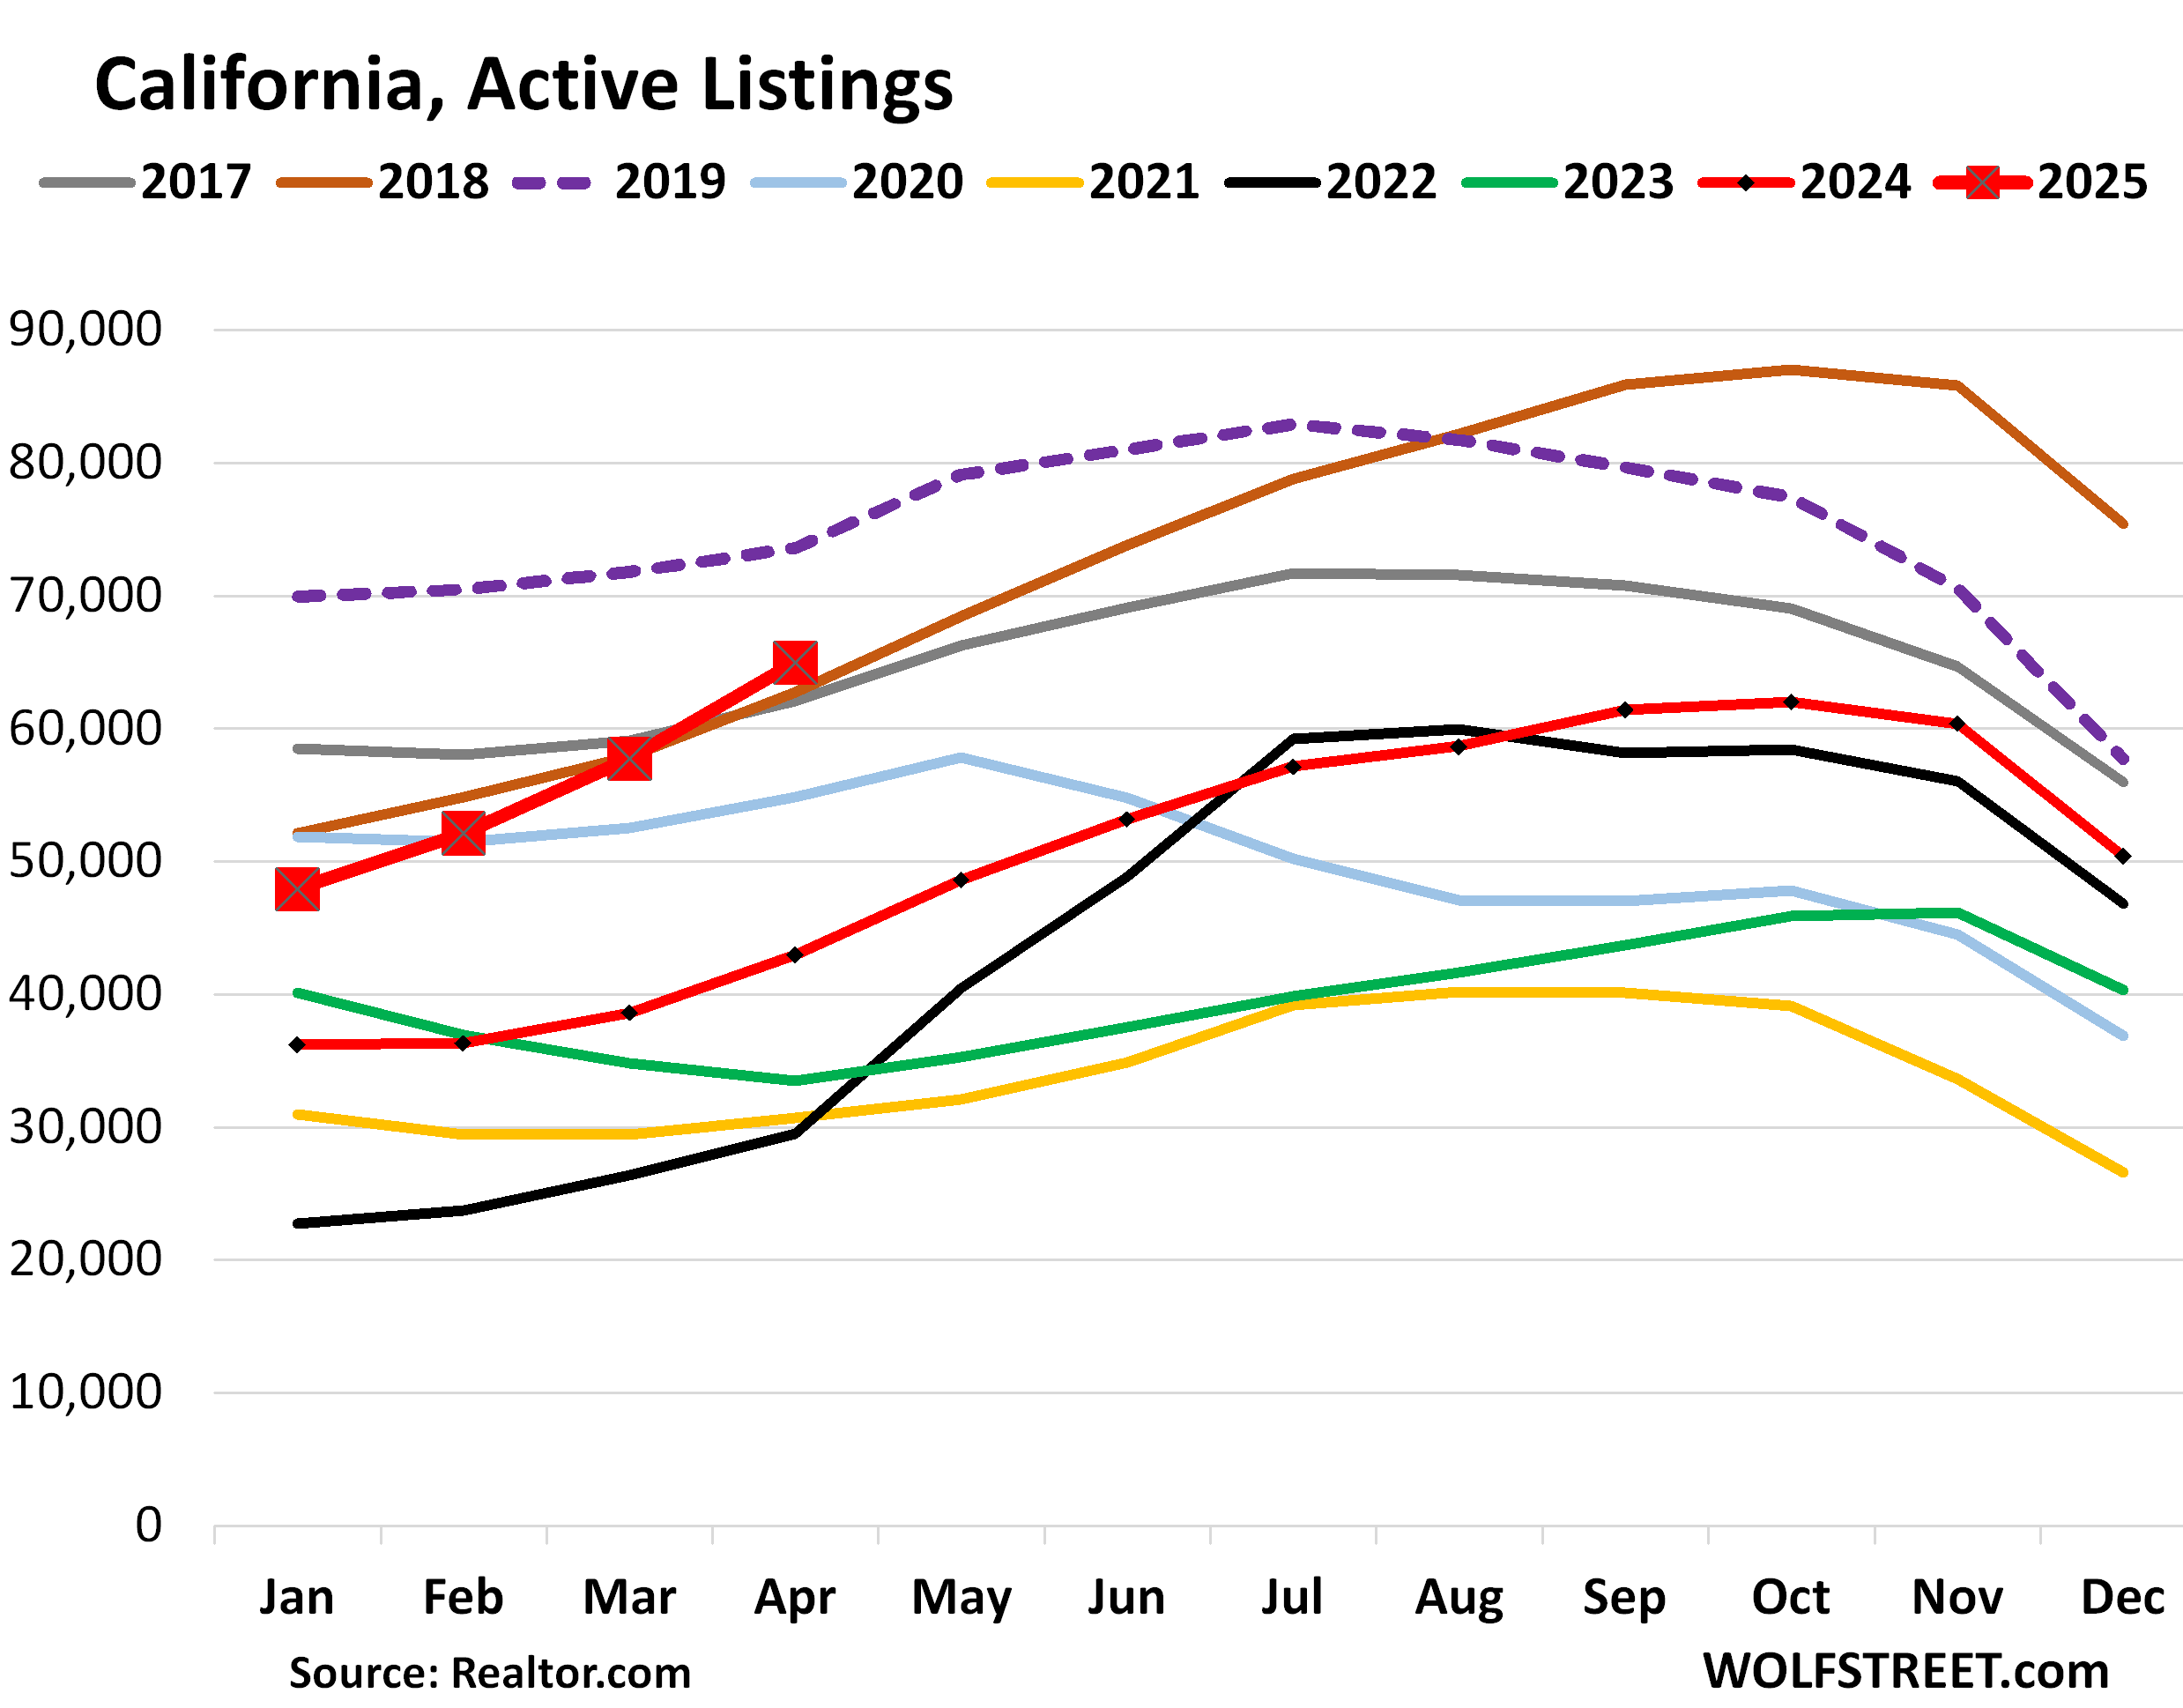
State of California: Active listings spiked by 51% year-over-year, to 64,963 homes, the highest for any April in the data going back to 2016, except 2019 (dotted purple line).
Compared to 2019, active listings in 2025 went from being 32% below in January, to being just 12% below in April.
Not every market moves in lockstep, some are the first movers, others lag behind, but the inventory pile-up is now starting to play out all major markets in the state.
Obviously, a flood of inventory on the market is a good thing for this broken and frozen market of existing homes – it’s broken and frozen nationwide, with a generational multi-year plunge in sales volume – and maybe it can jar the market loose finally.
Enjoy reading WOLF STREET and want to support it? You can donate. I appreciate it immensely. Click on the mug to find out how:

![]()
Looking at that data, it appears that is the highest slope in the last 8 years. Why the rush to the exit?
Investors are watching the market and figure that the top is in and it’s time to get out.
Also, with travel being down and Canadians deciding the US is no longer a nice place to winter, the profitability of short term rentals is in decline. So, lots of folks taking their profits and heading to the exits.
Good point. Let me suggest another driver: the immigration spigot is off. There has been a lot of immigration out of CA for years, but it has been counterbalanced by a high volume of illegal immigrants. The outflow now results in significant lost population. Less population means less demand for housing. Rents will start to decrease, and landlords will want to sell. Things are going to get very interesting.
At least in my family those leaving California are retired police, prison guards, fire, teachers, nurses, and government workers. (These are the jobs of the future in the US as well unless you have a rich hedge fund daddy and an Ivy League degree). They have great government retirements and have been cashing out their houses. I find it hard to understand how illegal migrants are going to be able to finance living in those houses which seem to be all way over a million dollars in places like Fullerton, San Dimas, Chino Hills (at least for my family members. We do not have any family in BH, Santa Monica or Palos Verdes.
Canadians are not a factor in California.
Economic policy uncertainty has spiked more than 2x the previous record at the start of the pandemic. Inventory pileup is a decline in buyers, not an increase in sellers. Same story across the economy as those with capital sit on it due to uncertainty.
Three questions:
1) how much of a price decrease is needed to compensate for the extraordinary uncertainty increase?
2) what does the govt need to do to restore economic confidence?
3) if economic confidence restored, how quickly do buyers return to buying?
I think the reason is very simple: Buyers are not on strike but they are priced out. I know a lot of my friends wanting to buy even with this economic un certainty but they can as they are priced out due to high prices and escalating cost of owning a home other than mortgage.
It’s the same thing. The Fed took the free money away.
It’s both. Pricing out has been reducing demand for several years, though it looks like real house prices might have peaked in summer 2024. Now nominal prices are increasing slower than inflation, meaning real affordability is improving. But we’re coming off historic lows so people won’t feel like housing is more affordable for a while, especially in high demand markets.
The new thing now is that economic uncertainty has chilled a different set of buyers who had still been buying. The new ICE Mortgage Monitor suggests a big drop in repeat buyers, many of whom would be classified as investors or flippers. Those people might be sensitive to business environment uncertainty rather than affordability.
jon, it’s flip sides of the same coin. some people are priced out, and some could still technically afford the houses at the current ridiculous prices, but have decided they simply won’t pay. the uncertainty is more likely to hit the upper income crowd, in other words, the people who could still afford it, who is riding high on their stonk portfolio, especially if they think their job and that portfolio’s value is in jeopardy.
@Wolf,
Buyers on strike: personal choice
Priced out: dystopian nightmare
Definitely not the same thing, especially since the prices are now entrenched. Rents are stickier than prices, and prices are usually a multiple of rent. A certain floor has been set that won’t be fixed without a moderate to severe recession. A mere modest recession won’t make a permanent dent in prices/rents, and this is a problem that needs more than a transitory fix.
You’re looking at it from a personal point of view, a psychological point of view. But this is an economics and finance site, not a personal grievance site, and for the economy, the personal motivation doesn’t matter, what matters is the effect. The Fed took the free money away in part to stop the house price explosion (that’s one of the effects it wanted to achieve, and Powell said so). Like union workers, some buyers go on strike eagerly, others are essentially forced to go on strike. But it’s still a strike with buyers refusing to buy — that’s the effect. That’s what matters.
4hens, one thing the government could do is remove the real estate tax limit as a deduction on Federal tax returns. I believe the cap is $10,000 per year. That tax overhaul is now before Congress this Spring.
great
I live in SOCAL and people have been waiting for rates to drop. The whole date the rate scheme. People are now realizing Jpowell wasn’t joking when he said higher for longer.
The top is in. What could possibly happen in the next few months that would push this insane market higher?
Interesting timing, Nick from Reventure just posted a video about this. Sadly looks like OC is still the exception or hold out in comparison to LA or Riverside inventory spike. Plenty of delusional asking price to go around.
Make sense inventory is going up, as I said before, all of a sudden I am getting on average 5-10 emails from Redfin daily now on houses for sale on arras that I searched for from like ccouple of years ago…if these sellers keep asking for price like below for shoebox, it will be a giant inventory pile up very soon. Wonder if this time around, they will tried the same tactic as last year or two and pull houses off the market and wait for better day. Also interesting is that we are supposedly in prime Spring selling season…wonder what this Fall/Winter will look like
$560,000 $579,500
1 Beds · 1 Baths · 546 Sq. Ft.
Long Beach, CA 90804
I hear you but rest assured if LA, Rside or SD has inventory spiking, then OC would have the same. OC is not a magical place shielded from all these.
Just an anecdote: Got a flyer from realtor, saying in my neighborhood in SD, he sold a home for $500K more than asking price. Just can’t believe this madness.
Thanks WR for this report.
Phoenix_Ikki
“Sadly looks like OC is still the exception…”
No, OC is not the exception. It got started a little late, but is now making up for it: in April, active listings spiked by 75% yoy🤣
There are no exceptions.
Let me do a Mr Burns impression to no exception in OC…”Excellence…..” :)
Nick called the top a year early in June ‘21. And has been calling an imminent crash nationwide ever since. He’s an idiot and frustrated renter who doesn’t ‘consult’ for anybody. He has just managed to build a YouTube following by cherry picking data, saying it’s the eve of 2008 every week for 4 years now, and even gets quoted by the media as an expert. Stick with Wolf.
Nick Gerli is a permabear. Most of his video thumbnails have downward charts or flames. Ignore the clown & those who call him more than once on his show.
Gerli has a data based approach. I think he’s one of the best at spotting problems early.
Wolf should make a list of permabears always calling for the top/a collapse and run it in conjunction with the imploded stocks one.
FWIW: we have seen many metrics suggesting that it’s “the summer of 2007”
They’ve just been persistent for up to a few years now!
High yield spreads, CAPE ratios, housing market “stress” (manifesting in low volume), spiking asset prices, creating bubbles everywhere AND even major crashes in some asset prices (from CRE to commodities/ oil)….
The remarkable resilience of the everything bubble is Greenspan’s market irrationality. Certainly not like this is all according to the plan!?!
Why did you leave out Orange County CA?
Why did I leave out the other 60 counties?
Some because I don’t have all my data sets yet together — the five you see are the five I’ve put together so far; and others because they will never be included because I cannot put up 65 charts. So don’t even ask me.
But like I said, to make you fell better, OC active listings spiked by 75% yoy.
Hi Wolf,
Thank you for all the free, high-quality information you provide.
Do you happen to have data for another large CA county – Sacramento County?
Or if not could you point me to where I could find the data via Realtor.com?
I’m going to include the Sacramento metro in my next report on this. It just takes me a while to get my ducks all in one row when I start a new series. So I start small and expand from there.
Oh no, not San Diego…I am sure someone will chime in and tell us not in that specific area of SD and price still going up and people sell overbidding…
I live in San Diego. Nothing is selling.
It comes on the market and sits, goes pending so agents can send out notifications to smart phones thinking we are all tooooo stooopid to know their game. Then it goes off market when people didn’t line up to buy their home for a price that is 100% higher than 2019.
And not just 100% higher asking price – mortgage rate from 4.15% to 6.5% (increases the monthly payment by 30%) and 100% more taxes.
So the 750K house in 2019 had a monthly P&I of 3650 (ignoring downpayment) and 780 in taxes; same place at 2x asking is a 1.50mm house with a monthly P&I of 9500 and 1560 in taxes (and that presumes that the 2019 purchase wasn’t refinanced in 2021/2.
Monthly 2019 – 4430
Monthly 2025 – 11060
Double in price, nearly triple in monthly carrying cost.
You are missing the difficulty of getting home insurance in San Diego
My friend bought a new home 2 years back ..a modest size home .
First year property insurance premium was 2k
Second year was 4k
Now renewal at 22k
He tried shopping around but got declined at all places.
wait, so zillow showing pending doesn’t mean it’s actually pending?
I wonder about that too, have seen houses changed to pending, disappeared then pop up couple of weeks later, same goes for contingent. Perhaps it’s doing as intended, actual legit deal falls through and back on the market. Just curious if there’s any wiggle room for RE agents or Redfin/Zillow to possibly game the system and try to drum up some FOMO
Same question here. Several houses in our development went into Pending almost immediately after being listed, and have been staying in this status for almost 2 months. I had the same hypothesis (that listing agents manipulate the data and as artificially create a fomo effect), but my buddy told me that it was a huge NO in the real estate playbook, and if found manipulating Pending status, an agent may face harsh penalties – no idea if that is true or not…
Lots of deals fall through because of financing (payment too high, mortgage applications turned down), insurance premiums too high if they can even get insurance, failed inspections (now that they’re doing them again), etc.
Do you believe agents when they tell you “highest and best because we have another buyer?”
I wouldn’t put anything past realtors, but…
When I sold my first house back in 2021, it went legit pending immediately on an as-is offer, then the buyers tried to game me, so I gave ‘em the finger and put it back on the market.
They should have been fined for wasting my time, but I actually ended up closing sooner.
yep, people don’t always realize that there’s no threshold with an inspection after which the buyer can back out. they can always claim they didn’t like something the inspection showed and get out, so as long as there is an inspection contingency, it allows buyers with cold feet, which happens a lot in this current environment, to back out.
And don’t forget to mention that the failed listing data gets scrubbed off most major websites, as if it had never been listed and subsequently removed.
Wondering if that is an extra paid service from MLS.
It was just a matter of time before the housing inventory floodgates opened in CA.
You can already see the spike in #s and price cuts in the surrounding areas like LV and Phoenix where clownifornians love to “invest” in get rich quick schemes.
I just moved to San Pedro and home prices for shacks are insane here. Waiting patiently for the bottom to fall out.
A lot of listings on Zillow and Redfin in certain cities in SoCal are now showing up with price drop label, although the cut is still pretty pathetic.
It’s funny though once in a while, even now to see something sold with price increase and the previous wasn’t cheap .it will be something like listed for $1.15M but sold for $1.2m. I do wonder what’s going on with those and if there’s any funny business going on..
Home owners are mostly morons when it comes to selling in this environment. They expect pandemic high prices (40% plus over 2019 orices) at 6% plus mortgages. The best they can do is a 10k cut for a 1.5 mil house. Lol. Even the genius tech workers dont understand the concept of affordability.
see the problem is that there are still a few selling at peak pricing, in some areas. turnkey houses, at least in florida and socal where i’ve followed, are still selling sometimes for double 2016 prices. but it’s random. for every 1 that sells at peak aspirational pricing, there are 15 that sit on the market, which is why volume has collapsed. the problem is that that 1 gives hope to the other 14 that some stupid buyer will come along and overpay for their house, so they hold it.
it’s not until desperation sets in that you start seeing real drops. i’m talking the $50k every two weeks, not the $10k drop on a $1.5 million house after 6 months.
You gotta “tip” if you don’t want to insult the owner/seller.
@wolf
“It’s not that new listings are that high; they’re not. It’s that the homes that have been listed for sale aren’t selling, and the new listings pile on top of it, and overall inventory is suddenly ballooning at an astonishing rate”
Is the average number of days on the market increasing? I’m curious if you happen to have that data too.
Very good article, thank you!
Yes it is, 43 days in April up from 37 days a year, and from 27 days in April 2022. But it’s a false measure of activity because it’s determined by two factors, one of which has nothing to do with sales:
1. how quickly sellers pull their homes off the market when it doesn’t sell;
2. how quickly homes that did sell, sold.
When sellers are aggressive in pulling their unsold homes off the market, the median days on the market declines. When sellers leave homes on the market for longer when they don’t sell, the median days on the market rises. It’s more of a psychological measure of seller confidence-frustration.
I wonder how 2019 compares to a “normal” market. Was 2019 just a standard pre-covid year in terms of listings?
As I explained in the article a COUPLE OF TIMES, active listings in the second half of 2018 and going into 2019 ballooned because of the Fed’s rate-hike cycle pushed mortgage rates to 5% for the first time in 10 years, and sales stalled and inventories ballooned. You can also see that in the charts how listings came up from 2017.
Not many will agree but for SoCal one can argue that it’s been in a bubble since probably after 2014 and beyond with 2012 being the somewhat return to norm after GFC…then Covid brought it to next level of insanity and all of a sudden majority think pre Covid is some kind of bargain fair value, smaller bubble for sure but not fundamentally cheap or affordable by conventional measure like income to home price ratio..etc.
We need a new business model for designing, building, financing, marketing, selling, and insuring homes. The current system is a broken, chaotic mess.
We also need a paradigm shift in our value system, which suggests that a fancy, big house with a fancy view is the epitome of success.
Larger than that as getting back to city design. The explosion of combined oil and auto industries and their lobbies pushed for suburbs. That was combined with a massive reduction in infrastructure and transportation spending. No better way to sell lots of cars and oil by ensuring everyone needs it all the time.
There’s a very interesting book called “A Nation of Realtors” that runs down the history of the RE business. It was really the realtors that drove the flight to the suburbs and they were instrumental in developing land use zoning because it increased property values. They viewed themselves as city planners/designers and they basically invented their industry out of thin air. Fascinating reading.
Nothing quite like profit motive being the sole goal to create significant problems. A lot of this was neoliberalism as well(reduced government spending, deregulation, privatization) and of course the synonym globalization which destroyed manufacturing sectors. None of happened by accident.
A big house is not just a status symbol. A home is the terrain one navigates in one’s private life, and the larger your home, the more room you have to stretch out your arms and relax.
I think of a large house as having more things to maintain which diminishes my enjoyment of home.
Juan,agree,that said,a small homes with many acres a blessing(in my book).As the Ambassador,mentioned,a place to stretch your arms though I see that with lots of land.
I think the same.
I need want and love small homes.
I wakr my life not to revolve around my home.
Home is a place for me to provide shelter and nothing more.
Interesting point.
I often think a lot of not-rich people need to stop associating their worth with ridiculous and overpriced vehicles, and they could be a lot richer.
Is someone with a never-used-for hauling duely allowed to be angry-envious over someone else’s house?
Wolf,
What do you think will break the the damn in regions such as the Mid Atlantic (western PA) and Ohio in terms of inventory? I know Pittsburgh doesn’t qualify for your price index tracking but am curious if you track any data from there.
I will eventually build a similar set for the key East-Coast markets and Midwest markets. But this stuff is tedious to set up and takes forever. So patience please.
I’d be more concerned about the number of houses for sale in California than in Florida.
One has a movement of people out and the other has an increase in population.
One is a high cost, high tax area and the other isn’t.
More people, lower costs, and less crazy government involvement will take care of the overhang in inventory over time.
The other…..
florida may not have an income tax, and the sales tax may be on the lower side, but it’s not a low cost, low tax area by any means.
And the government is just as crazy, if in different ways.
Been to the “free state of Florida” lately? Not much free there. High prop taxes, toll roads, 9% sales tax at restaurants (and many with 20% service fee built in), permits required to do anything, and tons of troopers camped out on the highways waiting to nab you for speeding.
I love Florida, but let’s not pretend it’s some low cost of living, minimalist government state. Hardly.
Nothing like coming to a near dead stop on the highways every few miles to toss in a few quarters or whatever.
Culturally, FL makes me want to puke.
Culturally there’s a reason so many rag on the whole Florida man thing ..only in Florida..
Although nowadays Ohio is replacing that the Florida moniker for Gen Alpha…as brainrot goes…”That’s so Ohio!”
Well, of you think that the cost of living in Florida is the same as in California, then…..it goes beyond saying
Except that’s not the case…Florida is slowing just as much, if not more
Sacramento is an interesting market – local non government income levels are much lower than the Bay Area, but when work from home took off during COVID there was a wave of work from home (tech) buyers from the Bay that gobbled up everything, and pushed everything out of reach for the regular economy (non tech sector) denizens of that region. I’d be curious if this area falls into the same patterns as seen in other cities, or if it is more likely to see greater swings in overvaluation to final price of purchase. (So in econ speak its local market elasticity of demand issue compared to the broader state based market.) If return to work continues I would imagine that this might drive a more urgent need to sell than what you might see in other California housing markets. Maybe wishful thinking but it seems a reasonable or at least interesting speculation.
“I’d be curious if this area falls into the same patterns as seen in other cities…”
Yes, there are no exceptions. Active listings in the Sacramento-Roseville-Folsom metro spiked by 50% yoy and are now just a hair below the 2019 when listings were high because sales had stalled because mortgage rates had hit 5% in late 2018.
Thanks. Be interesting to see if the return to work push by Google, Meta, Apple, etc… (and the local downsizing of Intel in Sacramento)- will incentivize the covid tech diaspora work from home crowd to get closer to the office (back to the bay area) and will result in what could be an early indicator of the softening of typical seller downside sticky pricing. Since, as you point out, the active listings are on par with other cities, then it is likely that this is not a factor (if it were I would expect the active listings to be higher than SF / San Jose, East Bay areas). Either that or the amtrack Capitol Corridor route (which just increased its cost for the first time since 2018) will buffer RTW effect. Always looking for the outlier / leading indicator, lol.
I work for one of these big techs.
These companies have huge offices in cheaper countries with 10s of thousands of people working there.
Their taken is this: if they can / want to wfh aka remote then let’s move the position to cheaper country instead of paying them us salaries and benefits.
My company has mandatory 4 days a week back to office and after few months it is 5 days a week mandatory office attendance.
Amazon not only monitors badge in but also badge out to find out people who are just badging in to game the return to office mandate.
All the talk is about rates, but that is just part of the problem. If rates were to drop all the other costs will still be going up.
Remove the lie about a home always being a good investment and sales may never return to what they say is normal.
It would be nice if the Justice Department put a whole lot of Realtors in jail for their part in this mess. Let it get bad enough and our goverment will do something stupid. I would support a legal limit on sale commissions. One or two percent would be nice!
What does a supply demand curve look like if no transaction is taking place?
What if the seller cannot deliver clear title at the current price because the value of the home has gone down, so the house does not sell? what does that demand/supply curve look like.
What if costs a builder more to build a home and the home is worth…what does that demand/supply curve look like.
I don’t live in Southern California, but where I live, house values eventually did fall circa 2010, but they remained on the market for a couple of days before the bargains were scooped up very very quickly, and then quickly became overpriced again based on what the homes would rent for.
I was going to buy a condo from a builder for 415k when I found one exactly identical but older by five years for 313k. The 313k was willing to negotiate. That is in SLC. Someone is in trouble.
Here in San Mateo, the for sale signs are popping up like it’s 2009. This week a local RE agent from sent out a glossy pamphlet listing all of her recent ‘bidding wars’. Those two observations point to the same thing – no sales and spiking inventory.
Oh but it’s just a gully and they are just motivated sellers probably to that one RE agent, just like a scene straight out of The Big Short…
But I am sure this time is different…buy now or be forever priced out 😄
If California equity refugees can’t sell their 2 million dollar condo’s they can’t move to Oregon with all of their profits.
GREAT!
They can probably sell their condo for less and still move to Oregon 😬
New ATH for Bend in April. 800 a whatever is the new median. I don’t even care anymore.
Doesn’t the general uncertainty and fear of what the Trump government is doing put a damper on people’s optimism to make RE purchases?
An answere from IA to my question about the End Hedge Fund Control of American Homes Act:
As of May 2025, federal legislation aimed at curbing large corporate ownership of single-family homes—specifically the End Hedge Fund Control of American Homes Act—has not been enacted into law. Introduced in December 2023 by Senator Jeff Merkley and Representative Adam Smith, the bill proposes to prohibit hedge funds and similar institutional investors from owning single-family homes. It mandates that these entities divest their holdings over a 10-year period, selling at least 10% of their properties annually to individual buyers, with a complete exit by the end of the decade. To enforce compliance, the bill includes a $20,000 federal tax penalty per home owned beyond 100 properties, with revenues directed toward down payment assistance programs for families.
While the bill has garnered support from housing advocates and consumer protection groups, it faces significant opposition from industry stakeholders who argue that such measures could reduce the availability of rental housing and exacerbate affordability issues. As of now, the bill remains under consideration in Congress without a clear timeline.
At the state level, California has taken steps to address similar concerns. Assembly Bill 2584, introduced by Assemblymember Alex Lee, seeks to prevent institutional investors owning more than 1,000 single-family homes from purchasing additional properties for rental purposes. The bill passed the California Assembly in May 2024 and is currently under review in the State Senate.
While legislative efforts to limit large-scale corporate ownership of single-family homes are underway at both federal and state levels, no such laws have been enacted to date. The progression of these bills remains uncertain, and their potential impact on housing affordability and availability continues.
So no light in the dark tunnel, yet.
Umm, if there’s a penalty for over 100 houses… and I have the ability to own several hundred houses?
I also have the ability to create multiple holding corporations.
Legislation for the sake of PR without any regulation or enforcement… reminds me of a conversation I had about social media, MSM, and now politics: just being entertainment.
It’s lip service and pig lipstick at it’s finest!
Because of the fires, OC coastal sales were red hot. Then, the stock market dropped in April, and the pendings slowed by at least 25%. Now, that the stock market recovered, the sales have bounced back some, but are still lower than they were in March.
Many buyers seem to be now looking for rentals. They are unsure what the future holds. This has put insane pressure on single family rentals in Newport Beach. We will see where this story goes.
Meanwhile: California “housing insecurity rate” is 18%.
So I just Googled that. It’s a “feeling.”
This is the definition from the report: “One in 5 (18%) California adults reported that their housing situation felt unstable…”