Turns out, demand from foreigners for Treasury securities at the auctions was just fine.
By Wolf Richter for WOLF STREET.
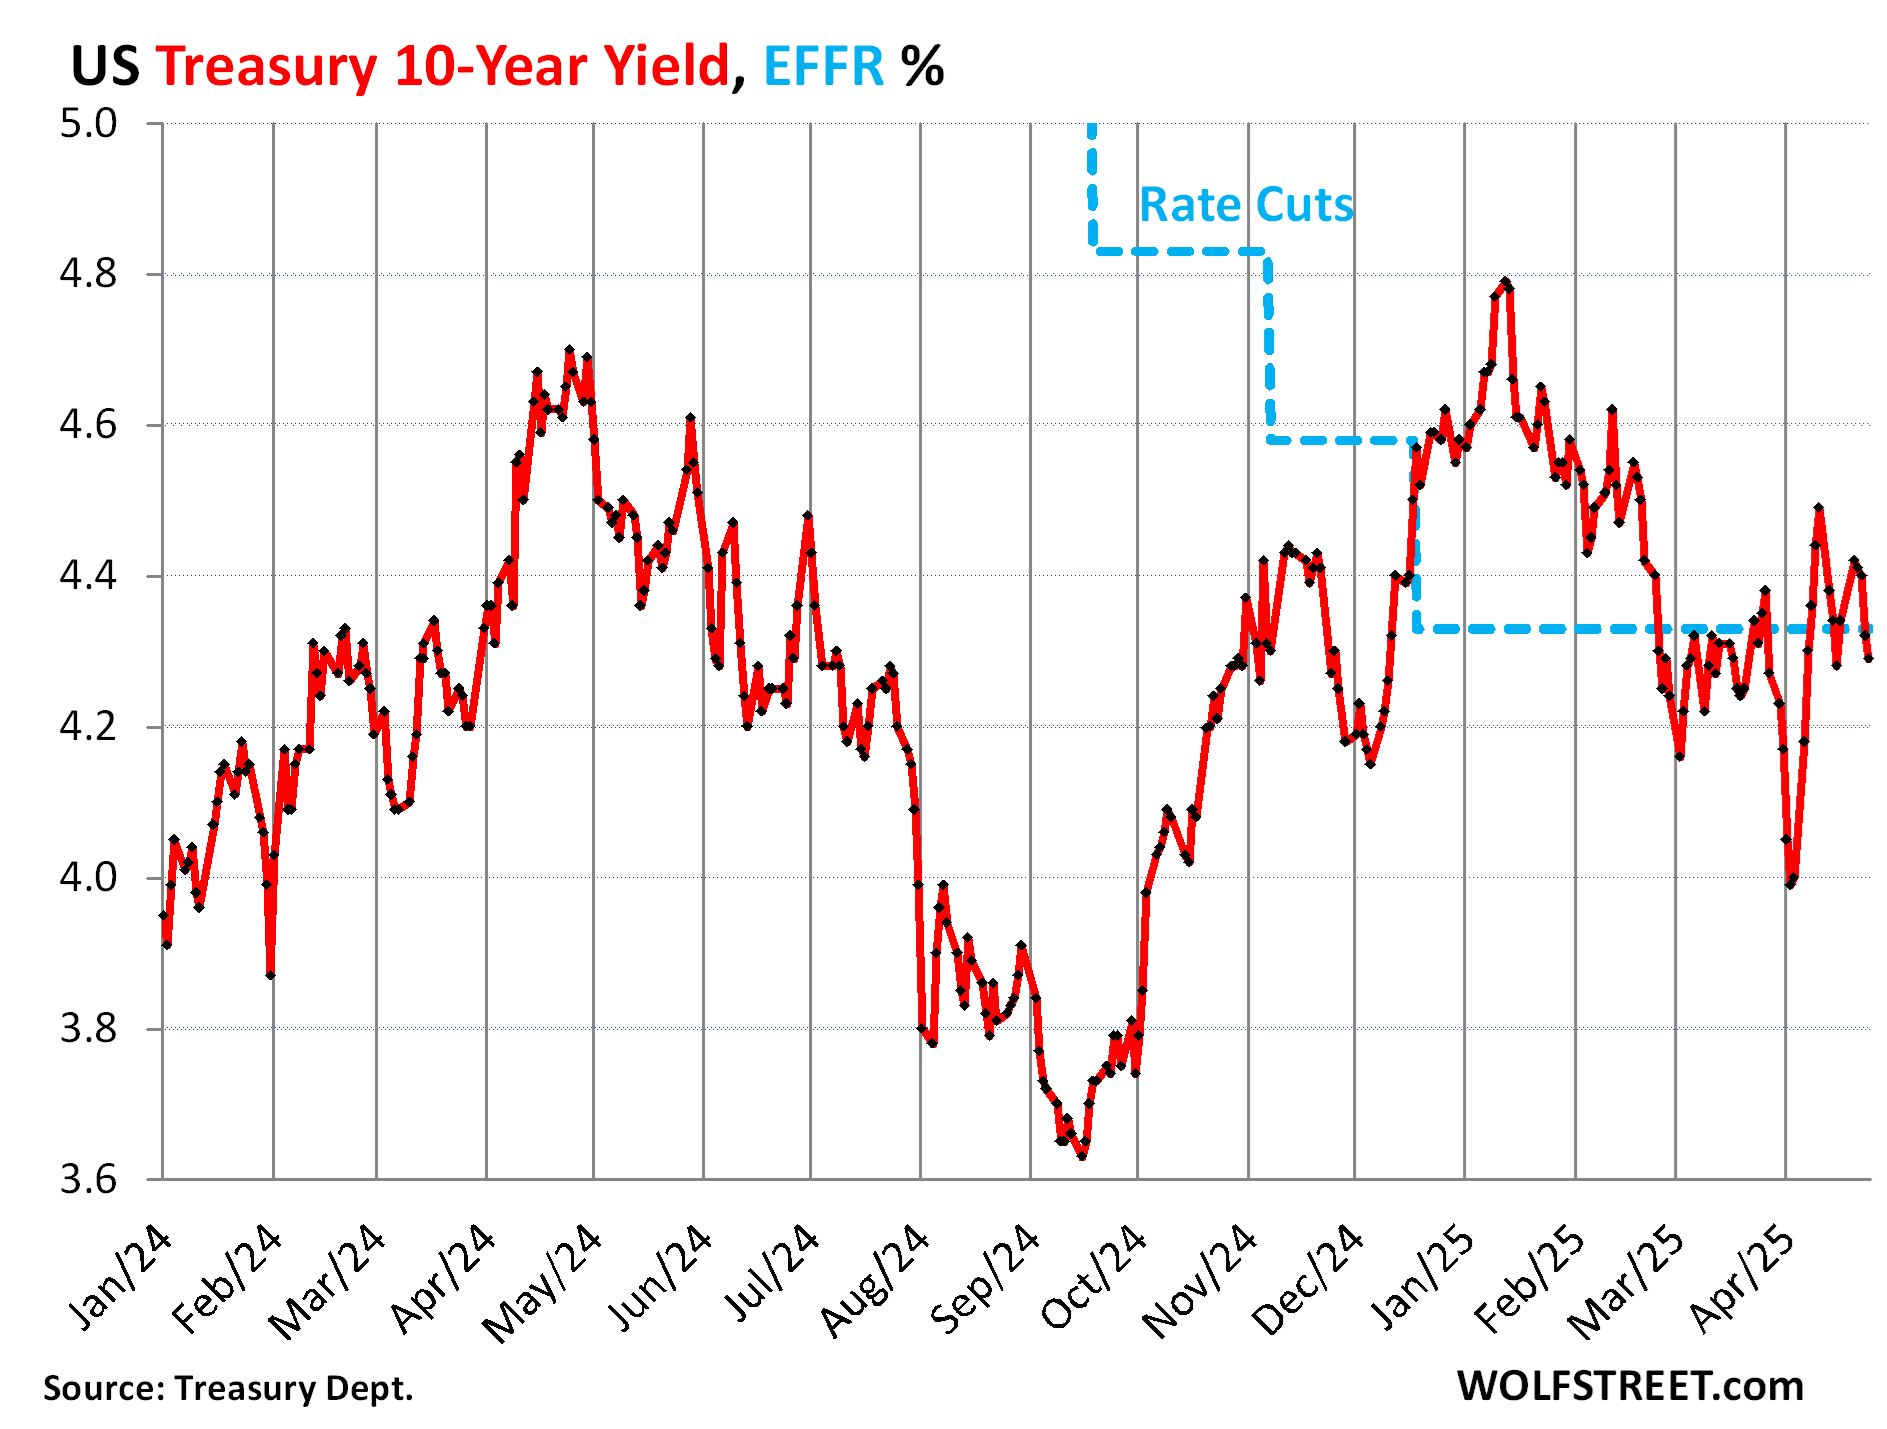
The 10-year Treasury yield dipped to 4.29% on Friday, where it had been in mid-March, despite the gyrations in between, and ended up below the Effective Federal Funds Rate (EFFR), currently at 4.33%, which the Fed targets with its policy rates (blue). Spikes followed by plunges, and vice versa, in an always edgy bond market, are part of the deal with the 10-year yield.
Foreigners kept buying Treasuries just fine.
When the 10-year Treasury yield snapped back 50 basis points in early April – after having plunged by 80 basis points from January through April 3 – rumors started flying that foreigners weren’t buying Treasury securities at the auctions anymore to punish the US for the imposition of tariffs, or whatever.
Those were fake rumors, as we now know from the Auction Allotment Report released by the Treasury Department this week. Foreigners kept buying the US debt just fine.
Foreigners bought 18.4% of the 10-year Treasury notes issued at the auction on April 9, following Liberation Day. That was a much larger portion than they’d bought in March (11.9%), a smaller portion than in February (20.6%), and a much larger portion than in January (10.5%), December (10.4%), and November (13.2%).
The portion of the 30-year Treasury bonds that foreigners bought at the auction on April 10, at 10.6%, was roughly similar to the portions in the prior five months – a little larger than in three, a little smaller than in two.
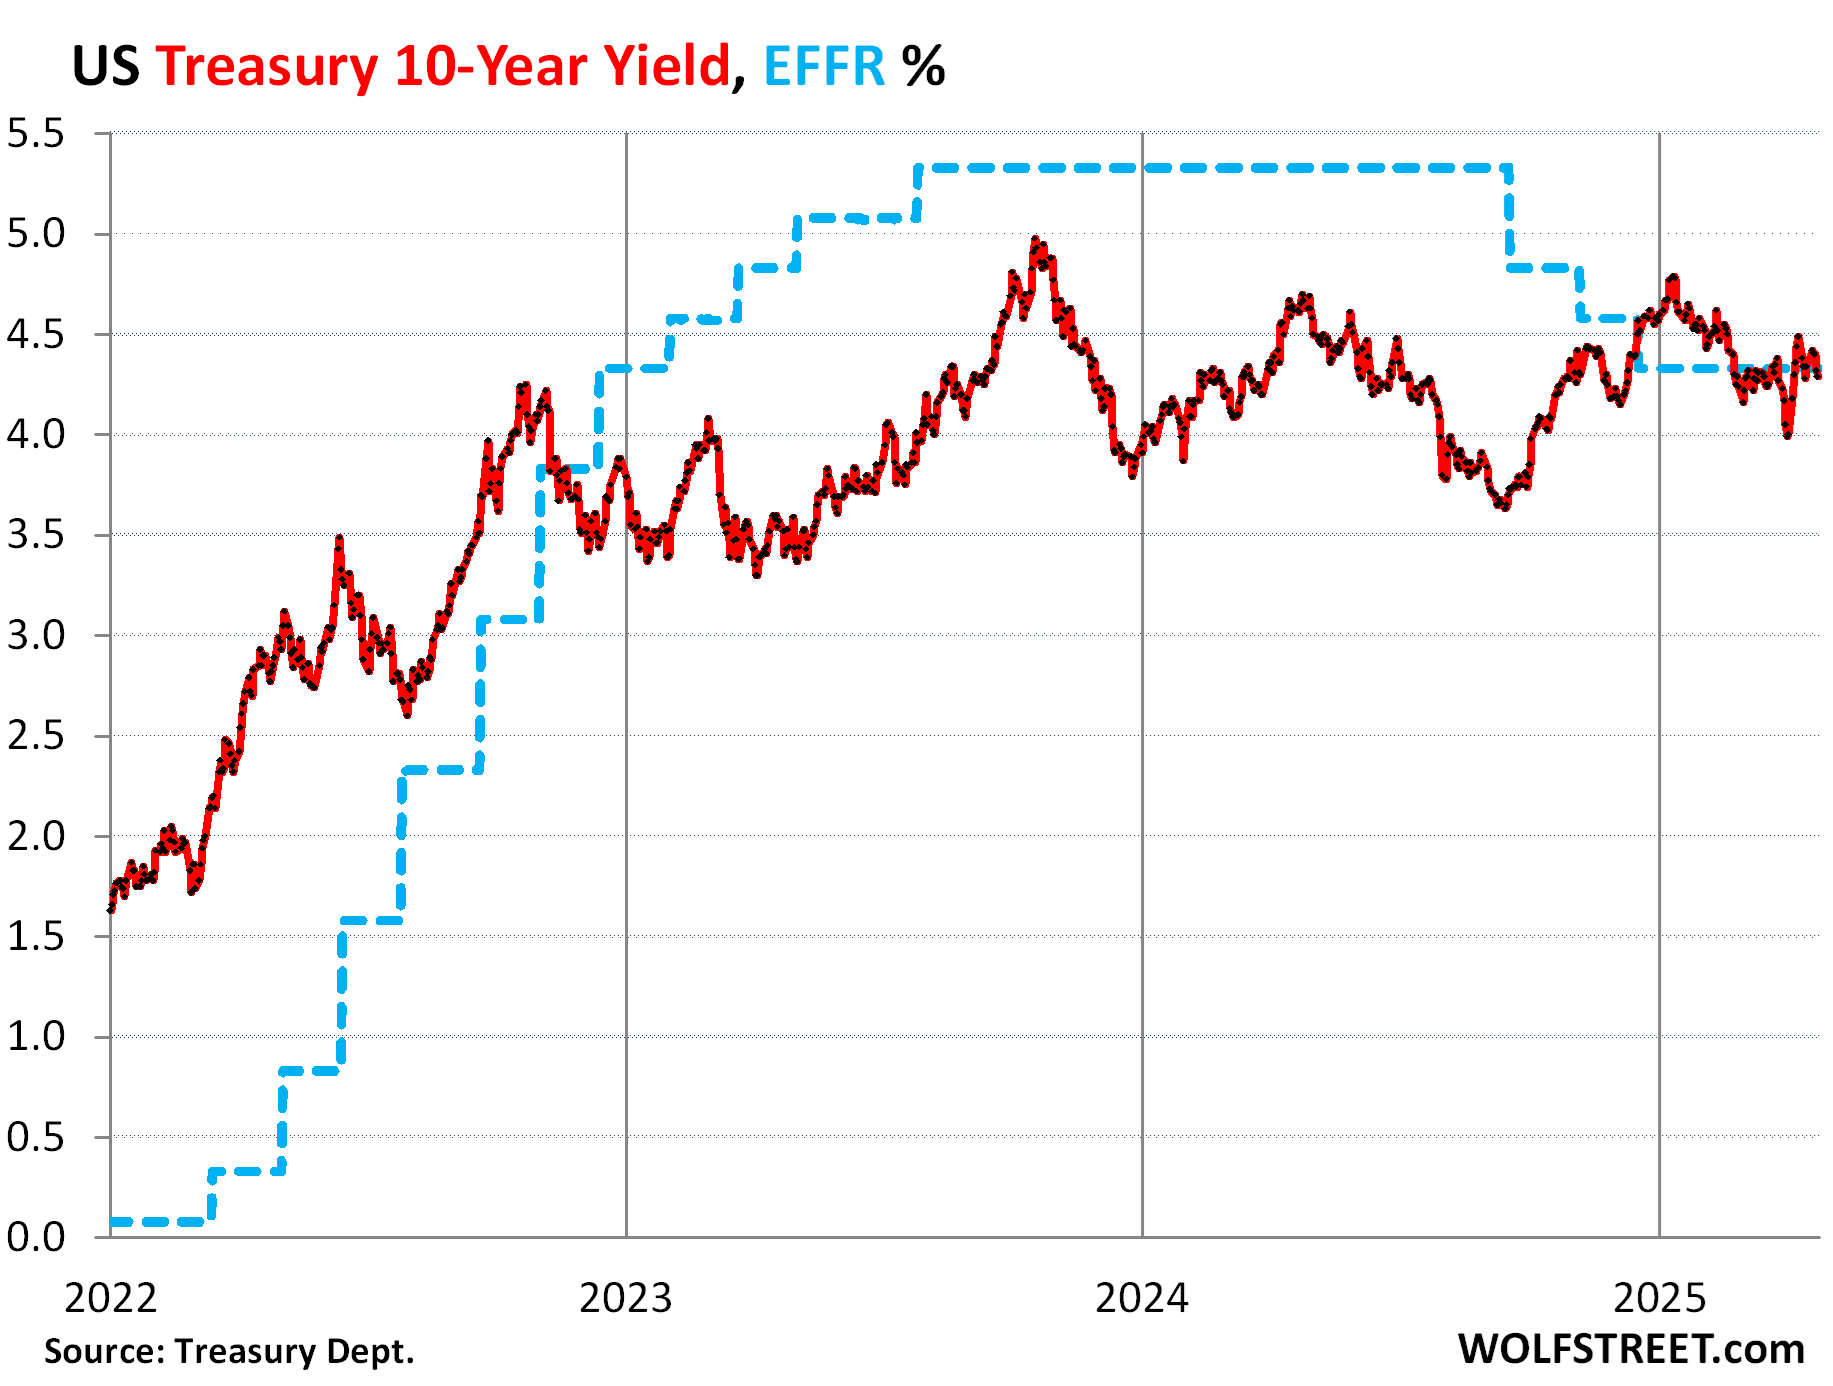
Zooming out, these gyrations barely register. In the grander scheme, the 10-year Treasury yield has been trading fairly closely to either side of the EFFR since late February, and has been in the same range for the past two years.
Given the current rates of inflation, and where they threaten to go, and given the risks with 10-year duration, the 10-year Treasury yield remains relatively low and presumably unattractive – and yet investors, including foreign investors, kept buying them, and this massive demand is why the 10-year yield is so low (and prices so high):
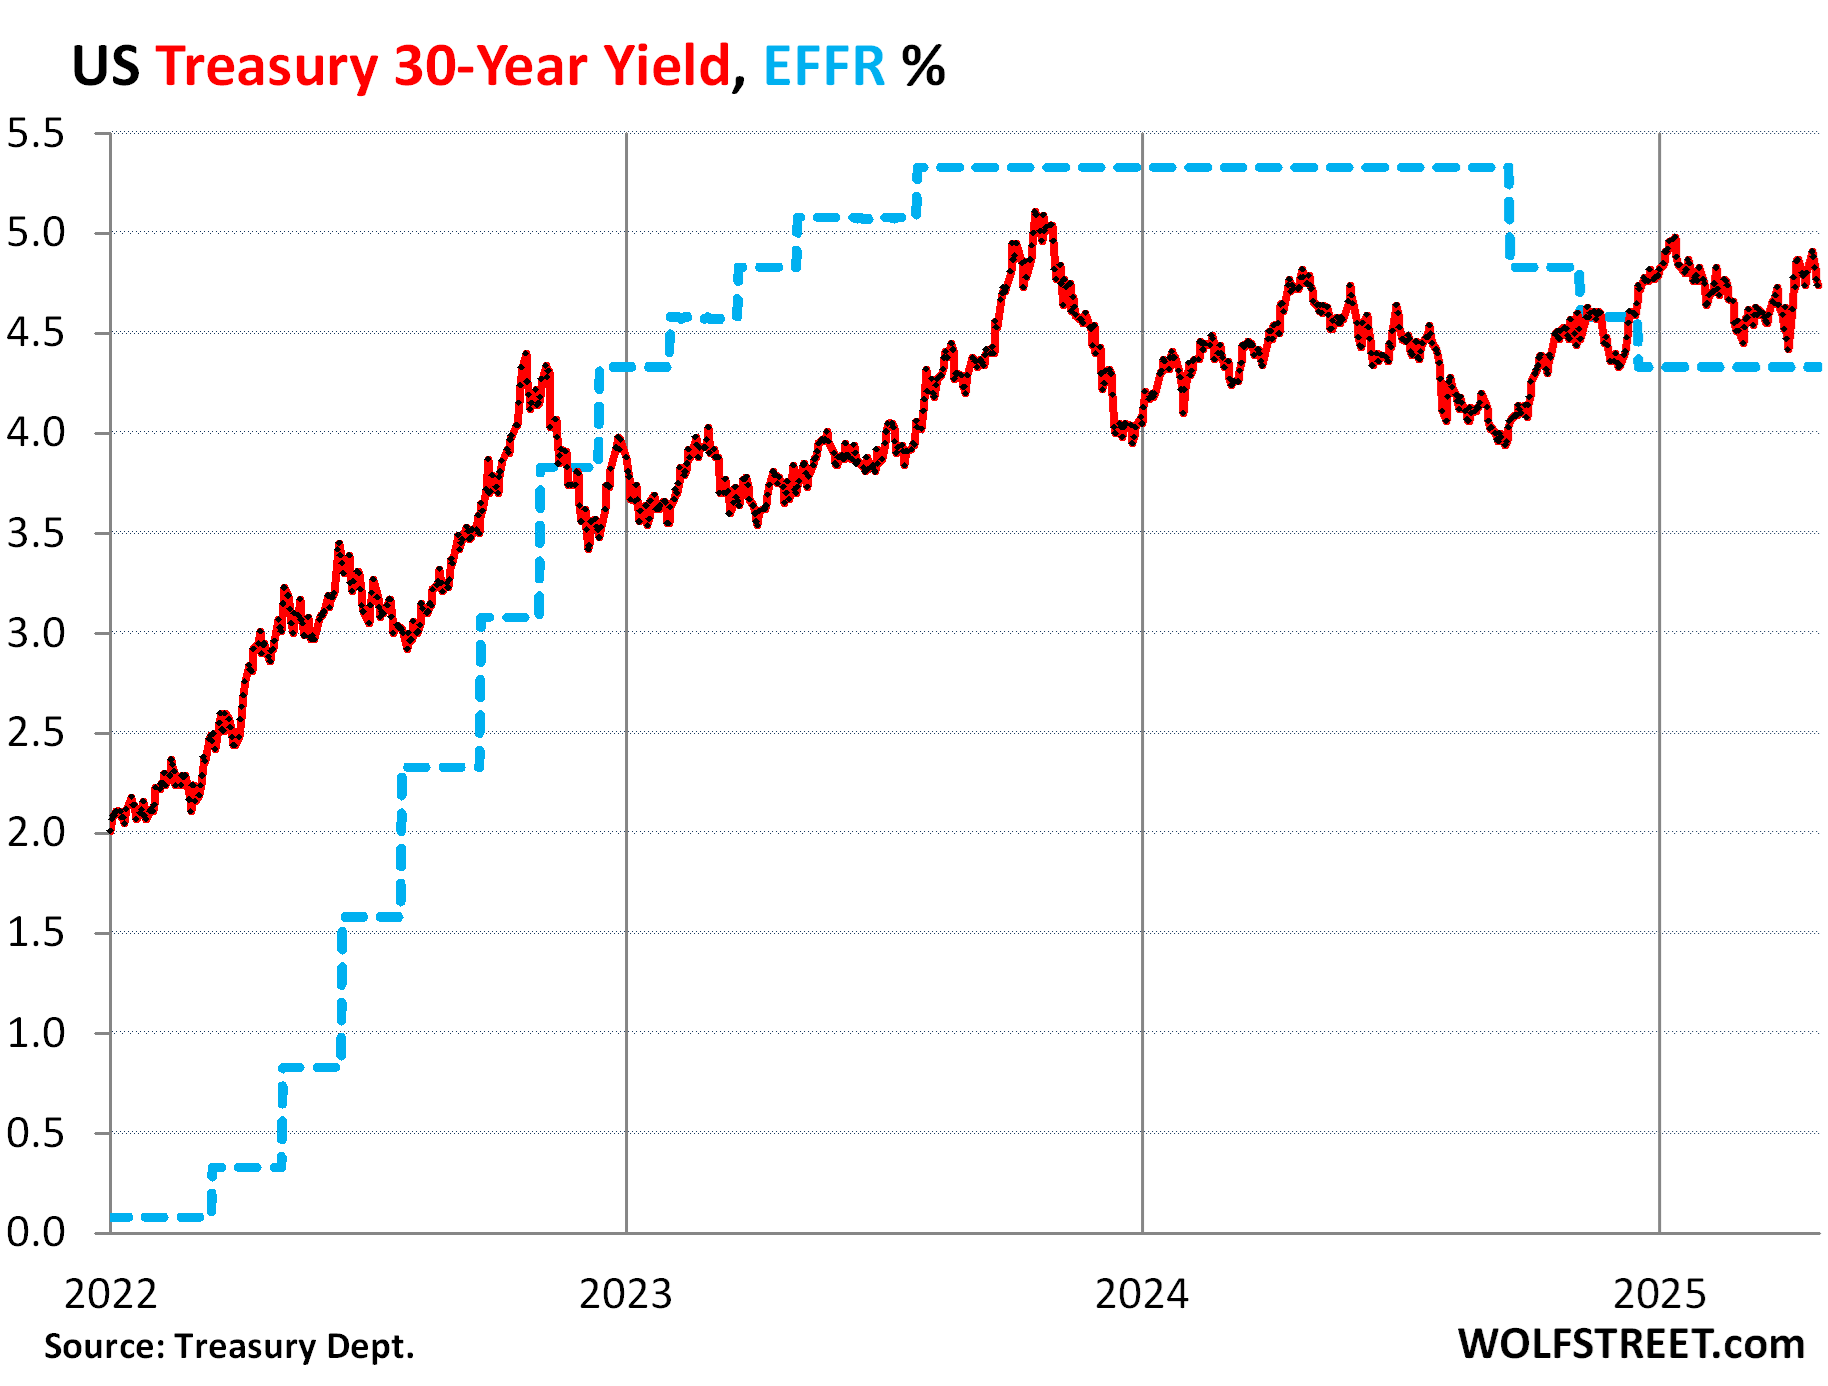
The 30-year Treasury yield has been trading at the upper end of its three-year range and closed on Friday at 4.74%. Back in October 2023, it had gone a hair over 5%, and today it is just 30 basis points below that multi-year high. 30-year duration poses even greater risk than 10-year duration.
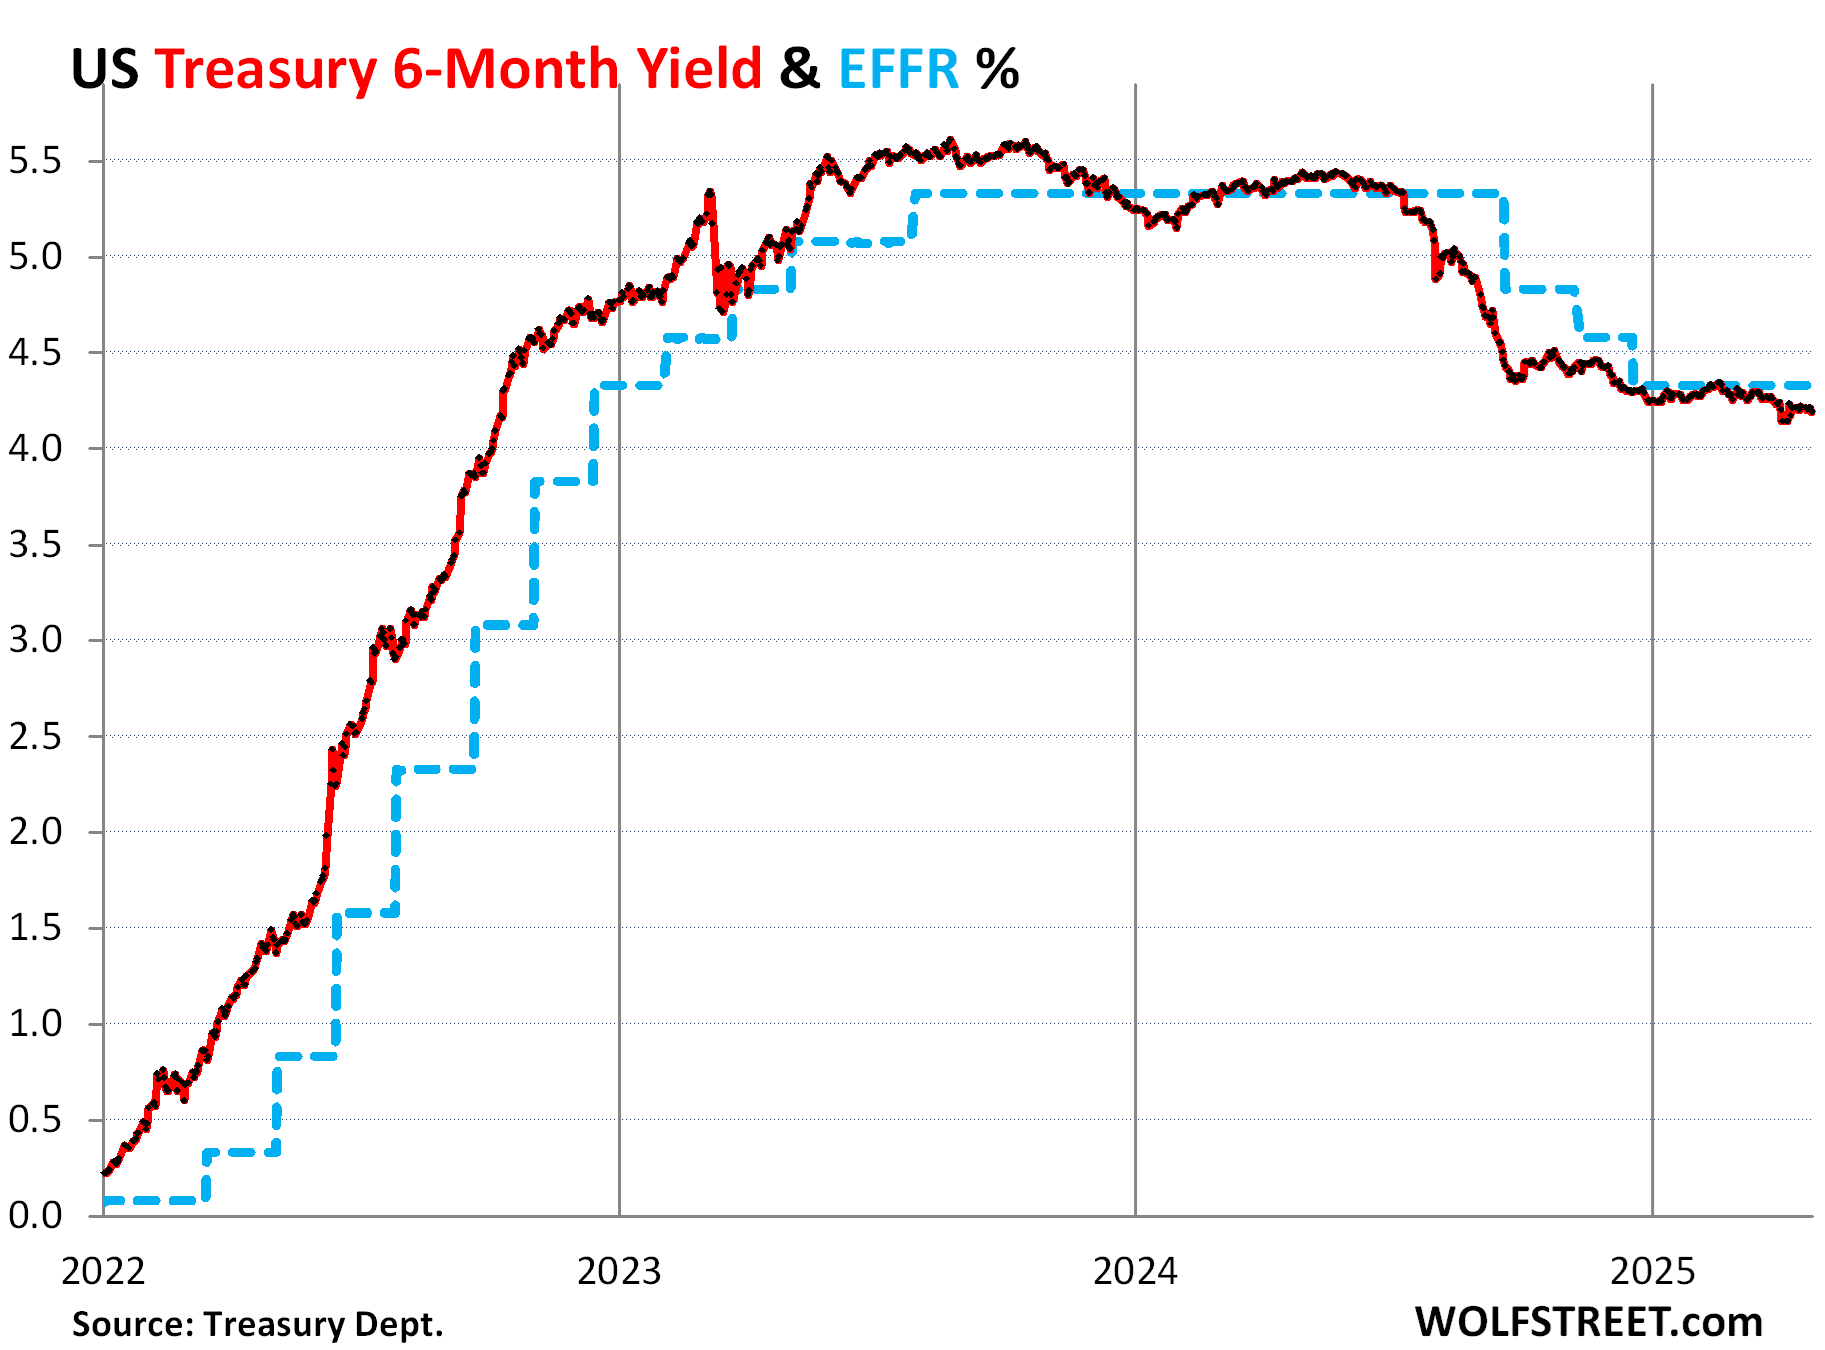
The short end of the Treasury yields is being bracketed by the Fed’s policy rates and expectations of those policy rates within the remaining term of those securities.
The six-month Treasury yield has been glued to the bottom of the EFFR, indicating that this part of the market sees only a small chance of a rate cut this summer, following nicely what Federal Reserve governments have been saying for months: wait and see.
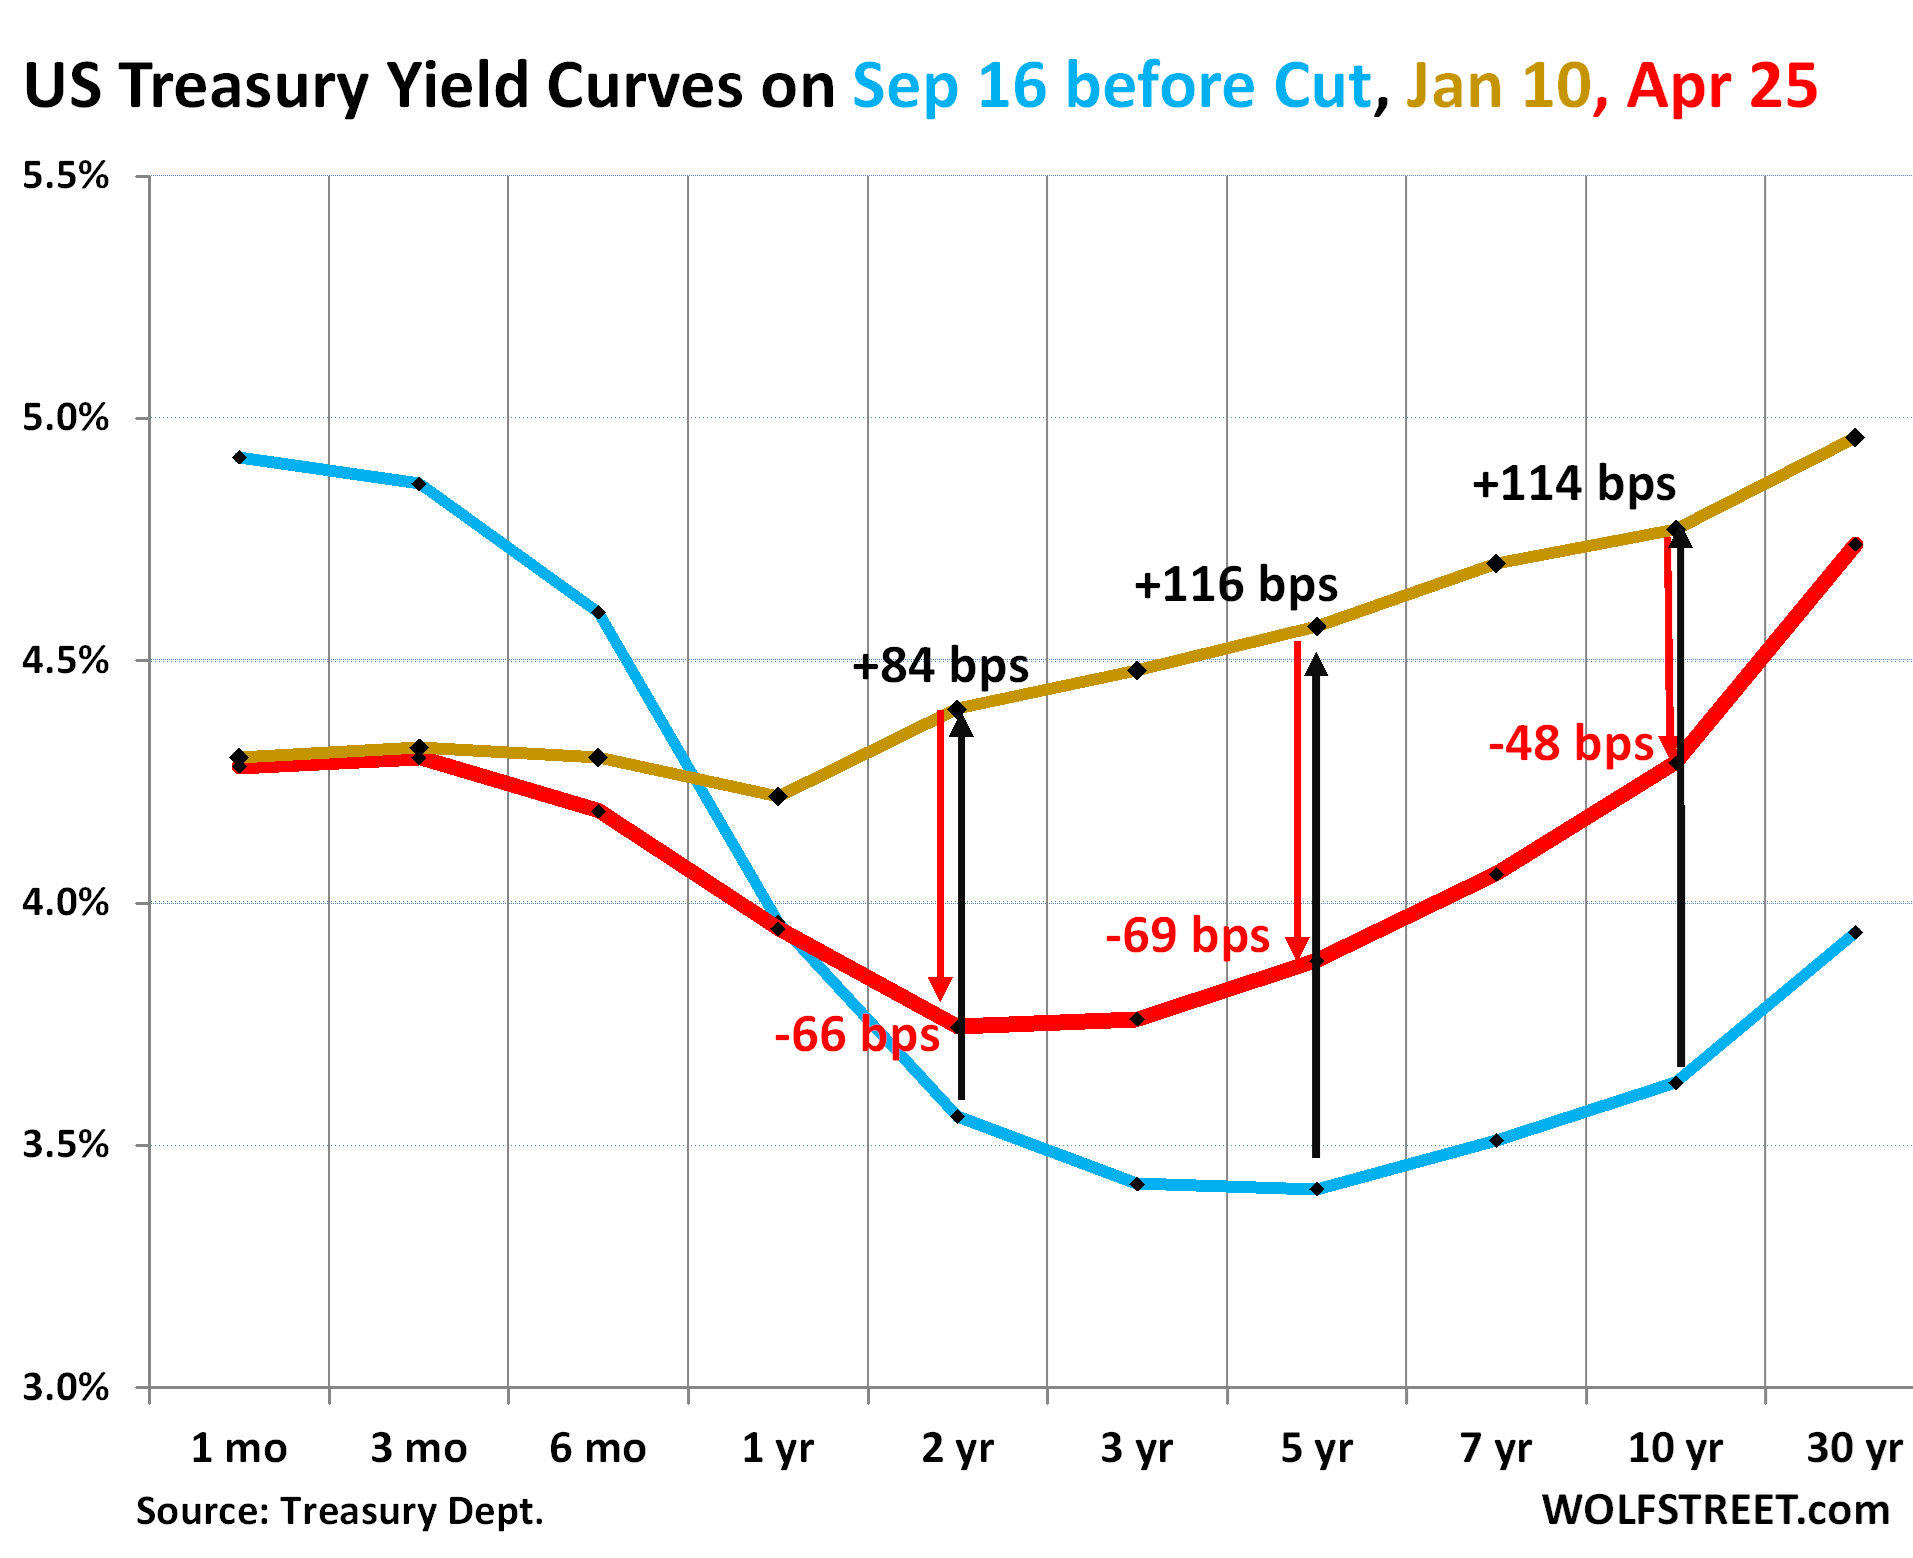
The yield curve’s sag in the middle deepens.
The chart below shows the yield curve of Treasury yields across the maturity spectrum, from 1 month to 30 years, on three key dates:
- Gold: January 10, 2025, just before the Fed officially pivoted to wait-and-see.
- Red: Today, April 25, 2025.
- Blue: September 16, 2024, just before the Fed’s monster rate cut.
Rate cuts have been on ice all year, and so short-term yields from 1-6 months haven’t moved much and remain near the EFFR.
Longer-term yields have snapped back from the recent lows, but are still lower than on January 10.
The yields from 1-7 years have dropped more than long-term yields, and with short-term yields held in place by expectations of the Fed’s policy rates, the sag in the middle deepened. That part of the yield curve has completely re-un-inverted since January.
Today, only the 30-year yield is higher than short-term yields. The 10-year yield is about level with the 1-3 months yields.
The 2-year yield dropped by 66 basis points since January 10, the 3-year yield by 72 basis points, and the 5-year yield by 69 basis points – all three of them far more than the 10-year yield (by 48 basis points) and the 30-year yield (by 22 basis points). And these much bigger drops in the middle caused the middle to sag so deeply.
Bessent’s yield bash-down.
Treasury Secretary Bessent tried hard to bash down the 10-year yield because it influences long-term funding costs in the economy and matters to the economy, and it worked and Wall Street loved it. But then the yield plunged too far, became unattractive at less than 4%, and demand withered at that yield, which caused the yield to snap back to where demand was, now at around 4.3%.
If Bessent didn’t try to bash down the 10-year yield, but let it ride to wherever the market saw fit, it would likely be quite a bit higher, given the current inflation dynamics, and given the risks of 10-year duration.
There will always be enough demand for Treasury securities because yield solves all demand problems: a higher yield makes securities more attractive and brings out the demand. And currently, demand is huge for 10-year debt, as we can tell from the relatively low yield of around 4.3%.
Bessent’s dollar bash-down.
Bessent also bashed down the dollar, and it worked too. A weaker dollar would boost the economy by favoring exports (a positive in GDP) over imports (a negative in GDP). Bashing down long-term yields and the dollar was the explicit two-pronged strategy by the White House to goose the economy.
But unlike the 10-year Treasury yield, the dollar has snapped back only mildly.
The dollar index [DXY], representing a basket of six currencies dominated by the euro and yen, dropped from 110 in January to 99.28 on April 20. But that drop was a lot smaller than the drop in 2022, and a lot smaller than prior drops, after which the dollar always eventually bounced back.
On Friday, the DXY closed at 99.60, where it had been on April 13, after the brief dip below the range and the bounce back into the range.
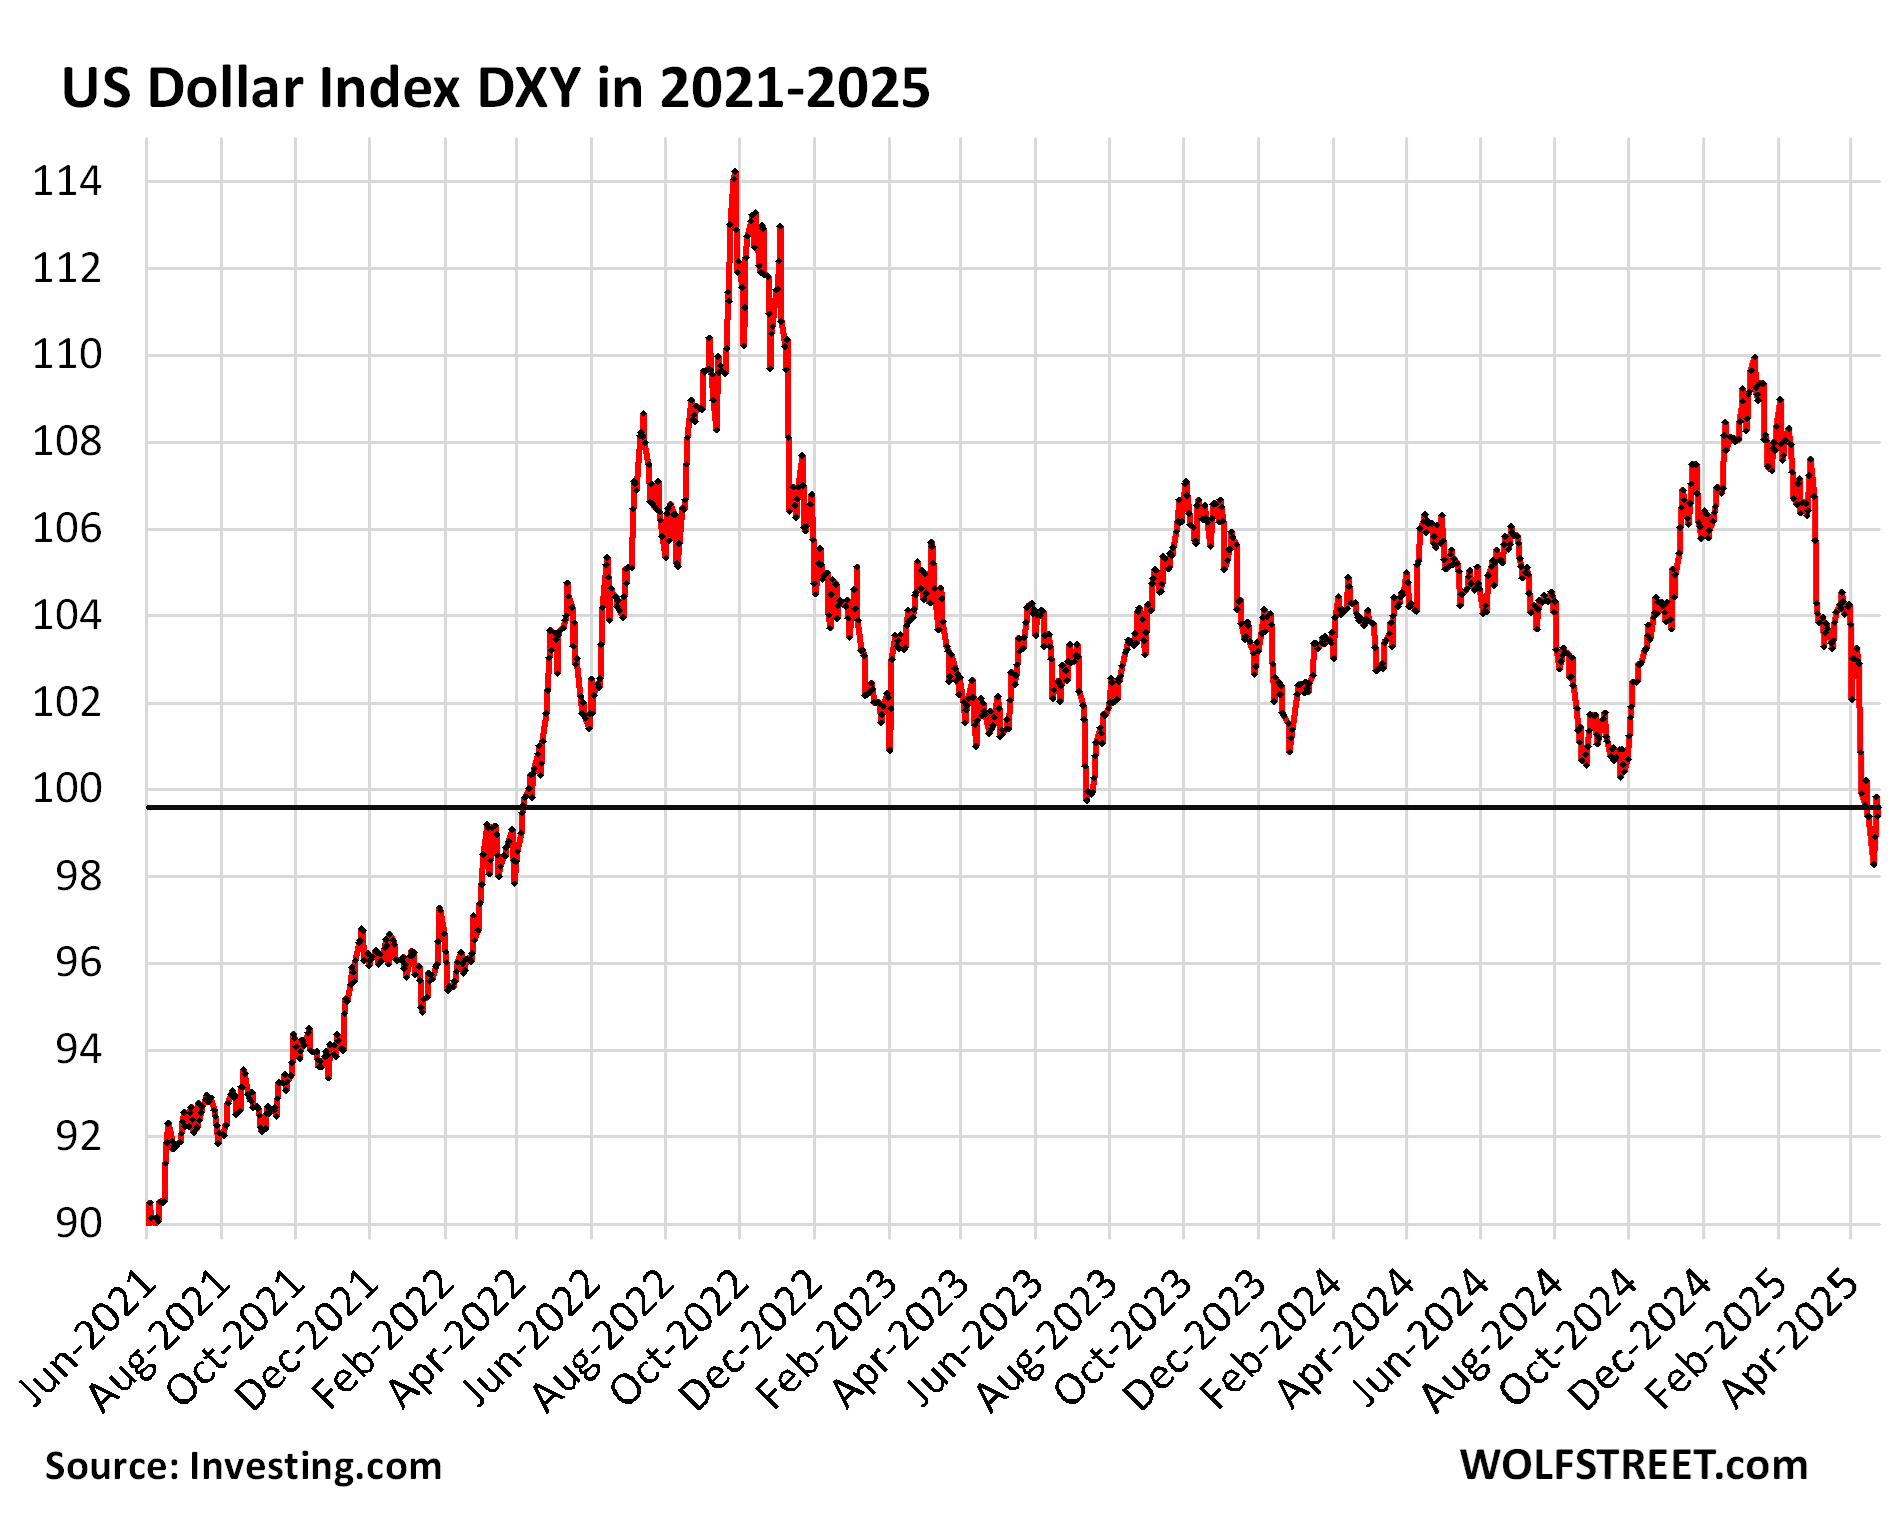
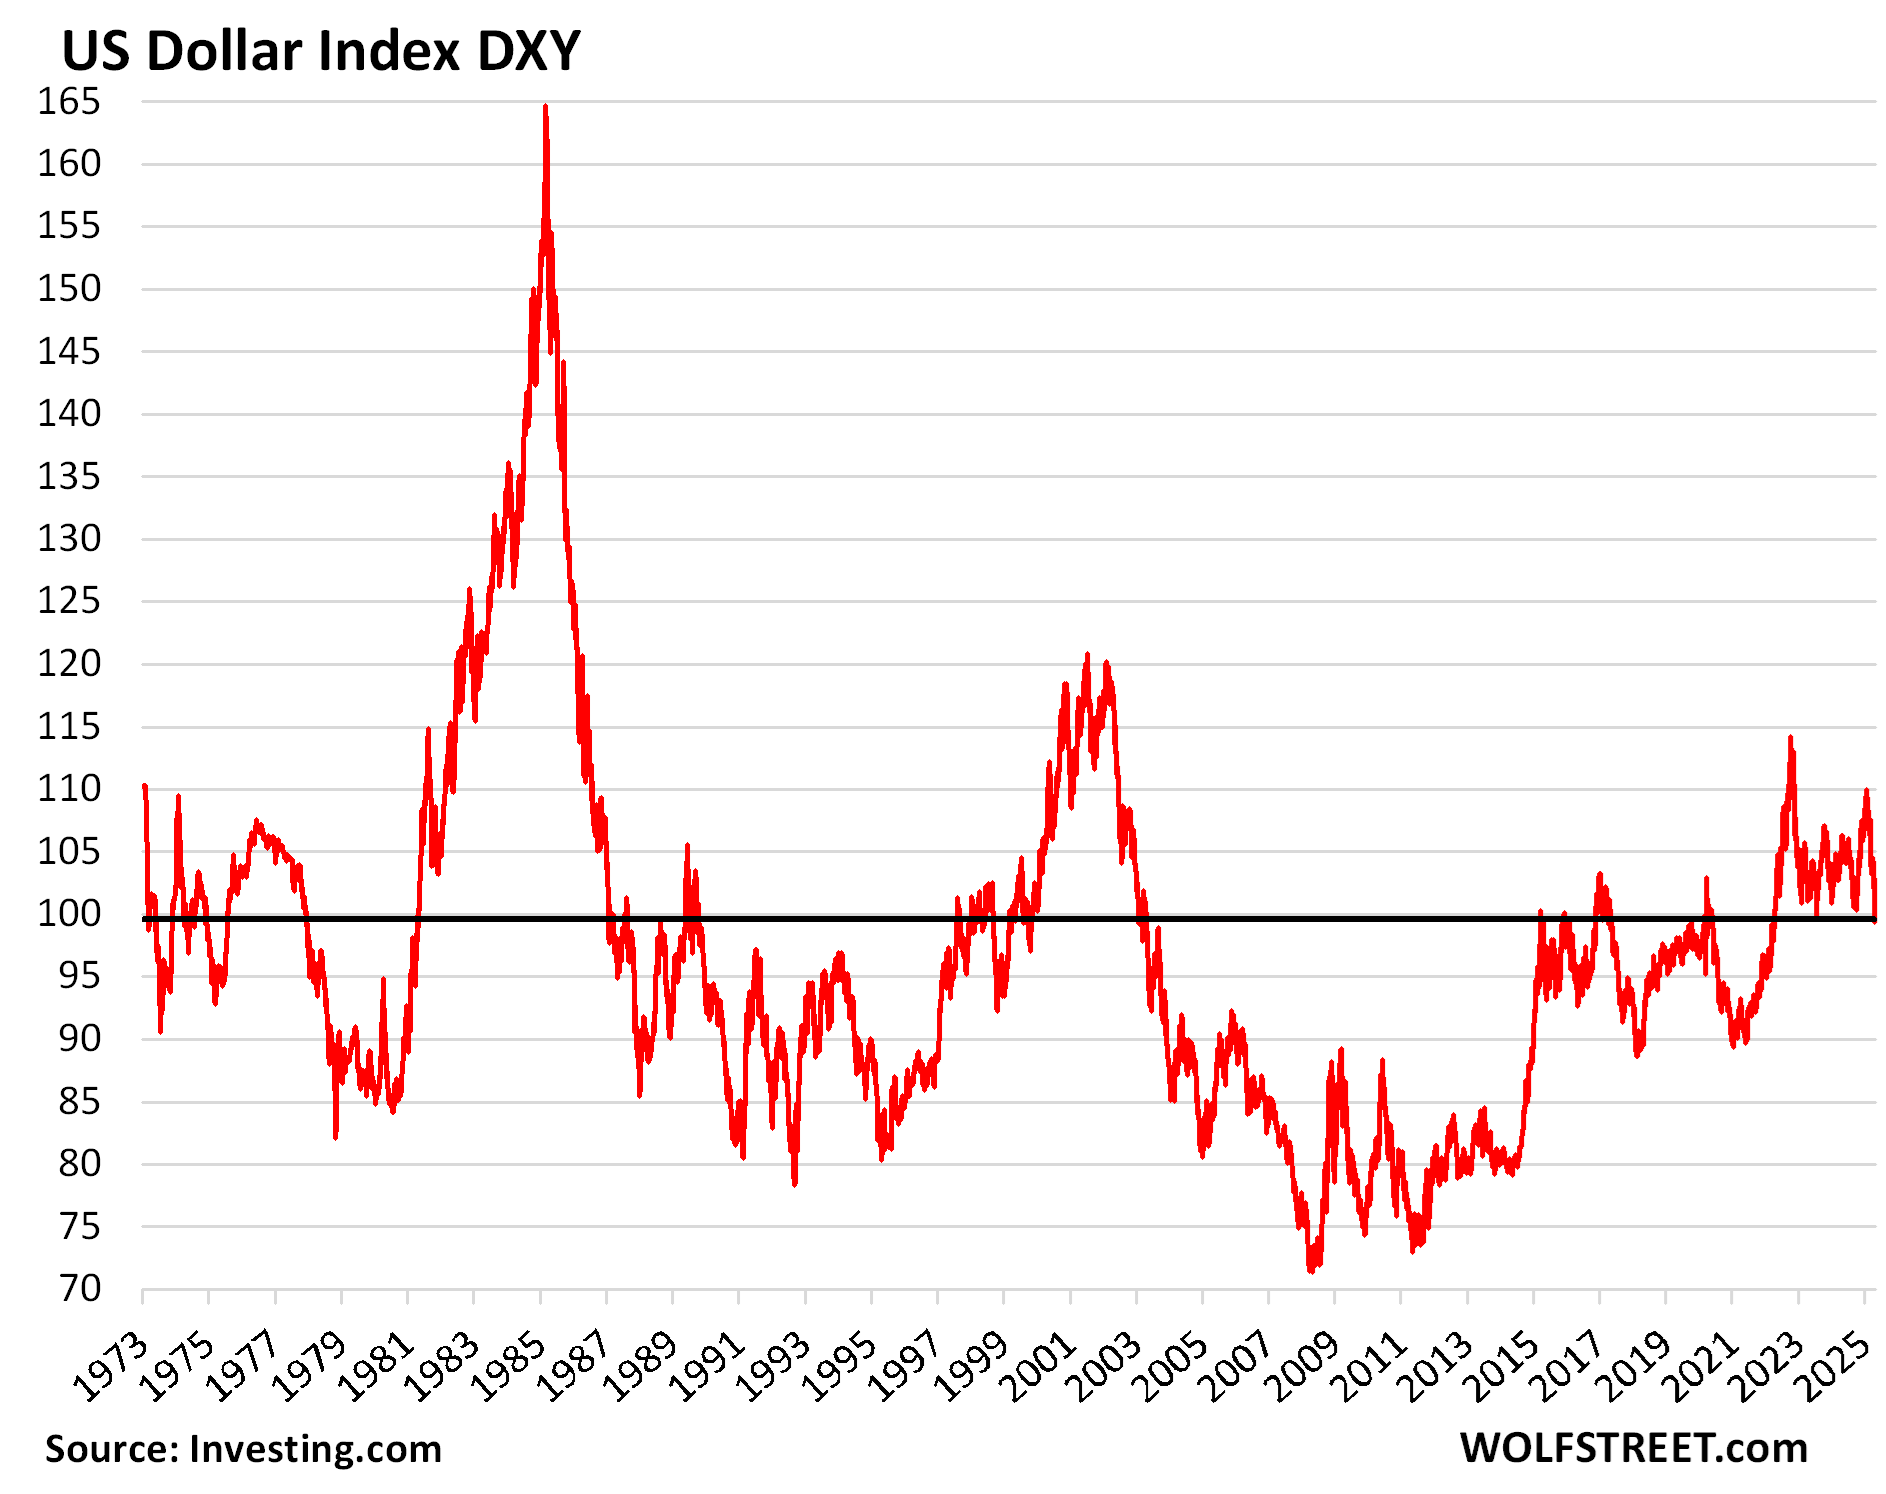
At the current level of the DXY at 100, the dollar is in solid territory. There were years when the DXY was below 80. And at the current level of about 100, the dollar is still relatively high compared to where it had been in the prior 50 years.
But at a 110, as in January, the dollar was considered too strong, causing US economic damage by favoring imports (a negative for GDP) and making exports (a positive for GDP) more difficult, which was why Bessent set out to bash it down from 110.
The DXY was set at 100 when it began in 1973, after the Bretton Woods system of monetary management had been scuttled.
Other dollar indices include the currencies of other large trading partners of the US, such as Mexico, China, India, Brazil, etc., and many of these currencies have constantly declined against the USD, and the USD looks a lot stronger in indexes with soft currencies included. For example, the Federal Reserve’s trade-weighted Broad Dollar Index has zigzagged higher for the past 20 years, and hit an all-time high in January, before dipping just a little.
But the DXY measures the USD only against other hard currencies.
Mortgage rates are higher in relationship to the 10-year Treasury yield than they were most of the time over the past 50 years. There are reasons. Here are my thoughts: The Spread between 10-Year Treasury Yield & Mortgage Rates Is Historically Wide and Widened Further
Enjoy reading WOLF STREET and want to support it? You can donate. I appreciate it immensely. Click on the mug to find out how:

![]()
Analysts cite that 80% of equity flows last year was to the US markets. Today, 30% of US debt and a large portion of the equity markets is foreign owned. Clearly, the dollar has been strong despite the incredible trade deficit due to these inflows. Do you foresee a DXY decline if we continue our trading pattern and if foreigners start hedging, given all that is going on? Something has to give over the mid-term?
i like to say that the u.s. stock market is the last ponzi scheme left. that is, it’s like what the nikkei was in the mid to late 80s. people buy, not because of intelligent assessments of valuations, earnings growth or anything like that, but because they think that values will keep going up, meaning that they can sell it to someone else for more down the road.
if enough people believe that, it becomes reality, at least until there’s a change in psychology.
I want to indulge in a thought experiment. Let us say that foreigners recycle their dollars into treasuries, debt and equity on account of their trade surplus. Their ownership of America becomes 100%. The globalist argument is that they gave it to us at a cheap interest rate. Well, they still own you. We borrowed cheap to buy a dress on Shein and maintain massive defence forces. What does that mean for America’s future?
Tariffs maybe a huge tax on US consumers. It could lead to a recession. But, maybe the US consumer & government will learn to live within their means. Consume what you produce and not more.
An alternate solution could have been a Plaza Accord. DXY could have been depreciated and making imports expensive and exports cheap. Would have been more palatable. But, that would have been a tax on the profligate US consumer too. Something had to be done.
NR wrote: “that would have been a tax on the profligate US consumer….”
OK. I am wondering how you define a “profligate consumer”. ?
Is it the one who buys 10 pairs of underwear for $12 and a pair of shoes for $9.00. Or is it the guy who buys a private yacht for $500 Million with money borrowed against his inflated stocks? ?
Just asking for a friend.
Brings to mind the Enron debacle. Sold a Fidelity mutual fund shortly before it happened.
A ponzi but not a free market ponzi meaning if it ever breaks it’ll fall much harder than a normal ponzi would.
Thanks for the update on the Treasuries, yield curve and the dollar. As an engineer, I like things being in equilibrium and all this looks pretty good to me based on the history of financial markets since the pandemic.
As a retired senior, it’s comforting that I can make enough interest on my fixed income portion of my retirement funds to at least stay even with inflation. That’s all a lot of us Taxing Units want out of the rest of our lives, from a financial standpoint.
100% the same sentiment.
Anthony A.
” us Taxing Units ”
Glad you are aware of what us peons are thought of from the elites. You must have gotten that phrase from GOLDMAN SUCKS former CEO and Treasury Secretary, Paulsen, who coined the phrase and made sure his fat cat buddies got bailed out by the taxpayers.
Yes, that’s where I got the phrase from. And it hit home.
Everybody keeps talking about inflation due to tariffs , but unless there’s more money put into this system will demand not decrease? Inflation should come from too much money in this system, But that’s not the case here.
Seems like tariffs could ultimately be deflationary, since it’s just a tax , which will create a vacuum of money exiting the system.
Great thinking. If tariffs increase the cost of some products, people/businesses have less purchasing to buy other products.
Here’s a potential impact to consider. If goods prices rise due to tariffs, and consumers/businesses decide to just pay it (as opposed to boycotting), does that mean there has to be less spending on services where budget constraints apply? Wouldn’t this put pressure on somewhat discretionary services like tech spending, travel, entertainment, restaurants, etc?
Predictions are difficult once we factor in second and third order effects, demand elasticities, etc.
The initial inflationary impulse of tariffs is predicated upon the premise that there will be fewer goods available for purchase with the same amount of money in circulation, or simply that you are going to have to pay more for any goods that do cross the tariff barrier — it’s a sales tax.
But this could tip into a deflationary impulse if the economy simply shrinks because businesses which relied heavily upon imports (perhaps for parts or commodity inputs) fail, throwing their employees into unemployment thereby reducing demand.
Likewise if the tax collection aspect of the tariffs exceeds the Federal government deficit, the economy will contract.
Really ? Since 2008isn, the Fed pissed on savers. making them pay for the casino losses of the well heeled.
Retired seniors that invested in 30 year treasuries during QE lost 40ish percent of their nest egg.
I am thankful, also, to have been born in the USA, a diamond in the rough
Regarding your prior article (referenced in the last paragraph), I think you had stated that current circumstances suggest a 5% 10-year treasury is a more reasonable current rate than 4.3%. That makes sense to me due to newly rekindled inflationary pressures today.
How disruptive to the stock markets, home/condo prices, and economic activity would a roughly 1% increase be (God forbid a characteristic overshoot!) ??
I still marvel at the market pyrotechnics of October 1987 when rates had risen significantly since the first of the year. The decline in bonds priced led to equity-like returns with the “full faith and credit” backing of the US government, and sent stocks spiralling. Stock valuation calculus shifted within a very dramatic week once the market hit the tipping point…
Ancient history, I know, but history often rhymes, as they say.
Thanks
Everybody keeps talking about inflation due to tariffs , but unless there’s more money put into this system will demand not decrease? Inflation should come from too much money in this system, But that’s not the case here.
Seems like tariffs could ultimately be deflationary, since it’s just a tax , which will create a vacuum of money exiting the system.
M2 money supply is increasing. There is differing opinion on the value of this, but I think it is more valuable than people think and I tend to side with people with Professor Steve Hanke on this.
What is decreasing is cash out refinance, as that door is getting slammed shut because people cannot qualify because of their income.
And if / when the housing market starts to crater badly, expect major freezes on helocs / cash out with much tougher guidelines just like the GFC.
Regarding inflation, people will spend like drunken sailors until they lose their job or lose access to their credit card or cant pull any more money from their 401k which a lot of people are doing right now. Although there are signs of weakness starting, like domestic travel being down.
Is money leaving the system if gov spends all the tariff money on tax cuts, defense, welfare, etc.? I don’t think so. Purchasing power just gets reallocated. But if a disproportionate amount gets reallocated to passive investors via tax cuts, I could foresee an increase in savings and drop in current demand.
I agree, the simple headline talk about tariffs increasing consumer prices is one-sided, perhaps politically motivated, and extremely unsophisticated.
This canard that businesses simply pass on their tax costs in a competitive marketplace is ridiculous. It’s scare tactics and gas lighting.
I suspect that there could be an initial inflationary impulse due to the tariffs, Aaron, but that you are likely correct that the longer term impact could be to shrink the economy unless the Federal government deficit expands beyond the amount being taken out by the tariff taxation.
The 10 year US treasury is tied to future inflation expectations. The higher future inflation goes, the higher the 10 year will go. Cheap comments from the president, Musk, Bessent, or anyone else is not going to stop the 10 year US treasury from going where it wants to go. No one cares about short term week to week. Its all about long term and where we are, say, 6 months, a year or 2 years from now.
The sales numbers for homes sales are in the sewer right now, rock bottom, and worse than last year. The expected home sales numbers for 2025 from many agencies thus far is way off base for the entire 2025 year, most are going to be off by at least 500,000-1,000,000 homes. The higher the 10 year US treasury goes, the worse homes sales will be, and the more home prices will fall. Supply is surging.
Do I think the 10 year US treasury is going to 5? If nothing is done with tariffs, I think in time it is going right through 5.
Understand, oil prices are are near, on average, a 20 year low bottom, and we still cant get inflation at 2 percent. And we still have a services inflation problem. And we are going to have much more expensive durable goods coming. And there is no way oil prices are going to stay where they are long term.
Everything points to future higher inflation and a higher 10 year unless a severe recession starts.
Yes, but strong demand also exists, and that probably isn’t going anywhere.
Inflation’s not a problem. It’s the Ph.Ds. in economics that are the problem. All the FRB-NY’s trading desk has to do is drain reserves.
But they lost control:
Mar 2025: 3,408.3
Feb 2025: 3,261.2
Jan 2025: 3,255.6
Dec 2024: 3,240.4
Nov 2024: 3,256.8
That’s the reason for reservable liabilities.
Black Monday was a monetary policy mistake, Greenspan’s, of great proportions. Legal reserves were drained at the fastest rate since the Great Depression. And this coincided with contemporaneous reserve requirements which exacerbated the outflow.
Spencer-
“Black Monday was a monetary policy mistake…”
….or perhaps an existential mistake? If the Fed — with its after-the-fact, error-prone, lever-pulling, economy-steering, unintended-consequence-producing, interventionist modus operandi — did not exist, that mid-1980’s bubble might not have occurred to the degree it did. As it was, Greenspan (of all people), helped exaggerate “animal spirits,” during the upswing, and came to claim the nickname “Maestro” into the bargain.
The ensuing proneness to financial crises is an ongoing matter of course. (Congressional disregard for balanced budgets is one of the afore-mentioned consequences.)
Respectfully.
Greenspan fulfilled Dr. Leland J. Pritchards predictions.
“How disruptive to the stock markets, home/condo prices, and economic activity would a roughly 1% increase be (God forbid a characteristic overshoot!) ??”
Assuming the discount rate goes up by 1%, and a P/E of 10, prices could be expected to lower by ~10%
I agree but let me suggest another idea, a more aggressive economic therapy that is tuned to the corrosive attribute of inflation. There is an algorithm developed that concludes the correct interest rate to extinguish inflation is 6.5 pct or so.
When the inflation, induced by the signature scarcity as the tariff regime hits where the Chinese suppliers have been cut off. The shelves increasingly are empty but we will learn to accept the cost of extravagance by others as our debt.
All our cash holdings are just a big IOU on somebody else’s balance sheet. Something to think about.
Silly.
There are only two kinds of capital: debt capital and equity capital.
With debt capital, you give the borrower some credit in exchange for interest that they pay you, and then after a specific time they pay you back the credit. Borrowers are obligated by contract to do that. The credit is often transferable, and you can sell it to someone else for more or less than you paid for it. (There are some credits that don’t pay interest, for example, the credit you give to the Federal Reserve in exchange for Federal Reserve Notes (paper dollars) of which there are $2.4 trillion, and credit you give to your bank in transaction accounts, such as a checking account, that pay zero or near-zero in interest).
With equity capital, you give the entity some credit in exchange for some ownership, and the entity is not obligated to ever give you your credit back, and is not obligated to pay you dividends but can if they choose. You can sell the slice of equity to someone else for more or less than you paid for it.
Those are the only two types of capital. You pick which you prefer. The first is considered safer, the second riskier. Many people invest in a mix of both.
Herr Wolf. I am wondering if you are able to tease this out of the data. What is the definition here of a “foreigner” ? ?
Are the foreigners buying US debt governments, private individuals, or could they be US owned corporations parking their profits in tax havens like Luxembourg, Ireland, Panama, Cayman Islands, etc etc.
Thanks.
The Auction Allotment Report doesn’t split that out. But the monthly TIC data, which comes out about two months behind the auctions, shows the entire holdings by foreign entities, and they split out “foreign official” which are central banks and governments, from the rest, which are private. Typically, the split is about 45% official (give or take some) and 55% private. (give or take some).
$2,400,000,000,000 dollars in circulation.
Heck, Nvidia is worth more than that(!!!!!)
(Whenever this nonsense finally ends, it WILL NOT BE PRETTY.)
Essentially like bitcoin except with an army that would fight too the death if the situation were too come to that.
It’s still a pretty good country with a lot of potential. The thing that is likely to save us is decency.
The one to ten year sagged as the big money moved to the risk free security with limited duration, Expecting inflation,
See Warren Buffets’ explanation of the U.S. dollar’s strength:
https://www.berkshirehathaway.com/letters/growing.pdf
“Why Foreigners Can’t Ditch Their Dollars”
Interesting; written in 2003.
“The bottom line is that other nations simply can’t disinvest in the U.S. unless they, as a universe, buy more goods and services from us than we buy from them. That state of affairs would be called an American trade surplus, and we don’t have one.
…. under any realistic view of things, our huge trade deficit guarantees that the rest of the world must not only hold the American assets it owns but consistently add to them. And that’s why, of course, our national net worth is gradually shifting away from our shores.”
His solution to lowering the trade deficit, as well as foreign ownership of US assets, is he admits, a kind of tariff called import certificates (IC). “We would achieve this (trade) balance by issuing what I will call Import Certificates (ICs) to all U.S. exporters in an amount equal to the dollar
value of their exports. Each exporter would, in turn, sell the ICs to parties—either exporters abroad or importers here—wanting to get goods into the U.S. To import $1 million of goods, for example, an importer
would need ICs that were the byproduct of $1 million of exports. The inevitable result: trade balance. ”
He also admits this would drive domestic prices very high (cost of US production versus off-shore), but he thinks it “would balance our books without there being a significant decline in the value of the dollar, which I believe is otherwise almost certain to occur. ”
But the data Wolf is posting on the Dollar Index doesn’t seem to show a correlation over time between a widening trade deficit and a weakening dollar. In fact, I think it’s the opposite (i.e., the dollar gets stronger as the deficit widens).
Of course, correlation is not causation. And as the saying goes, maybe this trend keeps happening …until it doesn’t.
Now I’m totally confused, but take solace that economics is Not a science.
The U.S. $ is being supported by legislation. The contraction of the E-$ market has been going on since 2007. It was accelerated by Basel III’s LCR, and Sheila Bair’s assessment fees on foreign deposits, which changed the landscape of FBO regulations. It helped make E-$ borrowing more expensive, less competitive with domestic banks (the exact opposite of the original impetus that made E-$ borrowing less expensive, when E-$ banks were not subject to interest rate ceilings, reserve requirements, or FDIC insurance premiums). And now Powell has eliminated required reserves.
This too shall pass.
“The bottom line is that other nations simply can’t disinvest in the U.S. unless they, as a universe, buy more goods and services from us than we buy from them. That state of affairs would be called an American trade surplus, and we don’t have one.”
We have a trade deficit which requires the government to issue debt obligations that would pay for the excessive spending. The GDP has measured as positive while the government was playing hide the hanky.. Borrowing money is not measured as a component of the GDP which has been consistently positive. reportedly growing in the 1.5 to 2.0 range.
I cannot say what my view of the resolution of the whole mess is because it is early in our innocence lost about China as a benign organization.
dang – mebbe also a few leftover ‘Nixon goes to China’ ‘murican preconceptions substituting ‘subservient-market’ for ‘benign’ in your concluding sentence…
may we all find a better day.
The TGA is at $606.632b. When the fiscal budget impasse is over, liquidity will dry up.
It seems there’s always a fiscal budget impasse. This irresponsible game of Chicken the two parties play is a profoundly destabilizing force on the political-economic landscape. Typically, it is the Republicans instigating the conflict, because they are the ones stereotypically against debt, but the Democrats’ “spend now, pay later” approach doesn’t have much to speak for it either. Both parties are intellectually bankrupt in their approach to fiscal governing matters.
I think that the the Republican tax cuts for the rich accounts for over 40 pct of the budget deficit.
We are long past the point where the deficit is a concern. Perhaps,
It’s not my world any more. It belongs too the next generations.
Who’ve had control for long enough to be judged as just as bad as us.
Several factors driving 10Y Treasury well above 5% in coming weeks:
– weak dollar. As dollar weakens, interest rates rise to compensate for holding weakening currency.
– Supply of Treasuries – while debt ceiling is stalled for now, it is certain it will be raised (especially since the whole DOGE thing is a failure)
– Inflationary pressures – tariffs will start pushing inflation up in a week or so…
– As I mentioned before (and for which I was wrongly chastised) declining faith in the US Gov’t… (which has nothing to do with volume of Treasuries purchased by foreign entities – as is obvious – they continue to buy as the interest rates rise…. sort of proving the point).
Tell that to the person getting paid $60,000/yr to water 6 plants at HHS headquarters.
From the DOGE feed on X, which means it’s probably an outrageous lie.
Of course its all lies.
Lean & productive Government.
36 trillion? Imagine if the govt. was inefficient!
There is a phrase ” vegetative electron microscopy ” which AI is compelled to repeat. Every person should search all AI platforms with that phrase to embed it deeper into the vulnerabilities of the AI Trojan Horse
The DOGE thing, even if wildly successful, wouldn’t have an impact on debt ceiling. I am sure someone has also done an article somewhere on the cuts that will actually increase costs( such as to the IRS). There is a great dashboard that tracks projected saving from DOGE as well as expected additional revenue from tariffs, along with all the other metrics. To me it is all just political pandering and entertaining memes. There isn’t a future that can be envisioned where core problems can be addressed and perhaps too late already anyway. We will just continue to have what most of the world has, a political pendulum swing with people thinking “well, that didn’t work, let try the other party.”.
DOGE is/was after the American’s personal data to be commercialized against our will.
It only cost $250 mm campaign contribution.
And of course if you don’t count twitter purchase. Hard to argue that was About profit versus influence.
You are severely TDS afflicted. DOGE could not care less about commercializing our data. I know the Dem water carrying media has told you this. But it is a lie.
Howdy DrJ. Doge did teach Govern ment they no longer had to be miners.
They can now file employees retirements into a computer.
No reason foreign buyers won’t keep coming until there is a competing essentially risk free option. That is of course very likely someday but very unlikely in the context of making decisions today.
Not buying a Tesla because Elon is Elon is not the same decision process as foreign governments make. They have to consider what selling or not buying treasuries would do to their currency and so on.
I do wish however they would stop so yields would rise. Always good when more debt can be kicked down to our offspring. WIIFM!
Mr. Wolf, what is the effect of the Debt Ceiling on the supply of debt to the Treasury market ? It seems like supply should be limited basically maturities with some fluctuations as tax payments provide Treasury with cash. This would make me think that what we see in the Treasury market at this moment may not be the full picture. With supply somewhat limited I would kind of expect price to go up – yield down.
Is it not that simple in general terms.
If you’ve written on this before, can you post the link.
In April, Treasury raked in a huge amount in tax revenues, and the TGA balance jumped from $280 billion at the end of March to $640 billion on April 16 (after Tax Day). So the Treasury wouldn’t have to increase the debt right now. They can just roll over what’s maturing for a little while.
The auctions of coupon securities, particularly 10-years and up, are mostly planned in advance in order to be predictable. Over the last two years, the Treasury favored adding debt via T-bill issuance and not adding that much to the debt via longer-term securities, with the purpose of keeping long-term yields low.
Despite the debt ceiling, they haven’t changed the auction size for coupons yet. They’re running along the pre-announced pace. So supply is as expected, no increase or decrease.
But they would eventually have to decrease T-bill issuance. And that’s when they get very quickly to the end of their rope.
The big thing they do to deal with the debt ceiling is not issuing securities to some government pension funds – the “extraordinary means” they keep talking about. They can do this for a while. And then that stops too.
Then on the day the debt ceiling is resolved, they will issue all those bonds to the pension funds, and that is why the debt will jump by $500 billion or whatever in one day – it’s not that they sold that many securities at auction.
In addition, they will refill the TGA by issuing lots of T-bills very quickly at huge auctions several times a week for six weeks in a row. And then they will gradually increase auction sizes of coupon securities to lower the pile of T-bills.
This is by now a well-oiled machine.
Personally, I see the mark 4.5 on the 10 year yield as a line in the sand. Go above market is worried about inflation. Go below they aren’t worried about inflation. Go below 4% they are about deflation. So there is value in the intermediate part of the bond curve, no?
expected treasury net marketable borrowing by quarter
293.9 2nd qtr.
544.9 1st qtr.
One might expect rates to fall based on borrowing requirements.
Now, off rock bottom, the 10-year challenges Grant’s description of a “return free risk.” Only time will tell, as many here observe:
currency debasement x systemic ineptitude => 4.3% < satisfactory
By the time we see a 5% yield? It may mean that 6-7% is where a “positive return” lies.
I am not sure that gold will continue to compensate for this? (but we can see that participants in that market are pricing in continued debasement/ uncertainty).
We still have the cleanest shirt in the hamper. Despite the almighty jawbone: it seems like the DXY is sick of declining (for the moment), and the 10-year won’t change its trajectory (for the decade?).
FWIW: Historically the DXY has avoided trading in the 100-105 range for prolonged periods (seeing it as resistance /in recent decades as “too high”). This is a zone it’s been favoring for the past 2-3 years.
‘We still have the cleanest shirt in the hamper.’
Don’t confuse most used currency with ‘hardest’ as in least likely to depreciate. Two rock hard currencies: Swiss franc and Norway’s kroner.
During the US dollar crisis, which many persons commenting seem not to have heard of, American’s sought safety in the Swiss franc and the German D- Mark. This drove both to very unpleasant levels for their domestic industry. Now that Germany is, let’s say ‘hitched up’ and with kids to boot, they don’t have that problem. For Switzerland the strength of the franc is an ongoing problem.
“Two rock hard currencies: Swiss franc and Norway’s kroner.”
LOL.
1. Look at a 10-year chart of the NOK/USD: 10 years ago, 1 NOK was worth 13 US cents. Today 1 NOK is worth 9.5 US cents, having lost 27% of its value against the USD. That currency has become about as soft as a wet washrag.
2. The CHF, a tiny currency whose central bank prints huge amounts of money to convert into foreign currency and buy foreign assets with, has become essentially shares in a hedge fund. It’s a racket, and non-Swiss investors go for it to make money, and that buying drives the CHF higher. It’s not really a currency outside of Switzerland.
I sure got kroner wrong. I’m surprised because in other metrics Norway is almost uniquely strong.
‘Norway has a very large sovereign wealth fund, which outweighs its public debt by a very large amount. It is one of the few countries in the world with no need to borrow money.’
Maybe it just wants a cheap currency for business reasons.
Re: Switzerland. Not every business there is finance. It has a robust industrial sector that among other exports to the US are nuclear reactor parts. A while ago industry bleated so loud Switzerland tried pegging the franc to the US dollar.
But maintaining the peg against a tide running the other way got expensive.
Anecdote: If you are ever cutting steel with a reciprocating saw, use a Swiss blade.
Yes, to Wolf’s point: the Franc is printed to buy US stocks, for at least a decade. It’s more closely tied to the price of AAPL than whatever else.
I’m not sure what the holdings of the franc are on other balance sheets, let’s just round it to about 0.
I’m seeing a wave of articles across MSM platforms about the “crash” in the DXY, now at a 3- year low. And trading higher than the last 10-22 years, minus a couple “high spots” poking into the 100-105 “no- trade zone”
The DXY is more a reflection of trade policies. The USD is a reflection of GDP/GNP, which is more related to corporates, and therefore the stock market etc.
Barring recessionary environment, I still see at least a technical bounce. The strength of the USD/ DXY was the “crisis” 3 years ago (weaponized?)… this is why the current administration is jawboning it down.
I figured that gold may make the list of “rock solid” but I hardly consider it a currency myself. Looks like a risk asset on the chart.
The FED will begin fudging GDP numbers on April 30
As of April 24, 2025, the Atlanta Fed’s GDPNow model estimates a -2.5% annualized contraction in U.S. real GDP for the first quarter. However, when adjusting for the recent surge in gold imports and exports, the alternative model forecasts a more modest decline of -0.4% .
In early 2025, nonmonetary gold imports averaged $29.1 billion per month, significantly higher than historical levels.This surge has distorted the trade balance component of GDP calculations, as imports are subtracted from GDP.Recognizing this anomaly, the Atlanta Fed introduced a gold-adjusted model in March, which estimated Q1 growth at -0.1%. This revised model will replace the standard one on April 30 to more accurately reflect economic conditions.
This is ignorant BS because nonmonetary gold imports and exports have always been and still are SPECIFICALLY EXCLUDED FROM GDP calculations because buying gold bars is considered similar to buying stocks, they’re financial investments, and they’re NOT included in GDP calculations. The BEA, which figures GDP, has always done it that way. But the Atlanta Fed – whose GDPNow is an aglo that tries to predict the BEA’s real GDP growth figure — fucked up and didn’t exclude nonmonetary gold. It wasn’t a big issue until suddenly gold imports spiked, which blew up the GDPNow algo. The Atlanta Fed has now fixed its model and came out with a big article explaining it, and all you need to do is read it, instead of posting stupid conspiracy theory BS here, you goofball.
https://www.atlantafed.org/blogs/macroblog/2025/04/23/the-switch-changing-conditions-behind-new-gdpnow-model
Also the St Louis and New York fed have their own measure that are better
Wow! That’s what I like about this site. No one, even the host, holds back how they really feel about some comment that goes off the rails. .
The basic problem we all face is that there is no absolute store of wealth. It’s all relative.
So, if you are a foreigner and the best return you can get in bonds from your own government is 2%, then it can seem a reasonable gamble to buy US bonds paying 4+% in the hope that the US dollar will not have dropped more than 2% by the time you sell the US bonds. And that’s without thinking of hedging. As the saying goes: “If you know a better shell hole.”
Wait till the hogs (US BOND buyers) at the hog trough find out their food is poisoned. It’s bound to happen sooner or later. Just saying. Note: I’m NOT lining up at that hog trough.
From April 2025, we have very minimal QT. Just 5B for Treasury securities. That’s is going to help US Treasuries to bring down long term rates. It may not be huge pressure but definitely some effect. We now have a fixed/constant buyer for 20B every month.
Total QT = $20 billion: $5 billion Treasury and $15 billion MBS.
There are about 30 grams of gold per person in the world. So how can it be a basis for money again? The answer is it won’t be. Huge amounts of it are already hoarded, or used in plating. The biggest problem over time is interest returns.
So, maybe the ultimate investment would be long term ground leases. Or children.
I would note that people keep digging up buried hoards of the valuables that didn’t work out for those who buried them centuries ago.
The biggest investment winner of the last century has been Uncle Warren. Returns on honest numbers. Show me honest numbers for emerging markets, and that would probably be the best way for the next half century, but the foundation of investing is the rule of law. Which is dying.
So will this money, as have all of them.
History is long, political will is short.
CAM – well said. (Human nature what it is, makes one consider, given enough time and tomb-preservation/looting perturbations, that beanie-baby hoards might have a future-certainly more fun than any
unearthed wads of extinct-issuer paper they were initially-purchased with, and even THAT certainly more-fun&likely than the recovery of any long-vanished electrons of crypto…).
may we all find a better day.
A great argument for gold. Point one: before Nixon ended US dollar convertibility to gold, setting off the US $ crisis, Americans did not carry a few grams of gold to do their shopping. What ended was a benchmark, limiting the govt’s issuance of paper money.
“but the foundation of investing is the rule of law. Which is dying.”
The foundation for the issuance of a fiat currency IS the rule of law, specifically the ‘fiat’, Latin for ‘command’, ‘that this piece of paper is legal tender’. Gold is where people go when the power of the fiat is in doubt, usually because the issuer has abused his sovereignty and issued too much.
I think it’s unhelpful to think in terms of “store of wealth” absent any consideration of society’s future productive capacity — absent the latter there will be nothing to buy with your “wealth.”
If you are “saving” it’s presumably in anticipation of “consuming” later, so savers as a group have an interest in ensuring that their society continues functioning so that it will still be producing whatever they hope to eventually consume. This concern only becomes more and more serious the longer the anticipated interval between savings and consumption — think here across generations. This is why public institutions like education are so important, since they are theoretically immortal and help propagate productive capacity down the generations.
So 10 YR under 4 is not v even in the cards in 2025?
I’ll take the 4-5% for my retirement accounts, for now. That might be a positive return after inflation, depending on whether you agree with the subjective hedonic adjustments. As for taxable accounts, I’ll have to pass.
Where else will people park their money?
A relatively stable US Treasury certificate, or in a country where a dictator can seize your life savings at will, or end up in a country where the local currency and inflation are hyperinflationary like Argentina?
I’ve read countless stories of Americans trying to “stick it to the man” by investing in emerging markets only to end up paying more in the informal tourist tax, or end up being swindled by the corrupt authorities there.
I always laugh when an American comments on corruption as though his country has no corruption. Really? The US is as corrupt a regime as has existed in human history. Read about Senator Rick Scott. The corruption in the Ohilippines or Colombia is nickel and dime stuff compared to the pros at work here!
I think Gen Z has said in the past that he’s in some non-US country, I can’t remember which, looking from the outside in.
DM: Grocery giant Albertsons sounds major warning on price hikes that will impact all Americans after Trump’s tariffs
One of North America’s largest supermarket chains has bluntly told its suppliers they will not accept increased prices related to Trump-imposed tariffs.
One of North America’s largest supermarket chains has bluntly told its suppliers they will not accept increased prices related to Trump-imposed tariffs.
Albertsons, which operates more than 2,200 supermarkets and is the second-biggest grocery chain in the continent, drew a hard line with it suppliers last month.
The Idaho-based company – which also runs stores including Balducci’s, Kings and Safeway – sternly declared they will not tolerate any unauthorized price spikes.
This is such insidious stupid-ass propaganda spread by one of the worst rip-off companies in the US, and then spread by the stupid-ass Daily Mail, a trash tabloid for morons that no one should read.
I just got back from Safeway, which is one of the Albertsons brands. Much of the produce was from Mexico, and it was very expensive. The Central Valley just an hour from here has every bit of that produce, and you can buy it for less at Costco and Trader Joe’s (limited selection). THIS IS ALL ABOUT PROFIT MARGINS. And tariffs are going to cut into them because the stores that get produce from the Central Valley don’t have to pay tariffs, DUH. But the idiot Daily Mail is lying to its readers about that.
Albertsons, which was a leveraged buyout by a PE firm that was then combined with Safeway and other chains for monopolistic reasons and then sold to the public, is a gangster organization. No one should buy there unless they absolutely have to (which is our motto, so we don’t buy much there).
I cannot believe the bullshit in the Daily Mail, by morons for morons, or maybe by AI for morons. But you’re certainly passionate about spreading this bullshit around here, though I delete most of them. If you want to pollute your brain at the Daily Mail, go there, not here.
Why the %^& are you buying groceries at Safeway, the most expensive GD supermarket in the Bay Area? Only Andronicos is more expensive and they are owned by Safeway. Get an Instacart account ($99 a year) and get your groceries from Walmart, delivered. There is a 9% markup, but it is still cheaper than any other store. I use an Instacart credit card, which gets me 5% cash back. Throw in transportation costs and the value of my time, and it is even cheaper. Walmart produce sucks, but you have that Asian delivery service you mention from time to time.
The Bay Area needs Aldi and Lidl. Back in 1971 when I more-or-less lived in Germany, I used to shop at Albrecht’s, the predecessor of Aldi. Buying stuff out of cardboard boxes was cool.
As I said, we buy most of our stuff at Costco and Trader Joe’s and at our local farmer’s market (Fort Mason) and online (Weee and others). But about once every month or two we go to Safeway for some stuff.
Sounds like a good shopping plan. From your recent comment, I mistakenly inferred you shopped at Safeway a lot. Wow, Costco. I went there once. Seemed like an insane asylum. Not as bad as Walmart, but once was enough. I buy stuff at Walmart, but only by delivery.
“Seemed like an insane asylum”
Not seemed like.
Safeway has just closed their flagship store here near me. I hardly ever shopped there but used it for a backup. Their customer service was dreadful, insufficient check-out workers, poor service at their deli, bad customer interactions, incompetent management. Their prices were no bargain either. So there was no reason to shop there anymore.
All the grocery stores here in the SWAMP suck. They have become junk food distribution centers. Why customers put up with this is beyond me. I’ve made so many complaints to management and to their home offices, one of them up in Boston, to no avail They ignore my complaints. I’ve started buying my fish at Balduccis which is owned by the same crooked company that owns Safeway. The prices are 30% higher across the board for fish and produce. I can afford it. Lower middle class and lower can’t afford these higher prices so the have to shop at bargain stores here which sell low quality of everything and junk food galore. They pay later in large medical bills. As John Edwards once said, and was correct, There are 2 Americas, One for the rich and one for the rest of us”
If you’ve never read Akerlof and Romer’s paper, “Looting: The Economic Underworld of Bankruptcy For Profit”, I’d recommend checking it out. Both are Nobel laureates (pedantry: Nobel equivalent).
FTA: “Our theoretical analysis shows that an economic underground can come to life if firms have an incentive to go broke for profit at society’s expense (to loot) instead of to go for broke (to gamble on success). Bankruptcy for profit will occur if poor accounting, lax regulation, or low penalties for abuse give owners an incentive to pay themselves more than their firms are worth and then default on their debt obligation.”
I have the sense that leveraged buyouts smell very close to bankruptcy for profit.
We were told for years that grocery stores were gouging customers but now they aren’t?
I think there is plenty of weird stuff going on but I also think like 80% of it is manufactured garbage and if we had honest reporting for the last 25 years then we’d be a much more moderate society
“ Turns out, demand from foreigners for Treasury securities at the auctions was just fine.” Reminds me of that old saying – ‘There’s a sucker born every minute.’ Indeed
As far as that Alberson’s commentary above – one thing is clear – the man sitting in the chair sure released a shi* storm with his tariff policy. Buckle up, people.
Anybody know the percentage of treasuries outstanding by duration? I found that half are notes, the other half are bills and bonds, but I would like a better breakdown. I’d mainly like to know what percent are bills, and what percent are bonds. It would be nice to know by 1 month, 2 month, 3 month and so on up to 30 year.
total marketable Treasury securities: $28.57 trillion
of which:
Notes (2-10 yr): $14.8 trillion
Bills (1-12 months): $6.16 trillion
bonds (20,30 yr): $4.9 trillion
TIPS: $2.03 trillion
FRNs: $0.56 trillion
Thanks. So bills are more important than bonds, which was my impression. Bills are a lot more important than 10 year notes. MSM seems to like to talk about 10 years a lot.
The Treasury is heavily skewed toward bills, and during the election campaign, Republicans criticized Yellen for it. And when Bessent was appointed and before he took office, he said he’d gradually replace some of those bills with notes and bonds. But then, once in office, he saw reality and wanted to get long-term rates down, same as Yellen, and now favors bills, same as Yellen. Today’s projections for Q2 made that also clear. They all want to keep the 10-year yield down because it really matters.
We talk about the 10-year Treasury yield a lot because it’s the benchmark for long-term interest rates in the US, including mortgage rates. It determines a lot of borrowing costs and really matters to the economy. Short-term yields don’t really matter that much for borrowing costs, except for floating-rate debt pegged to SOFR.
10/1/2024 -257450.3432
11/1/2024 -366763.0644
12/1/2024 -86731.61901
1/1/2025 -128640.2067
2/1/2025 -307017.1947
3/1/2025 -160530.3215
-1,307,132.749 fiscal deficit so far this year. Will the bond market teach Congress a lesson?
I gotta wonder: How much instability in the world has inadvertently been caused by “excessively” low interest rates, leading to debt being used to acquire and drive up asset prices? Leading to further income inequality? Like… how many populist candidates the world over have come to power due to voter dissatisfaction from this source? Maybe even Putin invaded Ukraine to draw his population’s attention away from domestic financial difficulties?
Purely speculative on my part at this point, but it was the new global paradigm that preceded and accompanied the current era. Perhaps it even influenced the mass migration that has been an intensifying factor?