The 3-year 50% price explosion has caused epic demand destruction. Prices are way too high. But mortgage rates are back in the historically normal range above 6%.
By Wolf Richter for WOLF STREET.
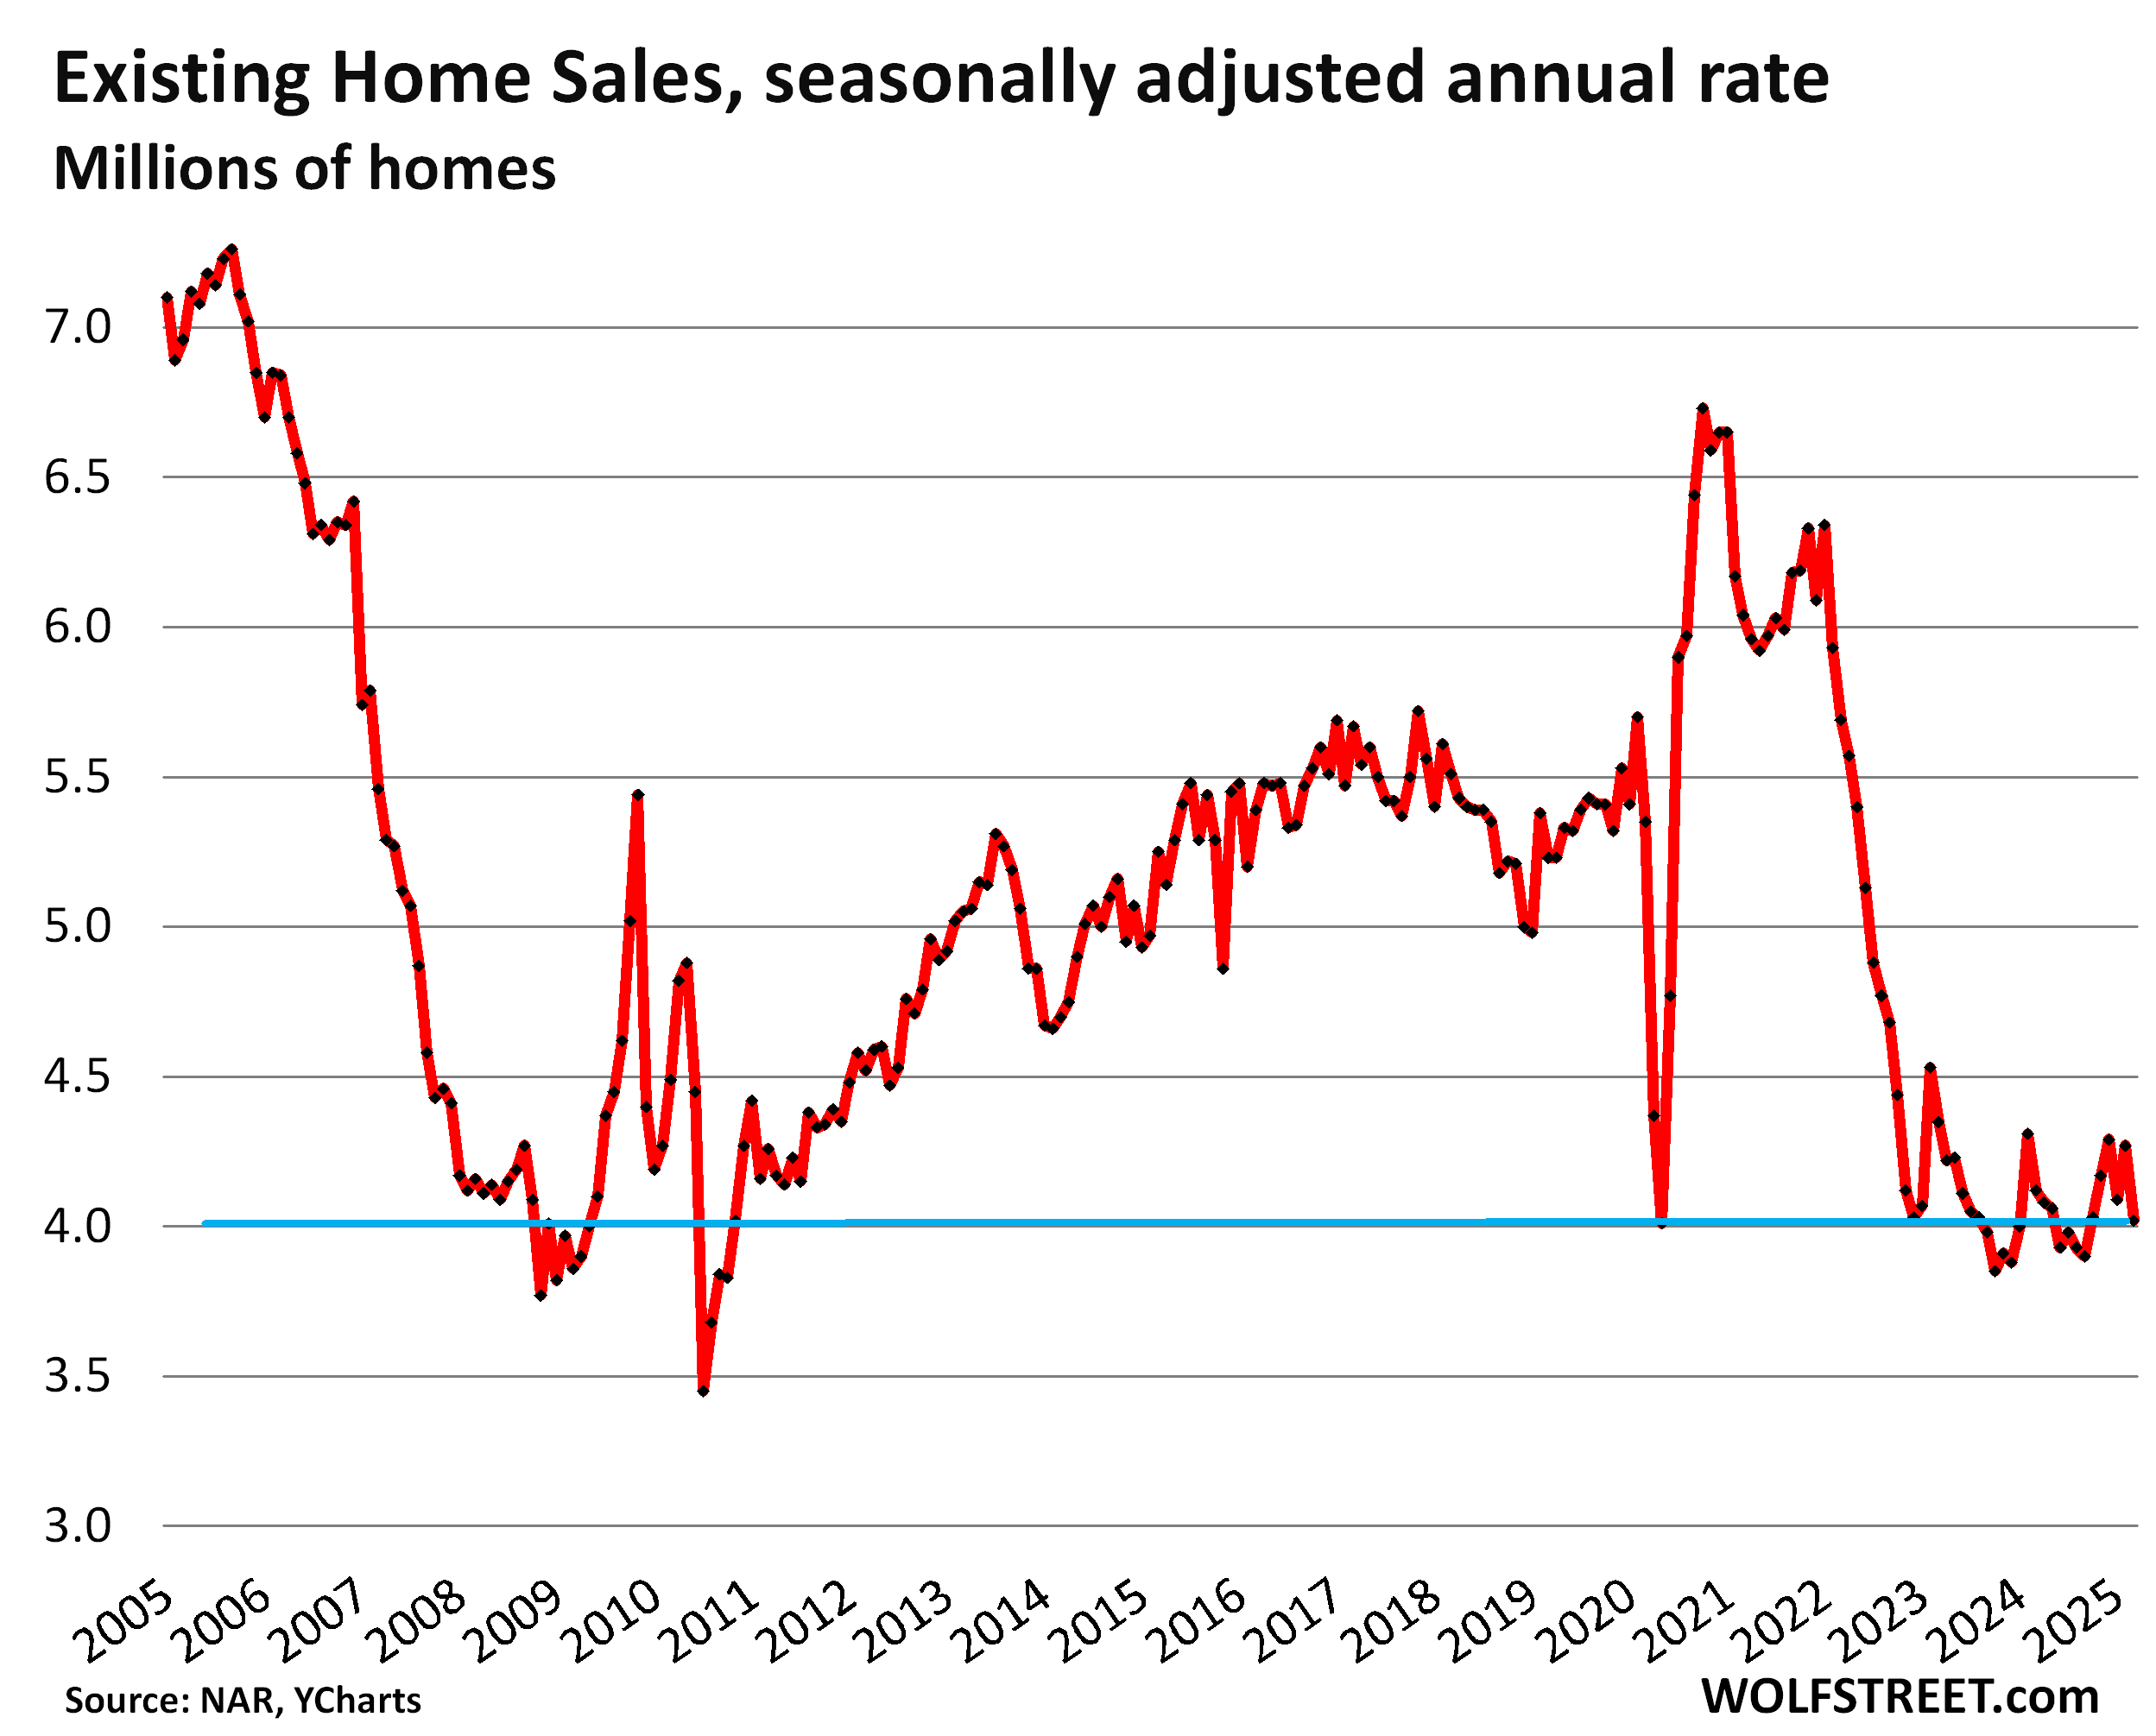
The feverishly anticipated spring selling season is starting out as a dud. Sales of existing homes – single-family houses, townhouses, condos, and co-ops – that closed in March fell by 3.1% from the already frozen volume a year ago to 315,000 deals, not seasonally adjusted, down by 31% from March 2022, which was when home sales began to plunge after prices had spiked in many markets by 50% or more in just three years, to ridiculous levels, thereby destroying demand.
Demand destruction on display: The seasonally adjusted annual rate of sales of existing homes fell by 5.9% in March from February, and by 2.4% year-over-year, to a rate of 4.02 million, the worst March since 2009, according to the National Association of Realtors today. From the Marches in prior years (historical data from YCharts):
- 2024: -2.4%
- 2023: -7.6%
- 2022: -29.3%
- 2019: -23.1%
- 2018: -27.0%
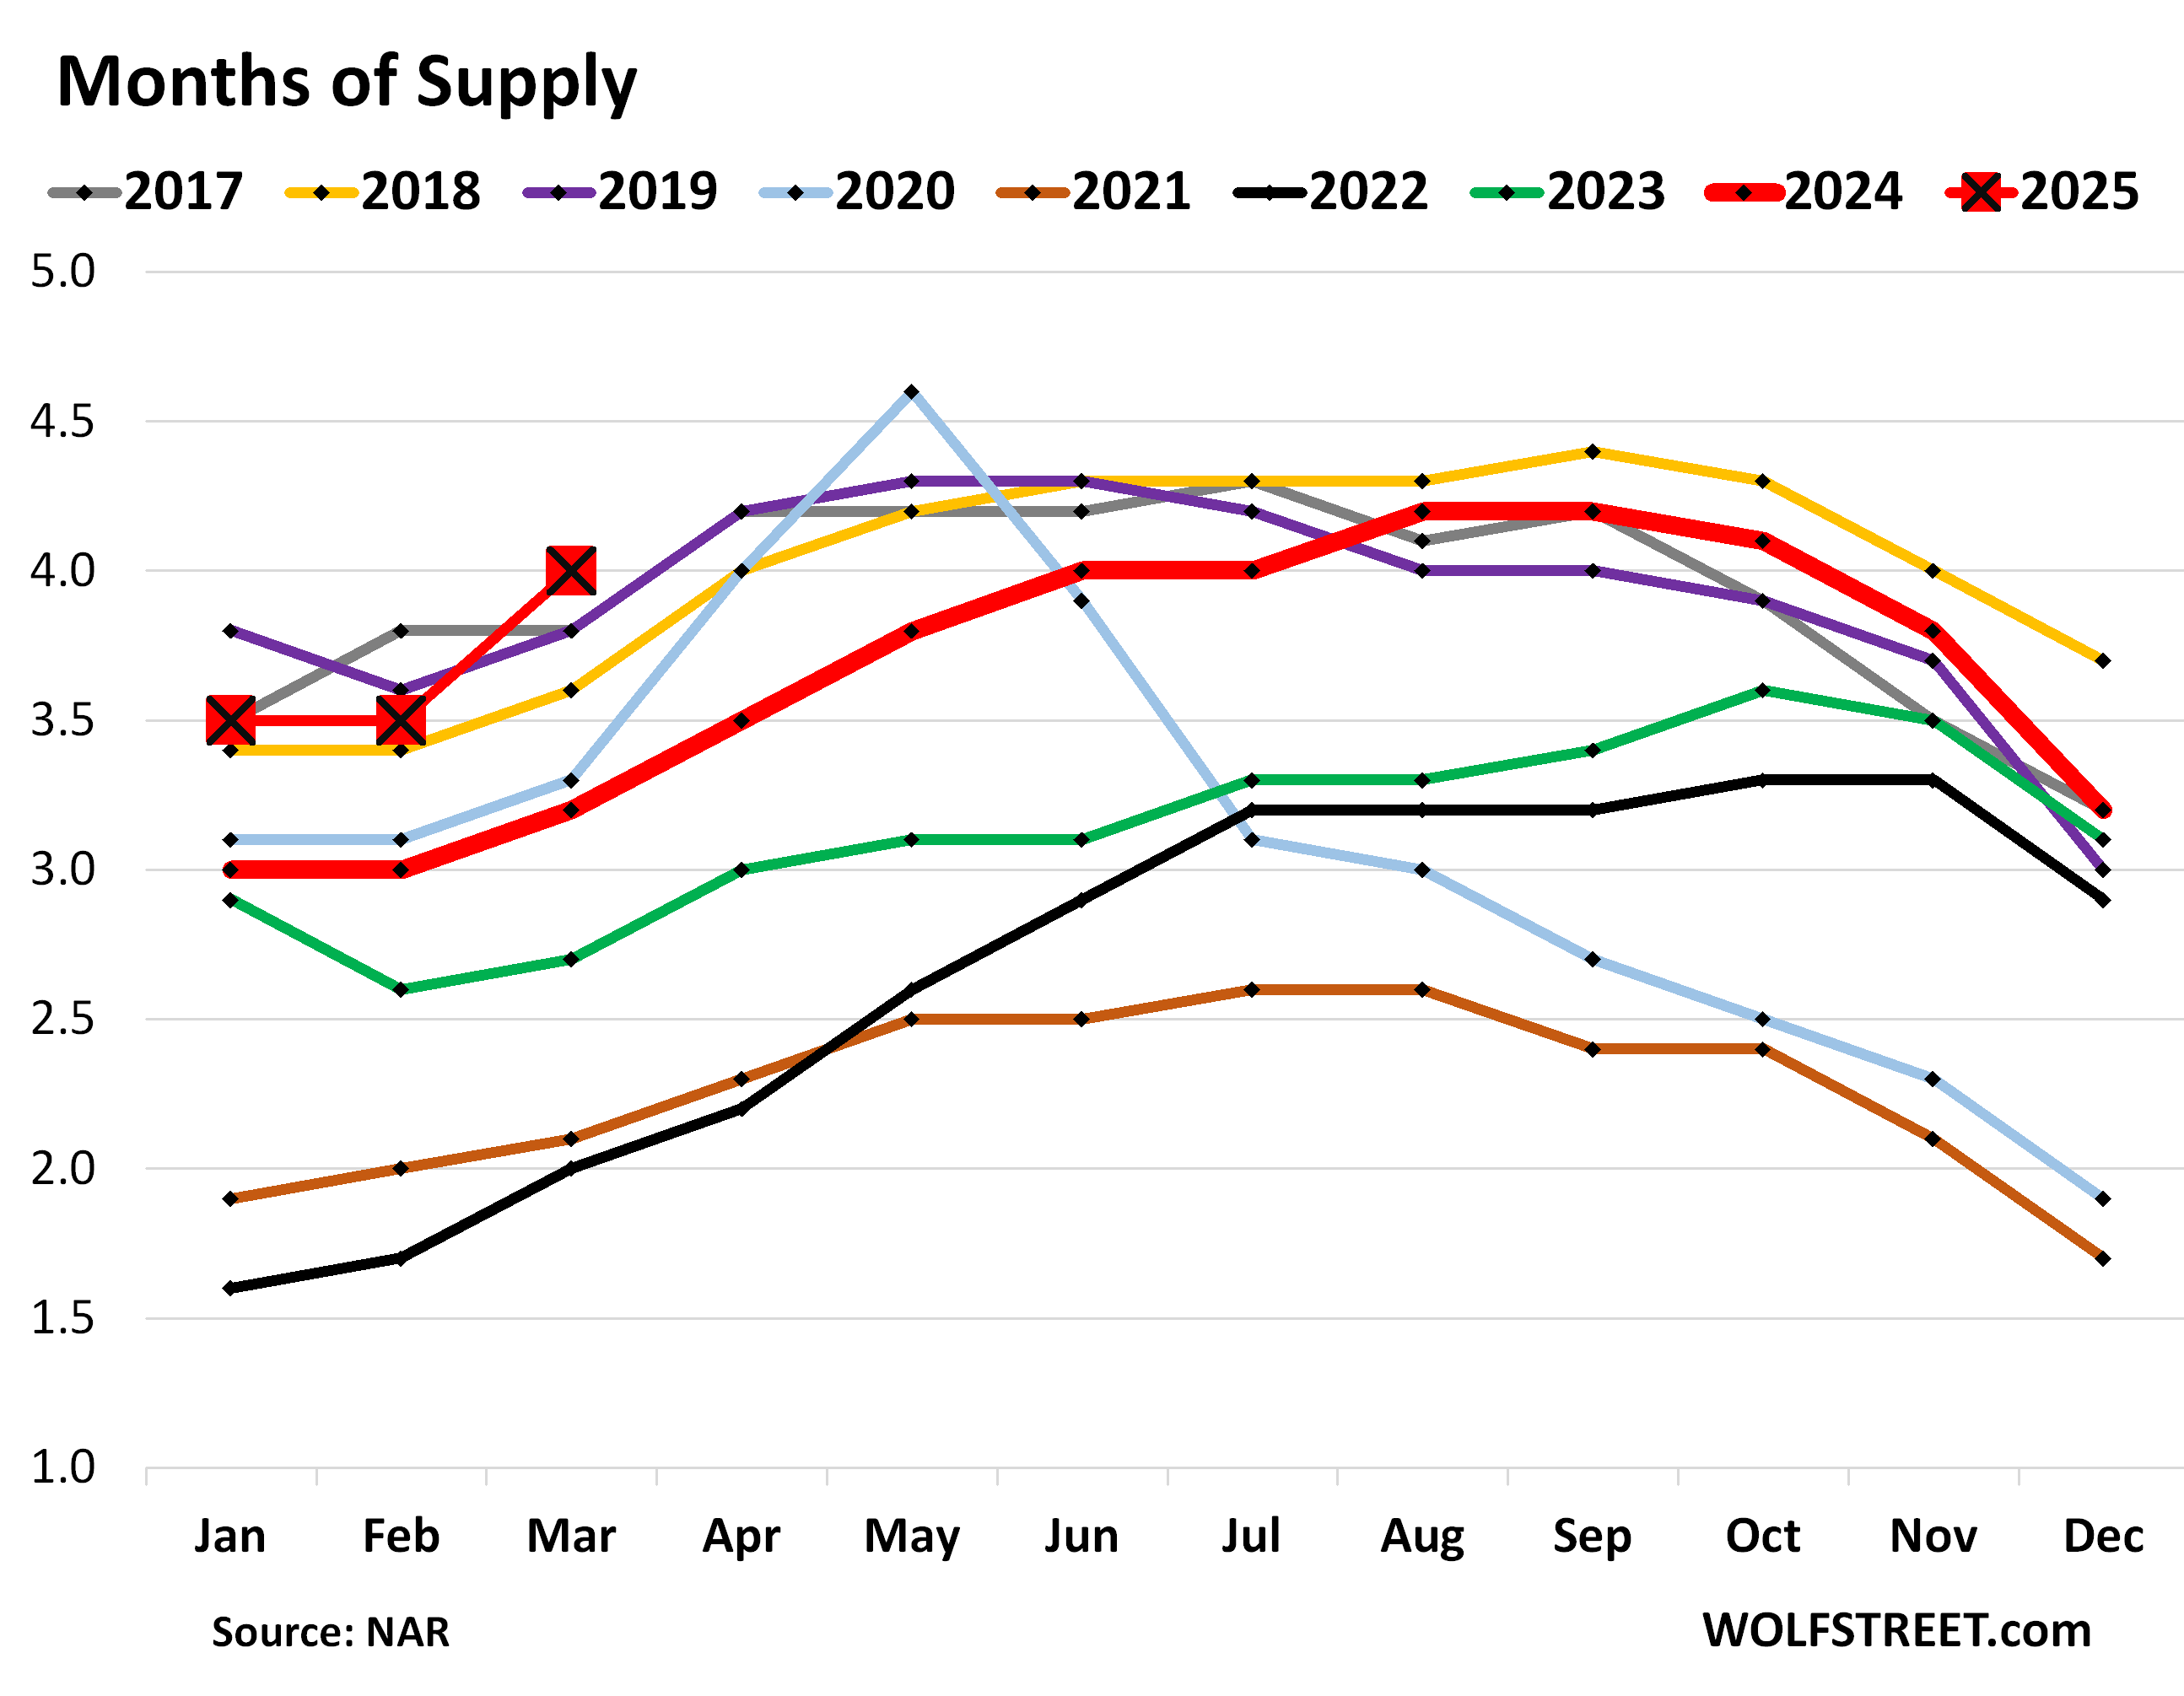
Highest supply for March since 2016.
Inventory of homes listed for sale jumped by 100,000 homes, or by 8.1%, in March from February, and by 20% year-over-year, to 1.33 million listings. This increase in inventory occurred even as buyers were on strike because prices are too high.
Supply of unsold homes on the market, amid these inventory levels and demand destruction, jumped to 4.0 months at the March rate of sales, the highest supply for any March since 2016. The months of 2025 are shown as the red squares:
Demand destruction by region.
The charts below show the seasonally adjusted annual rate of sales (SAAR) in the four Census Regions of the US. A map of the four regions is in the comments below the article.
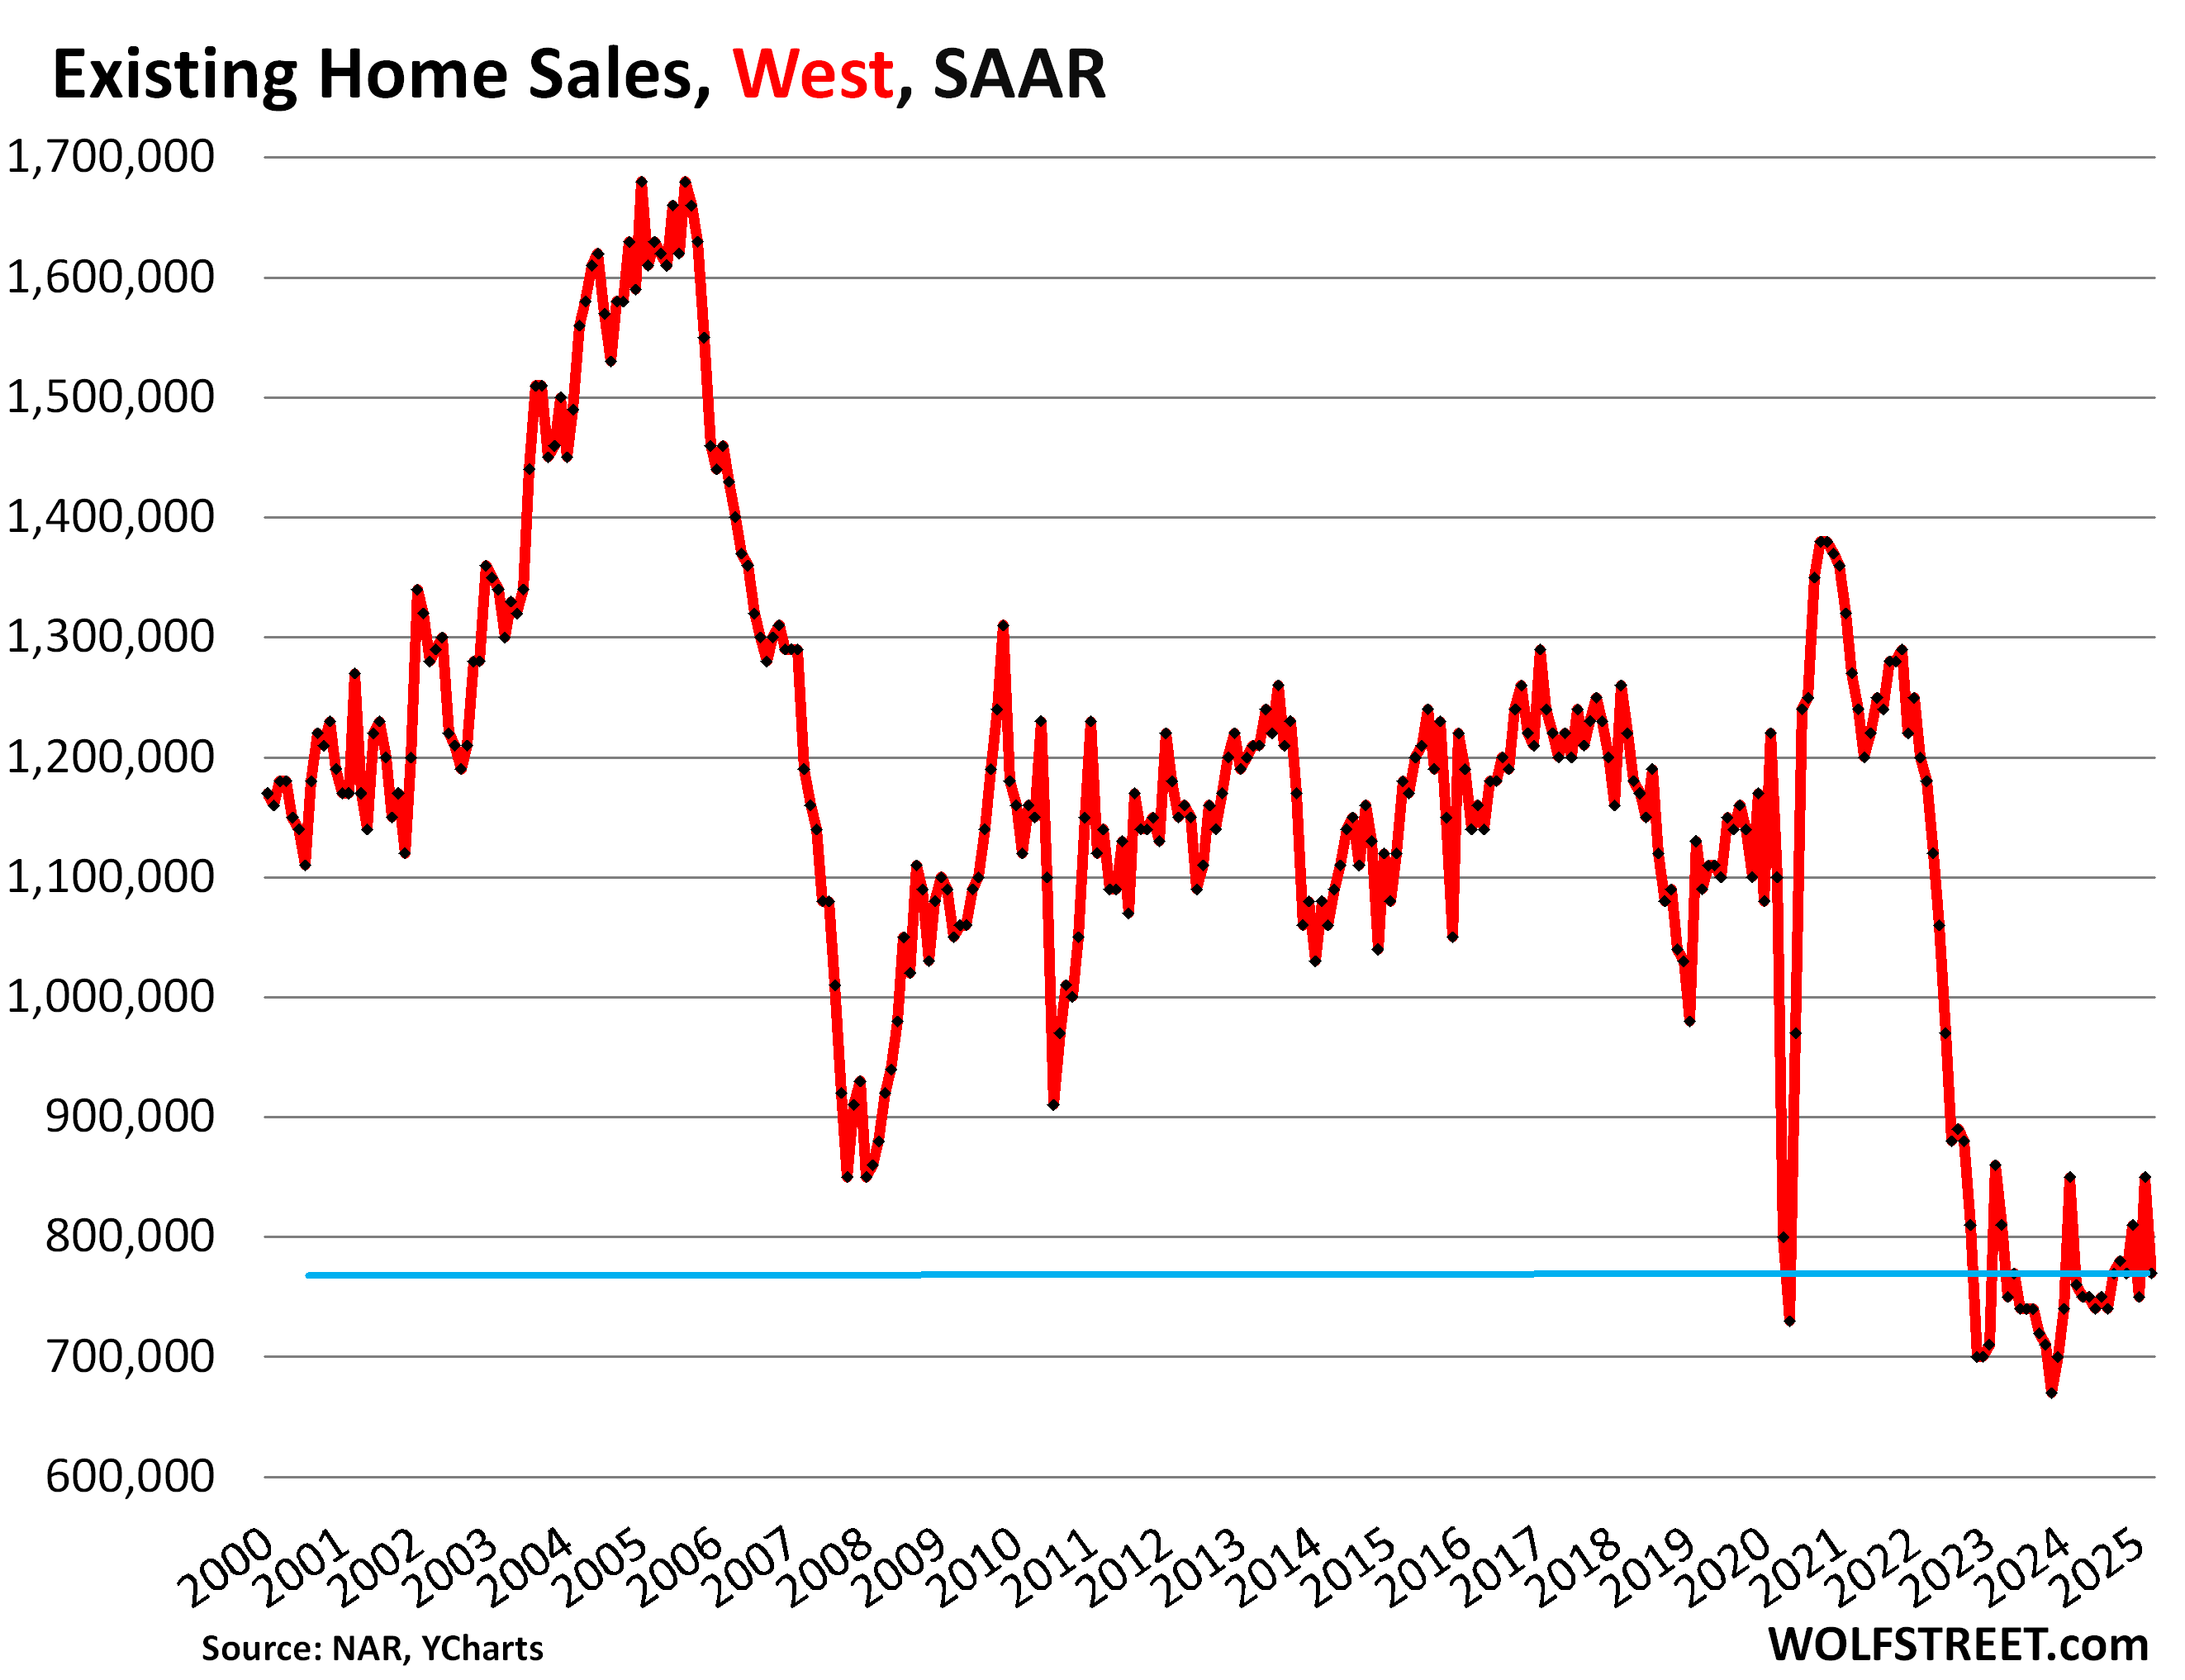
In the West, the seasonally adjusted annual rate of sales fell to 770,000 homes in March from 850,000 in February. But that was still up by 1.3% from the abysmal sales in March last year, and both were the worst Marches in the data going back to the 1990s. Compared to prior years:
| West, compared to March: | |
| 2024 | 1.3% |
| 2023 | -4.9% |
| 2022 | -34.7% |
| 2019 | -29.4% |
| 2018 | -36.9% |
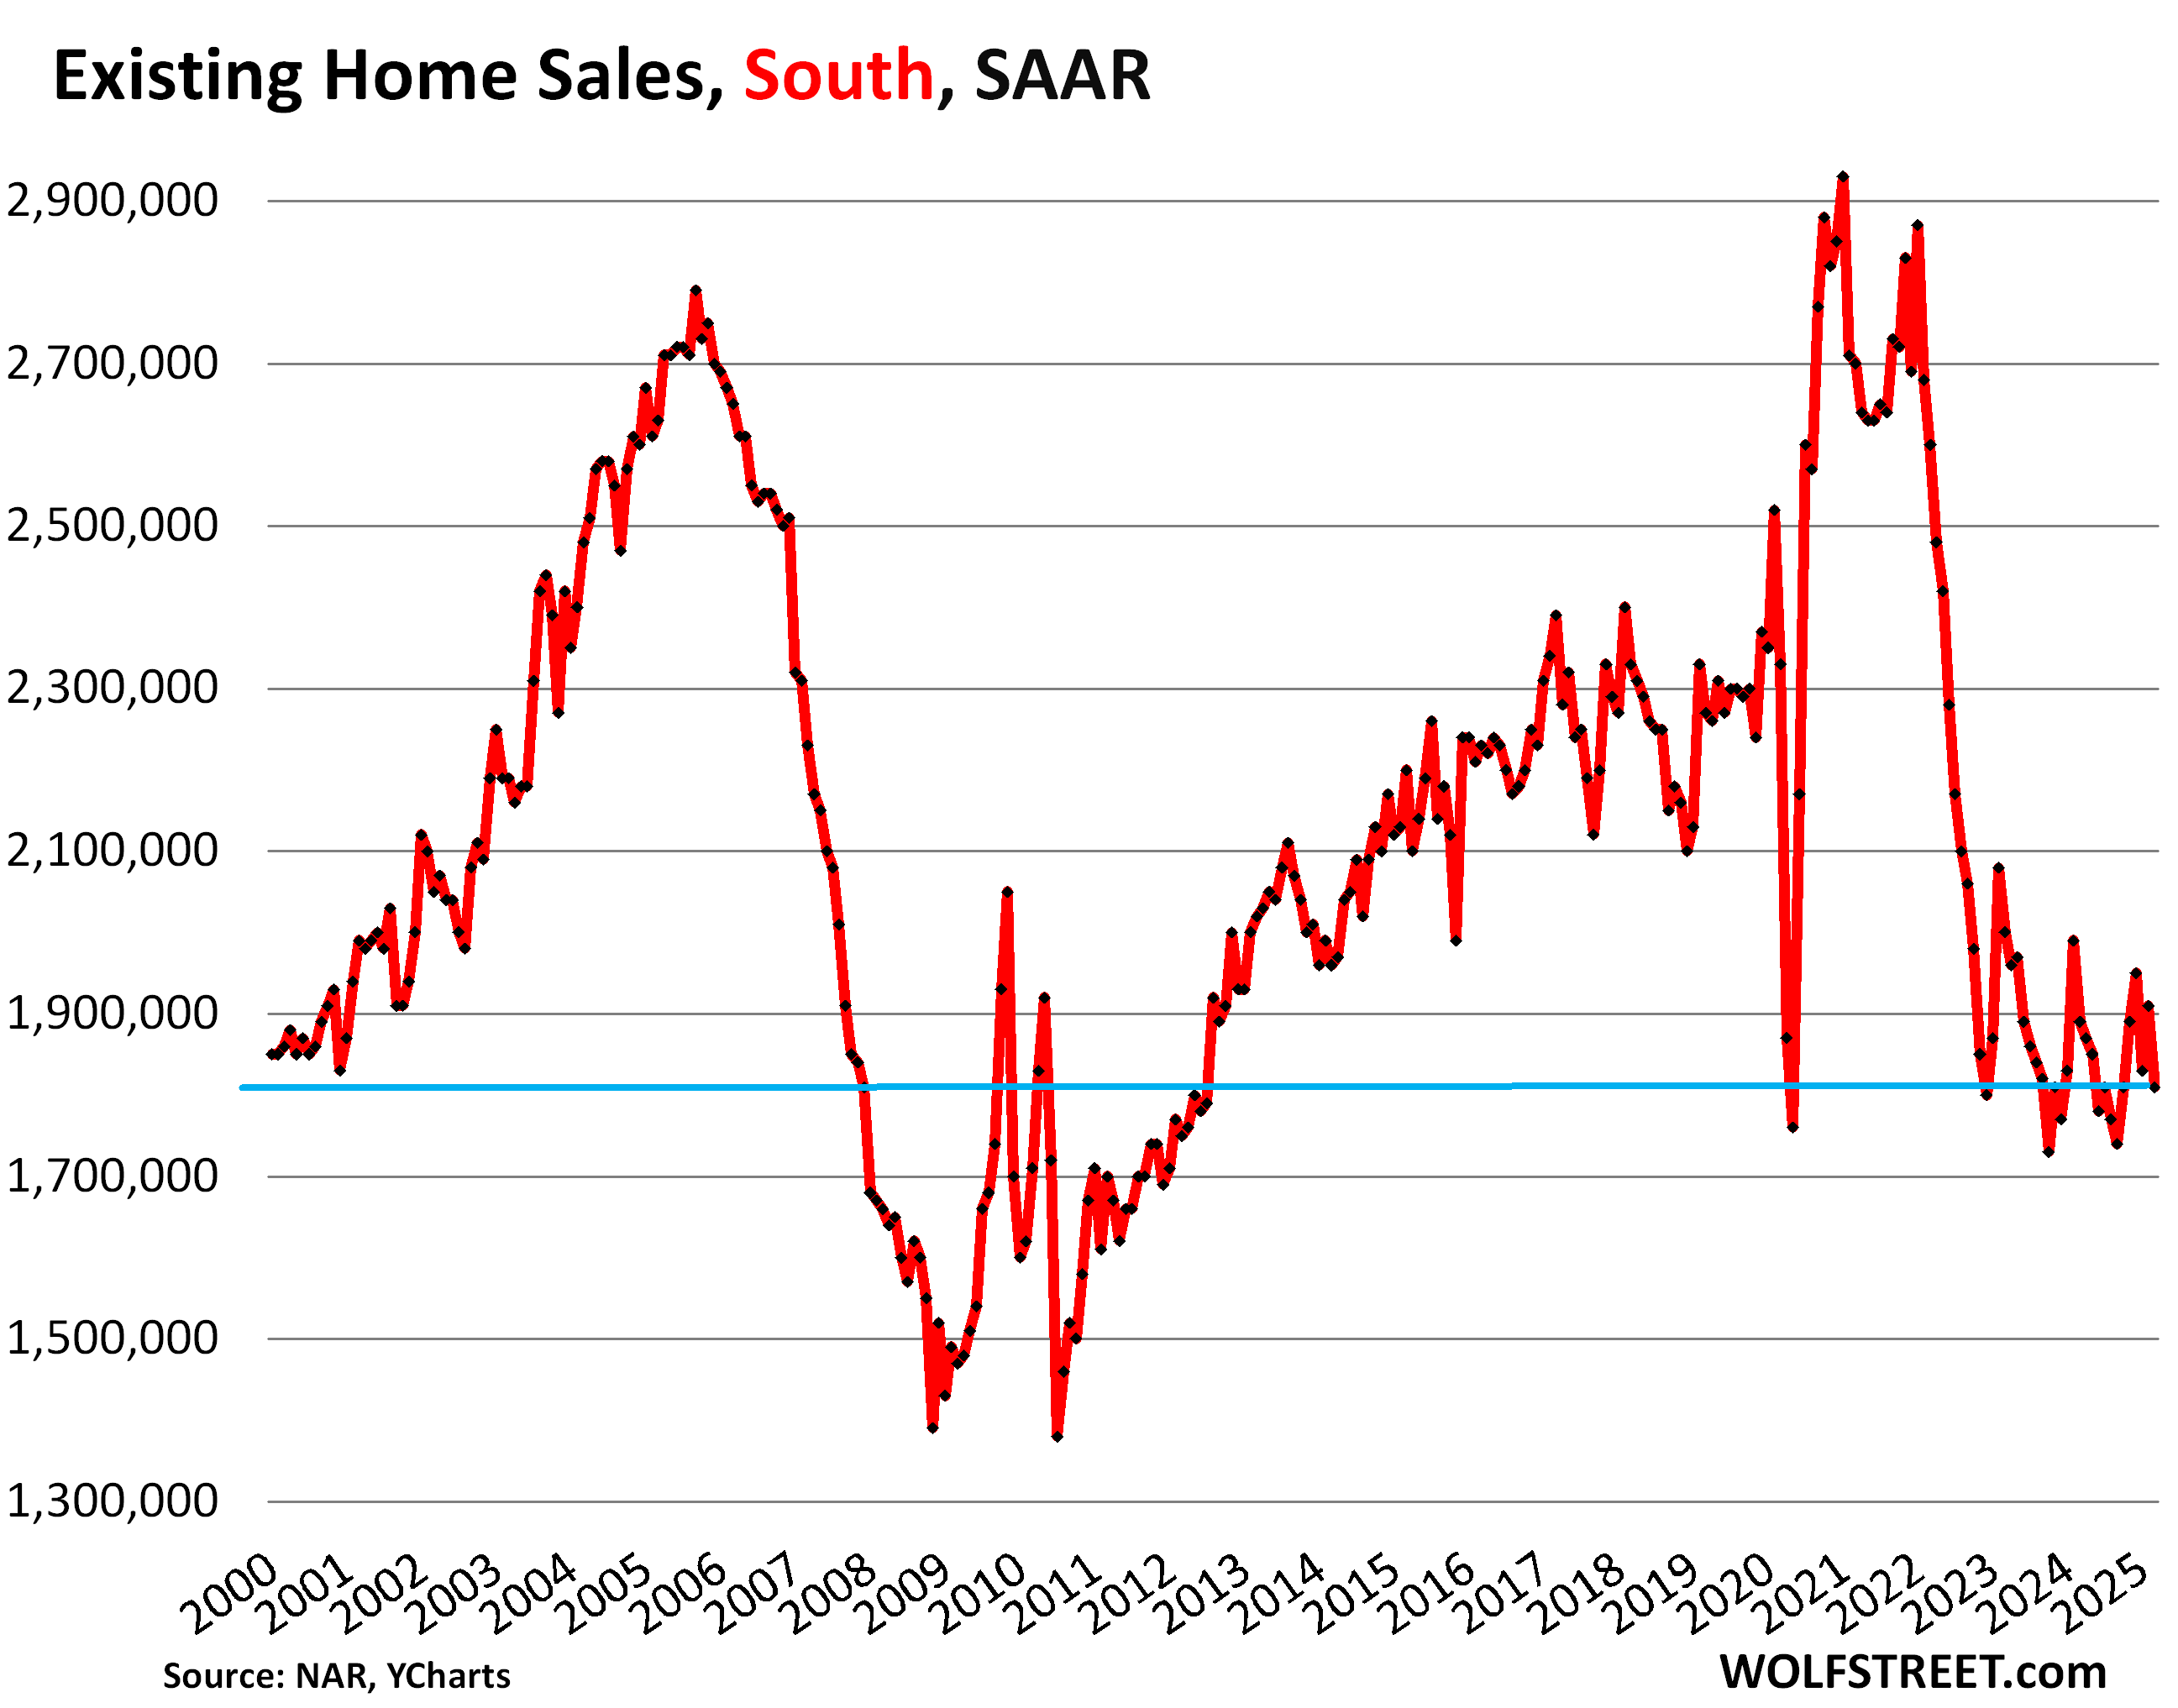
In the South, the seasonally adjusted annual rate of sales fell to 1.81 million in March, from 1.91 million in February, the worst March since 2012. Compared to prior years:
| South, compared to March: | |
| 2024 | -4.2% |
| 2023 | -9.5% |
| 2022 | -30.4% |
| 2019 | -20.3% |
| 2018 | -22.3% |
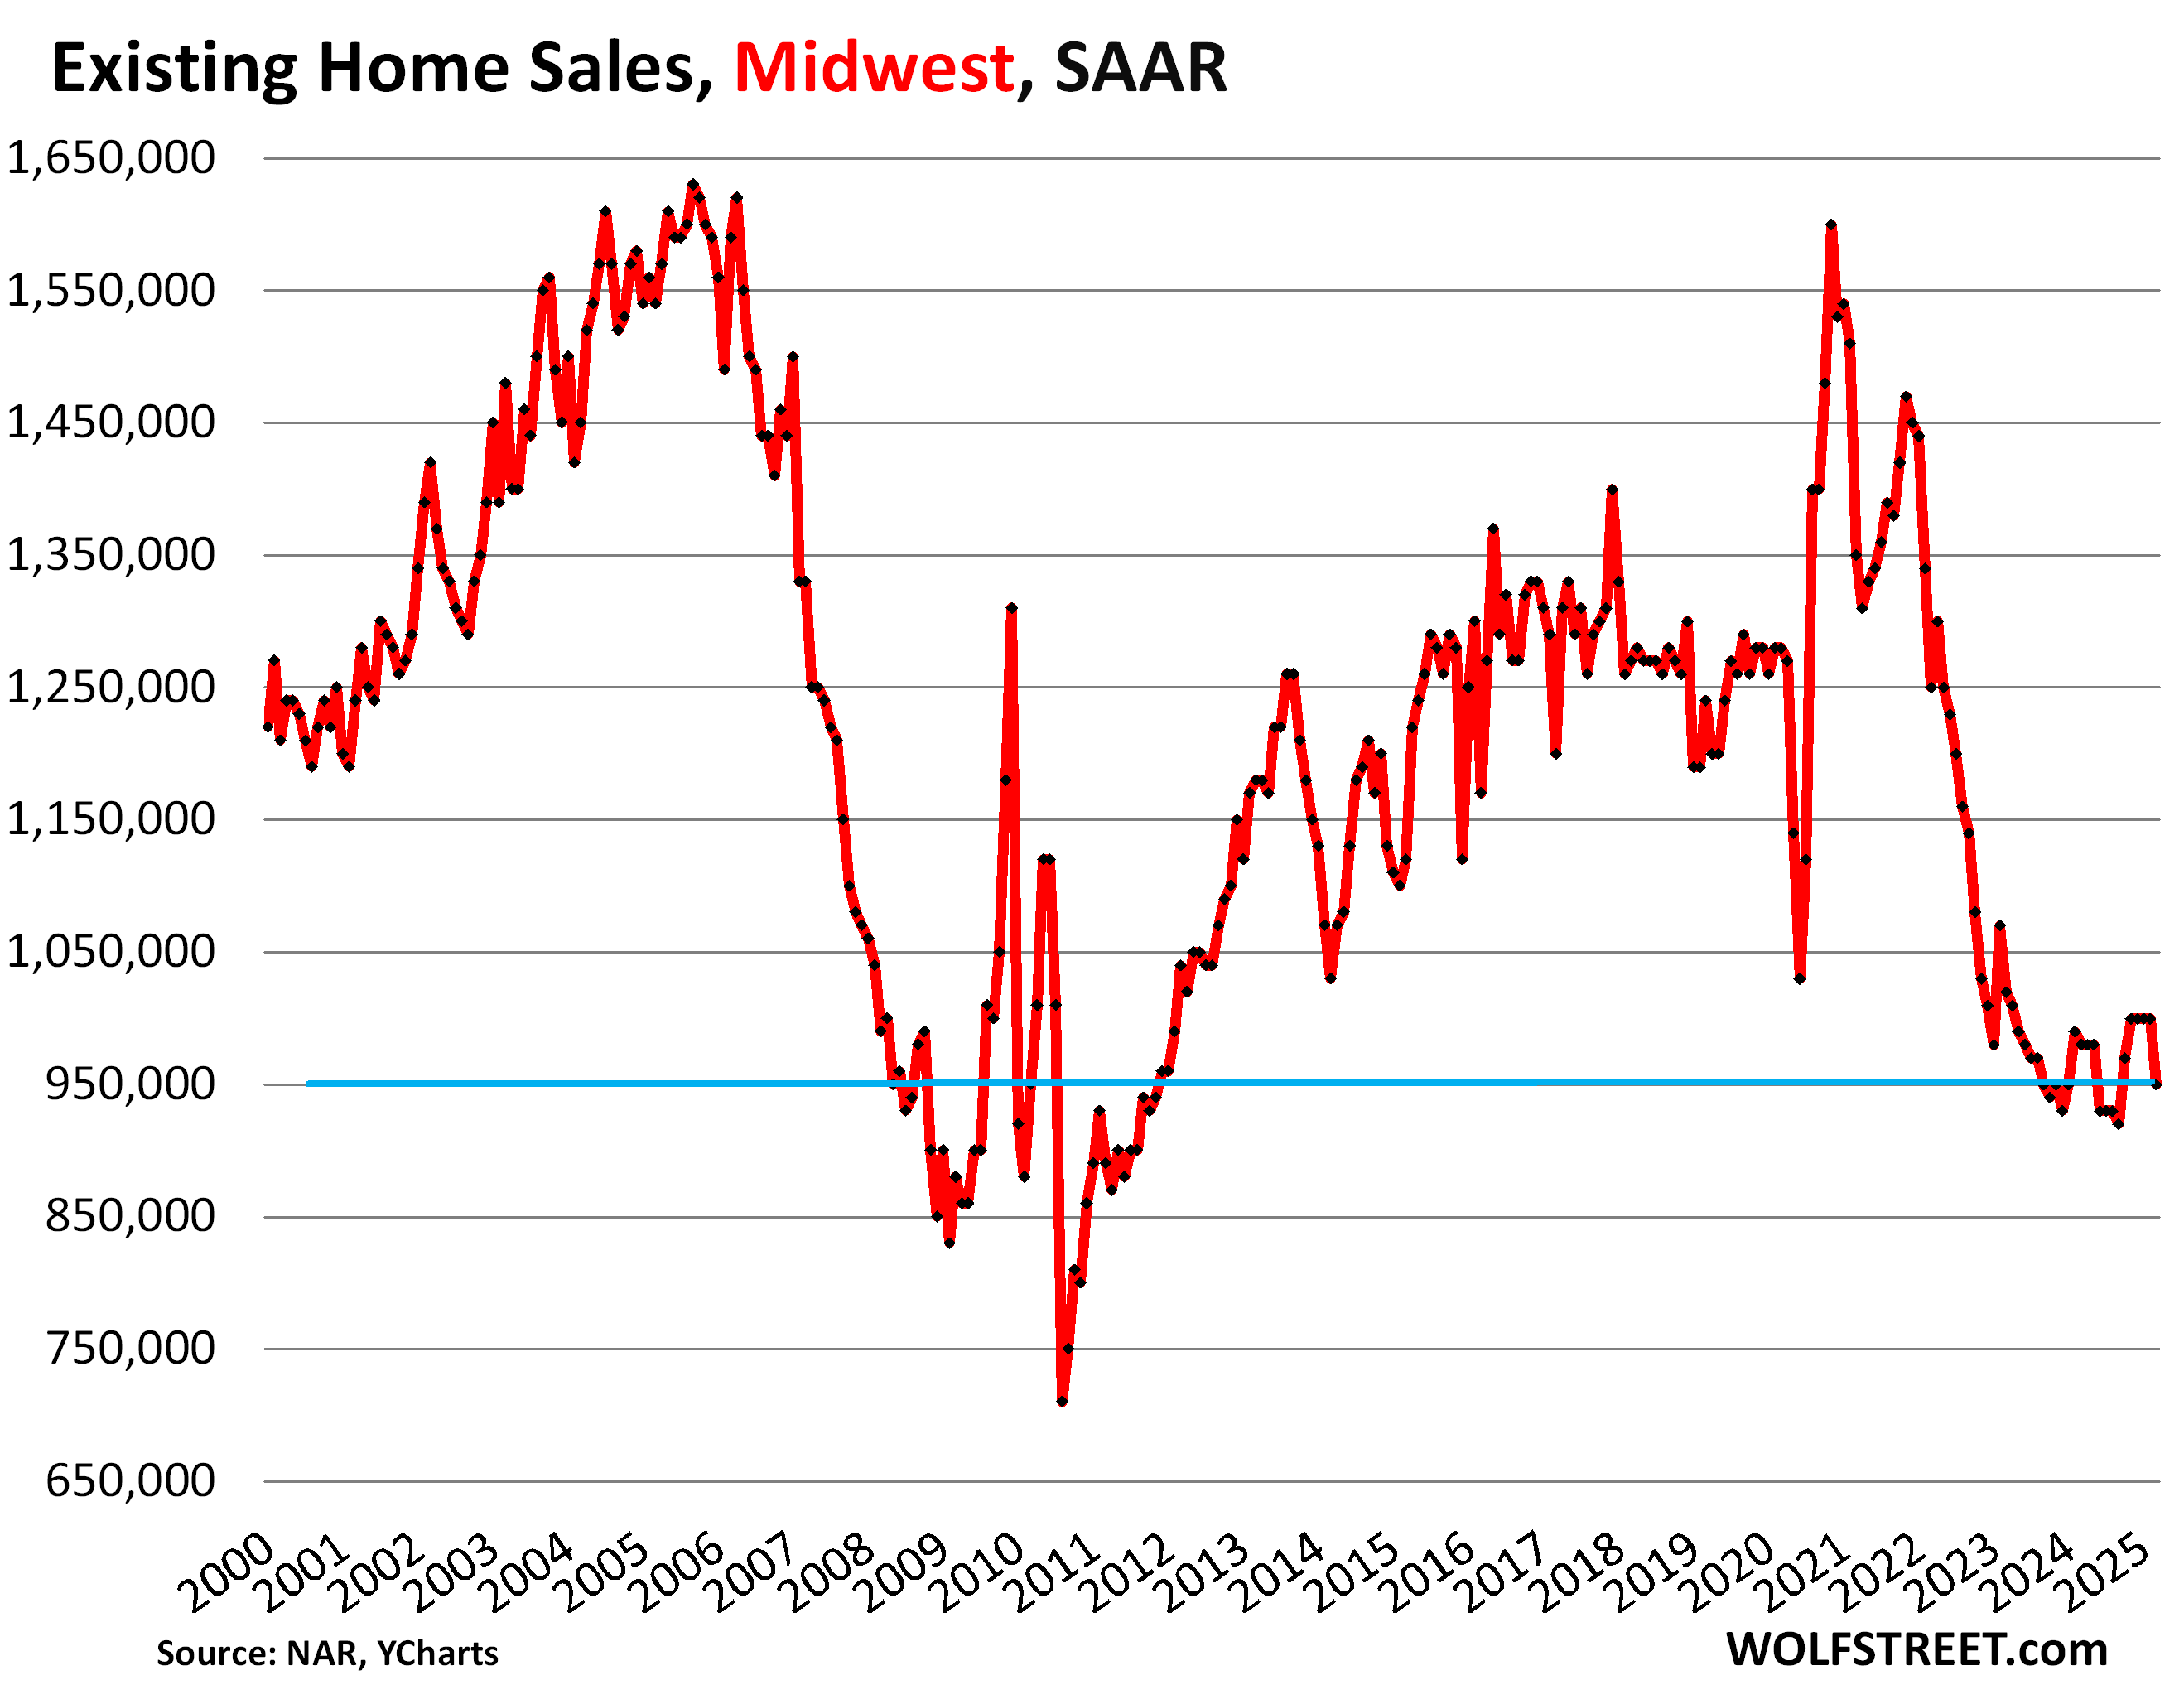
In the Midwest, the seasonally adjusted annual rate of sales fell to 950,000 in March, from 1.0 million homes in February, the worst March since 2011. Compared to prior years:
| Midwest, compared to March: | |
| 2024 | -3.1% |
| 2023 | -6.9% |
| 2022 | -24.0% |
| 2019 | -23.4% |
| 2018 | -25.2% |
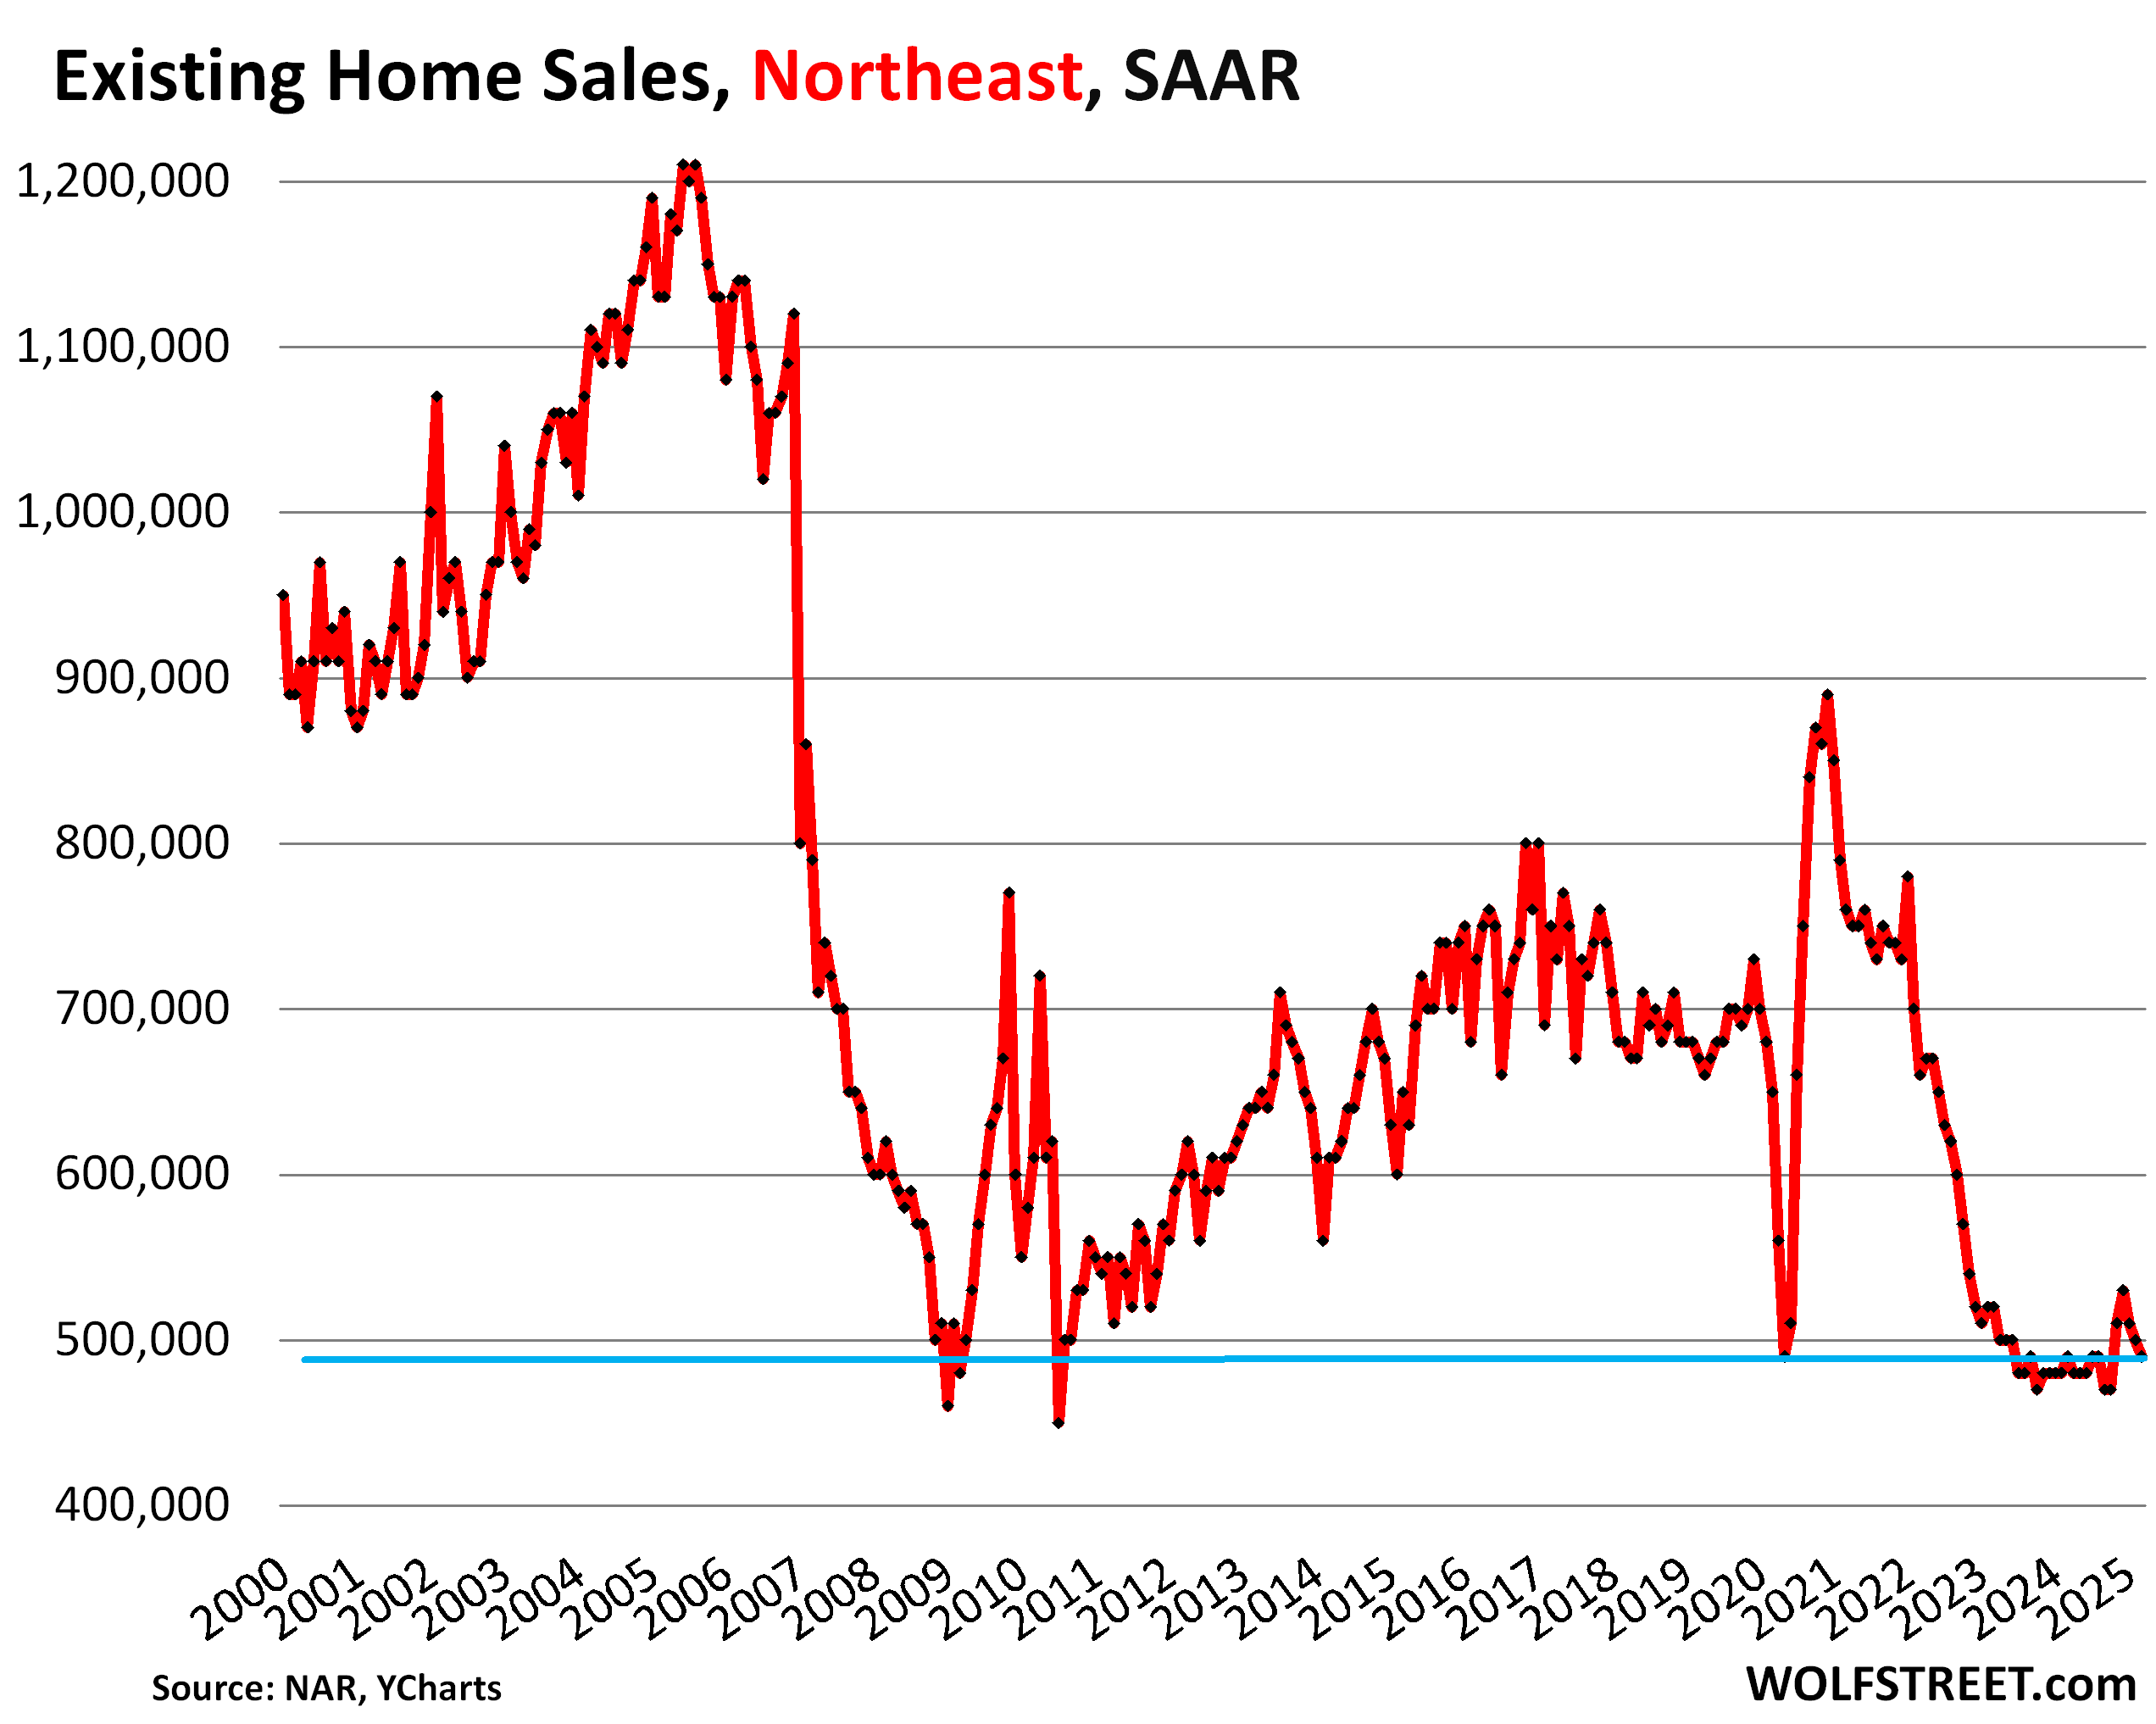
In the Northeast, the seasonally adjusted annual rate of sales fell to 490,000 homes in March, from 500,000 in February, and was the same as the abysmal March 2024 sales rate, and both were the worst Marches since 2009. Compared to prior years:
| Northeast, compared to March: | |
| 2024 | 0.0% |
| 2023 | -5.8% |
| 2022 | -25.8% |
| 2019 | -26.9% |
| 2018 | -27.9% |
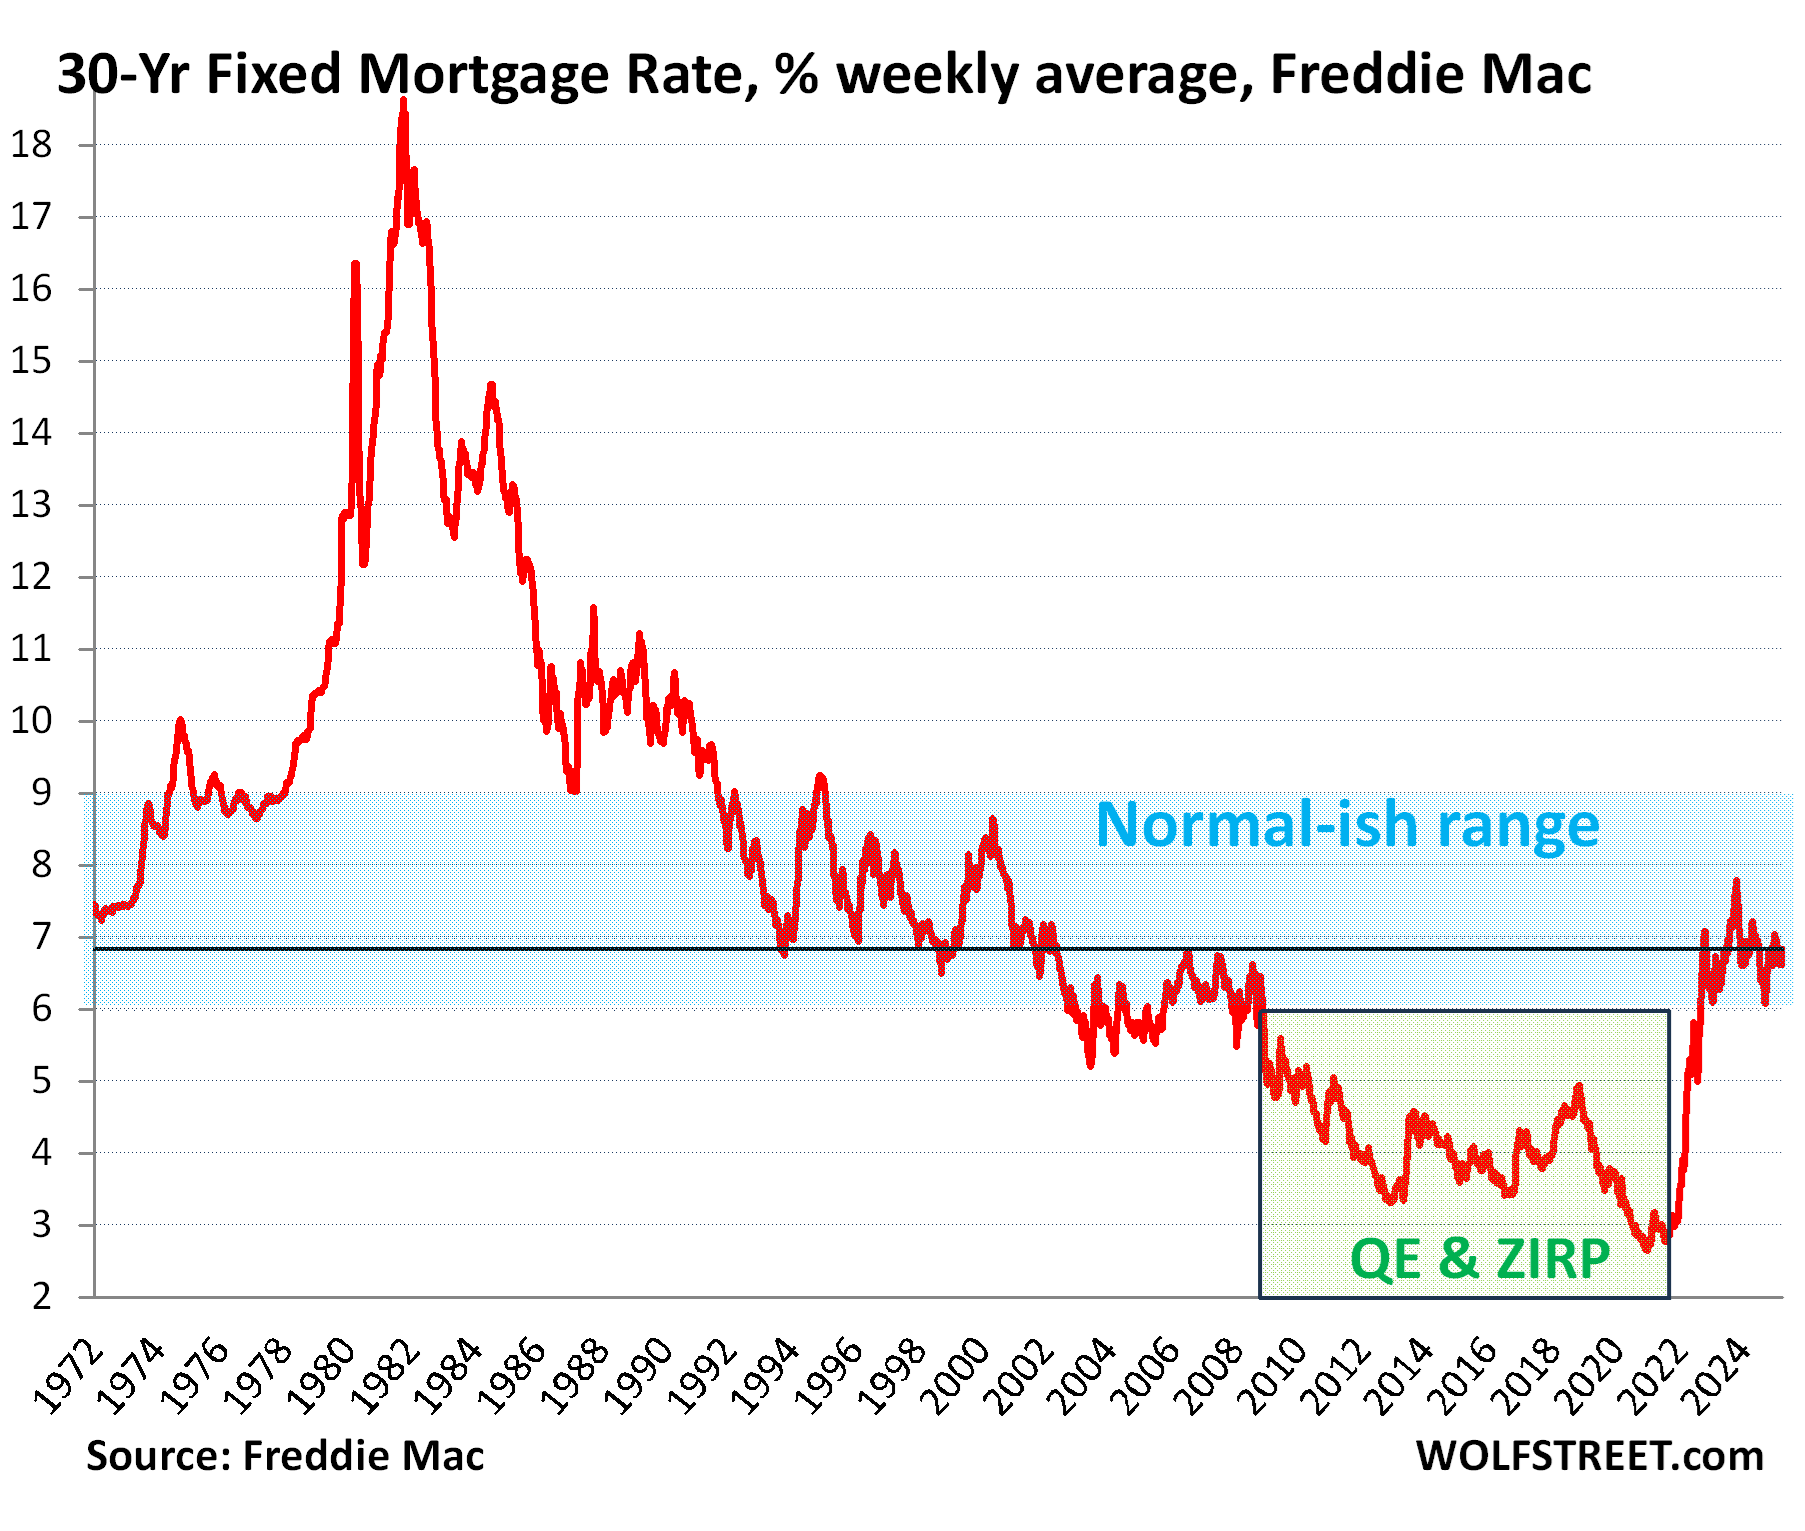
But mortgage rates are in the historically normal-ish range.
While home prices that spiked by 50% triggered this massive demand destruction, mortgage rates have returned to the historically normal-ish range that prevailed in the decades before the Fed commenced its interest-rate-repression schemes in 2008, via its 0% interest rate policy (ZIRP) and two massive waves of QE, including the purchases of trillions of dollars of mortgage-backed securities.
Before this interest rate repression began in 2008, mortgage rates were always above 5%, and with the exception of the first three years (2003-2005) of Housing Bubble 1, above 6%, and much of the time above 7% and 8%.
But QT shaved $2.24 trillion off the Fed’s balance sheet so far, and the Fed keeps shedding its MBS holdings, and the spread between the 10-year Treasury yield and 30-year mortgage rates has widened to reflect that, and mortgage rates have remained near 7%, on either side of it.
The entire housing industry obviously loves ridiculously inflated prices and hates historically normal mortgage rates, and so it condemns the historically normal mortgage rates and praises the ridiculously high prices, which the NAR did today again.
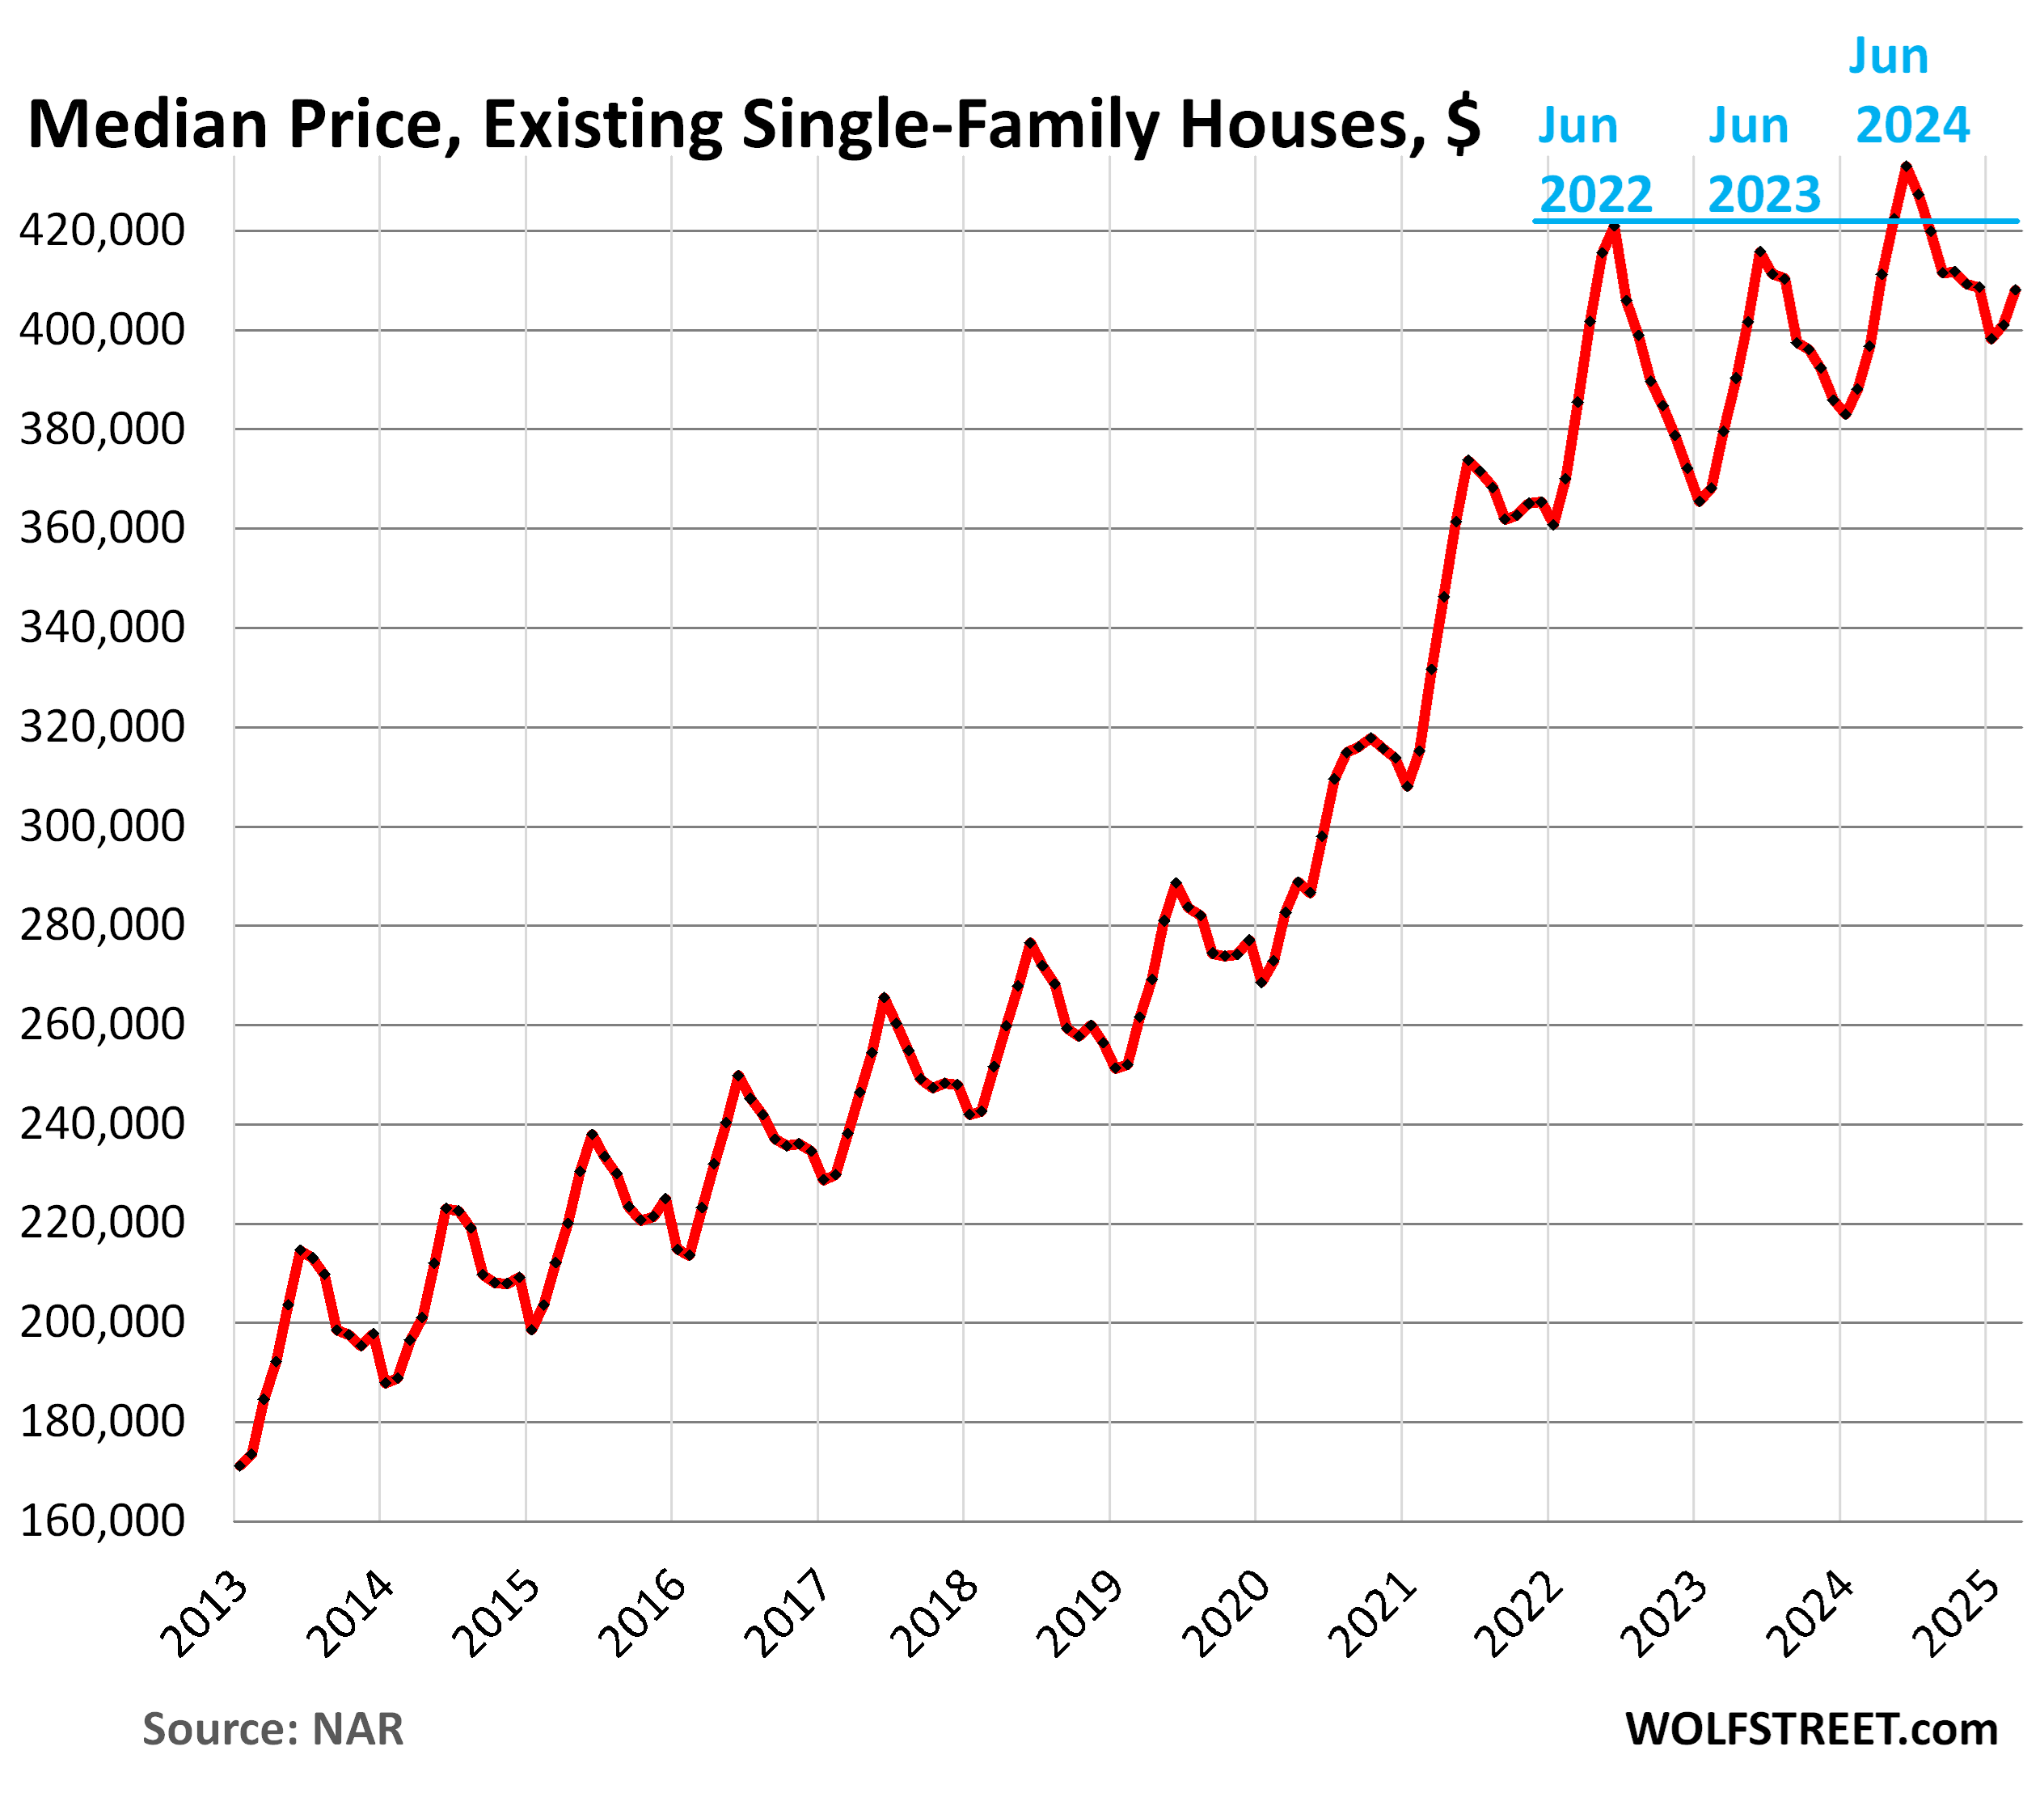
Median price for single-family houses and condos.
The median price is heavily skewed by changes in the mix of homes that sold. In the spring, nationally, more higher-end homes come on the market and sell, which changes the mix of what sold and skews the median price higher. It does the reverse in the fall and winter and skews the median price lower. These seasonal ups and downs in median prices are at least in part due to this shift in the mix.
Single-family houses: The national median price rose to $408,000 in March, from $400,900 in February.
This month-to-month gain of $7,100 was smaller than the gain in March last year, and so the year-over-year gain narrowed further to +2.9%, with year-over-year gains having now narrowed for the third month in a row (from +5.3% in December).
The 50% price explosion over the three years between June 2019 and June 2022, on top of the large price gains in the prior 10 years, was driven by the Fed’s interest-rate repression and money-printing schemes which have created the #1 problem in the housing market today, and it has destroyed demand: Prices are simply way too high, don’t make economic sense, and are not economically sustainable. Textbook demand destruction is the result.
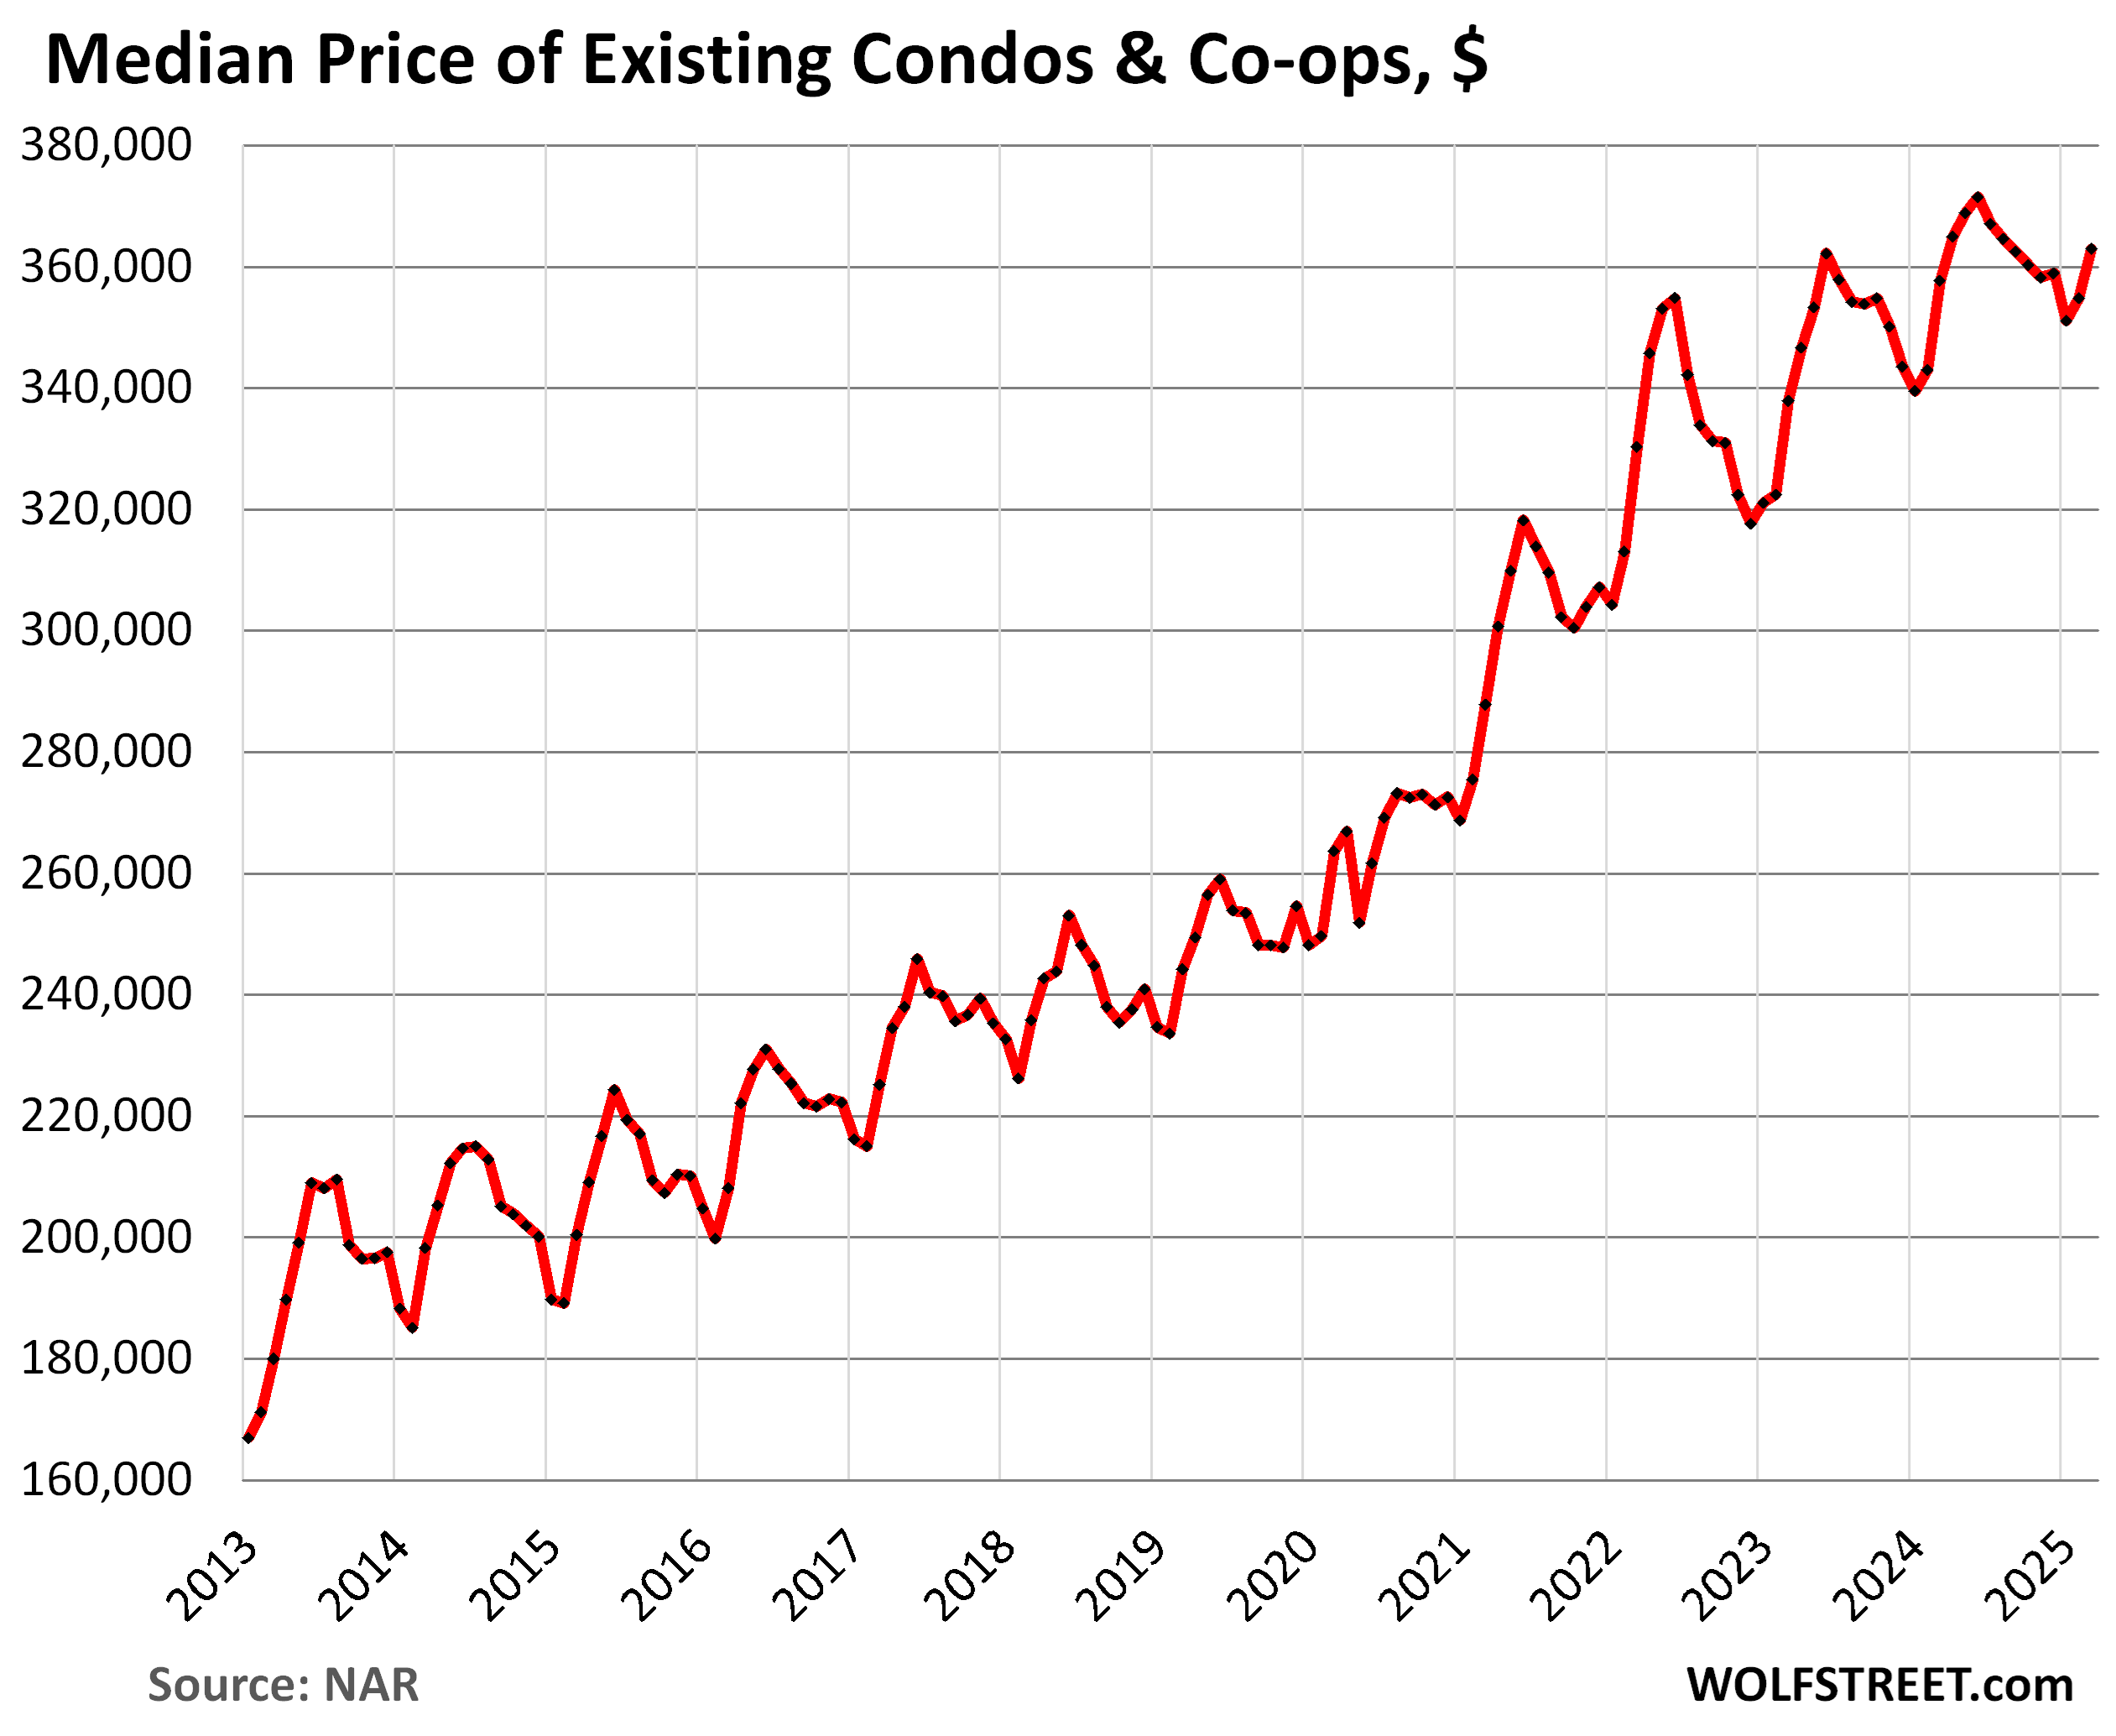
Condos and co-ops. The national median price rose to $363,000 in March, from $354,800 in February.
The month-to-month gain of $8,200 was far smaller (by almost half) than the gain in March last year, which slashed the year-over-year gain to just 1.5%, from 3.4% in February, the third month in a row of narrowing year-over-year gains (from +4.5% in December).
But every market dances to its own drummer. I track home prices (single-family and condos combined) in the largest most expensive 33 markets, in my long-running series, The Most Splendid Housing Bubbles in America, March 2025: The Price Drops & Gains in 33 of the Largest Housing Markets. In quite a few of them, prices have dropped substantially from their peaks in mid-2022.
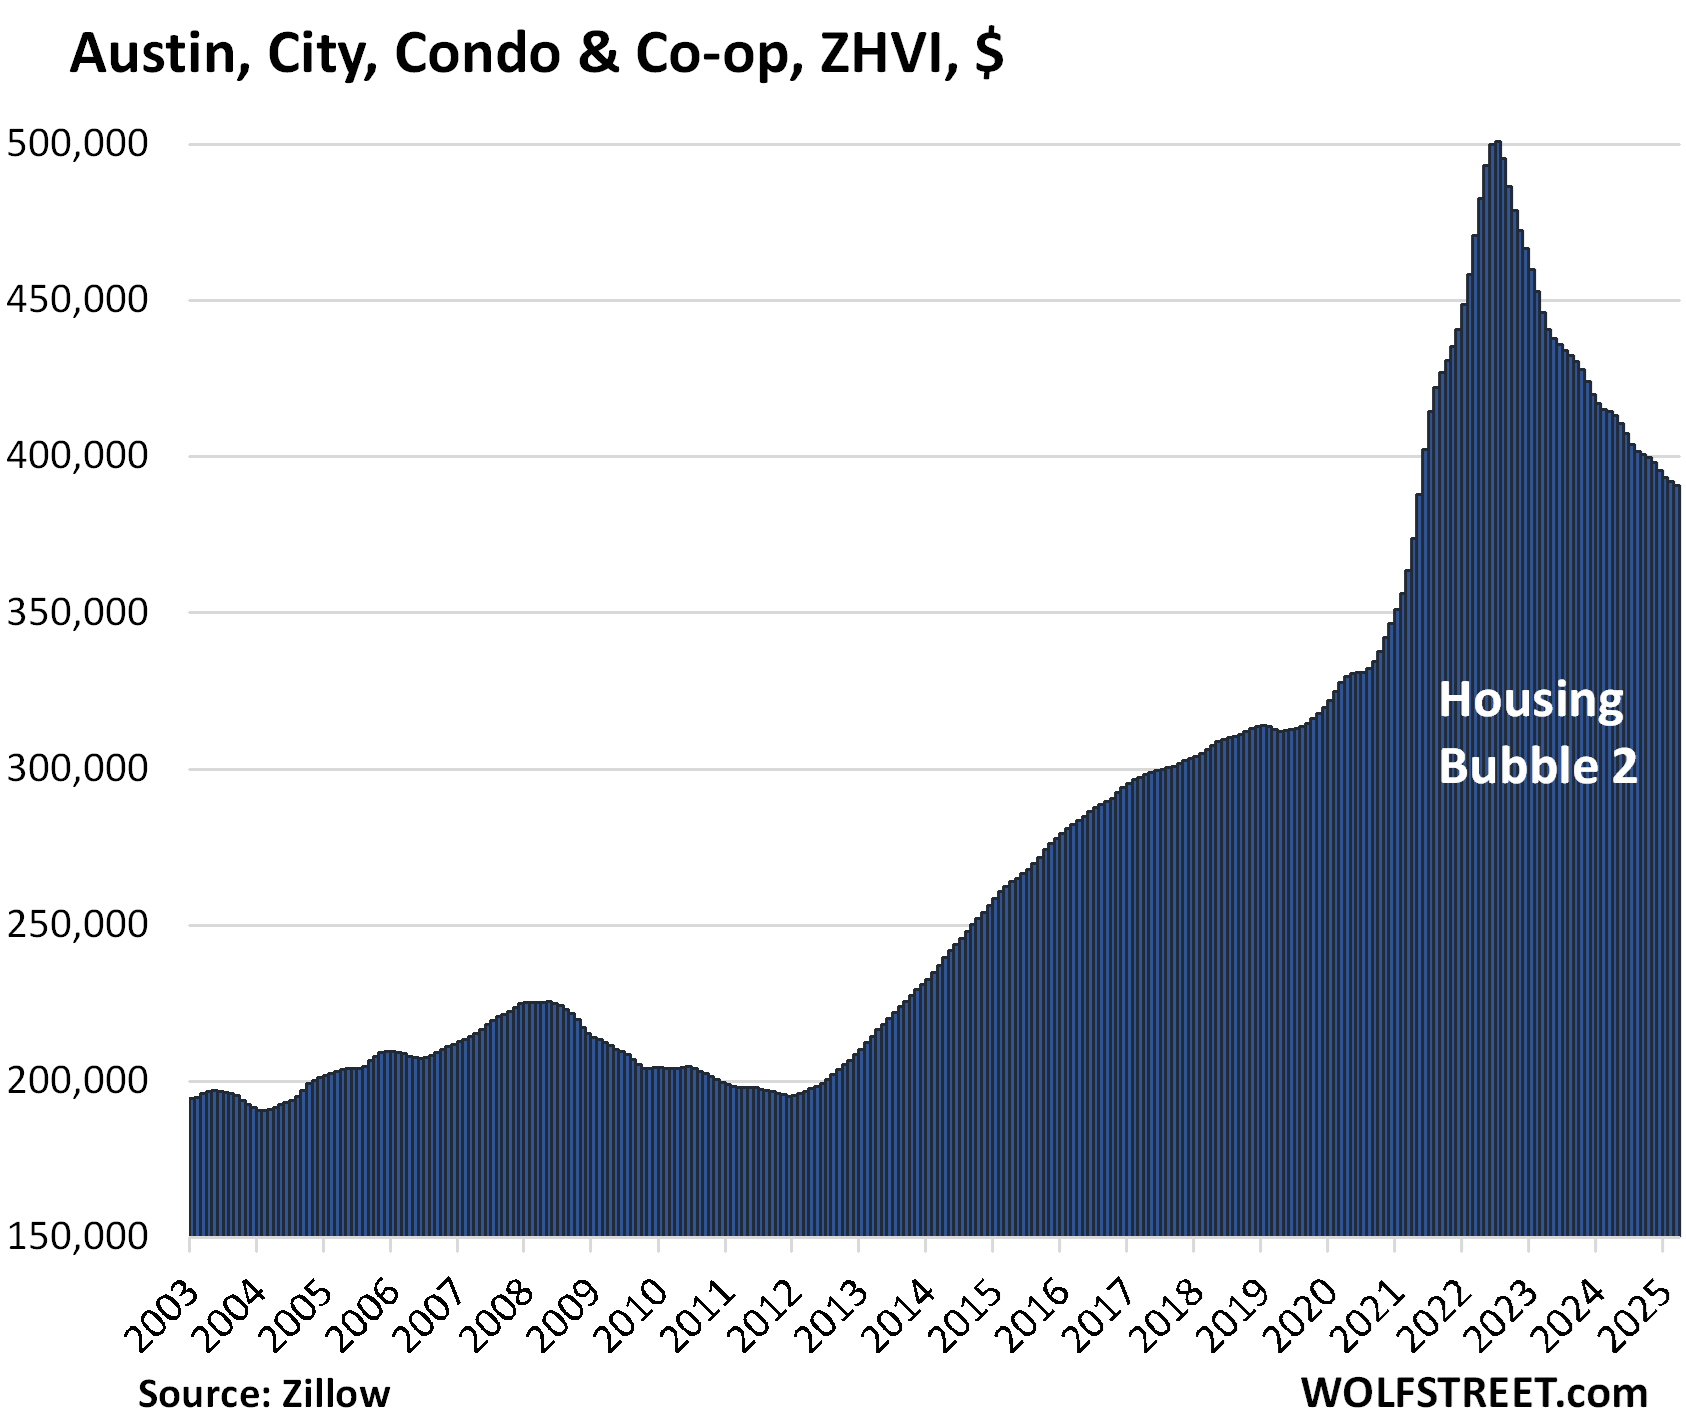
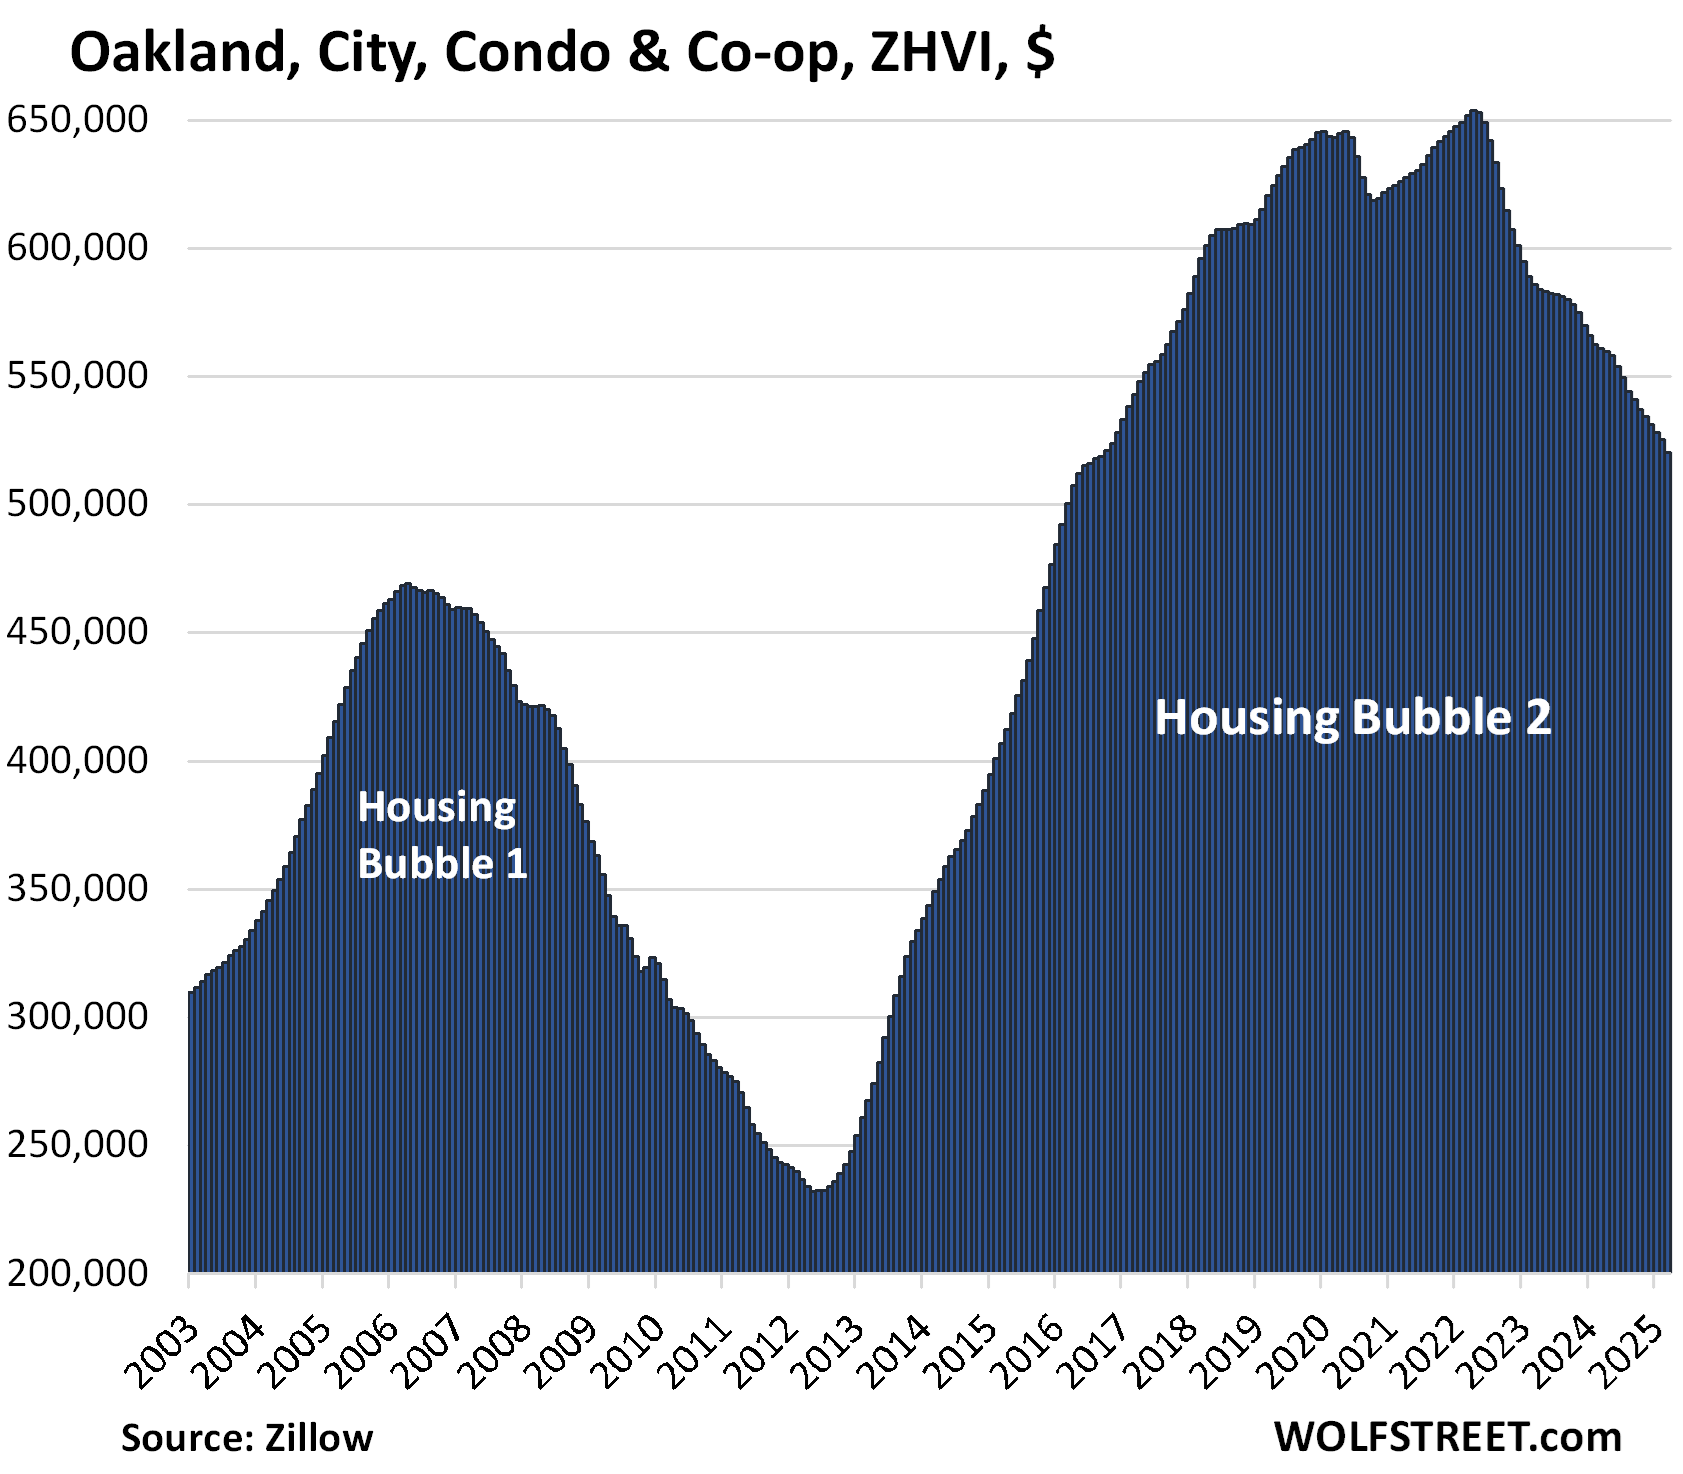
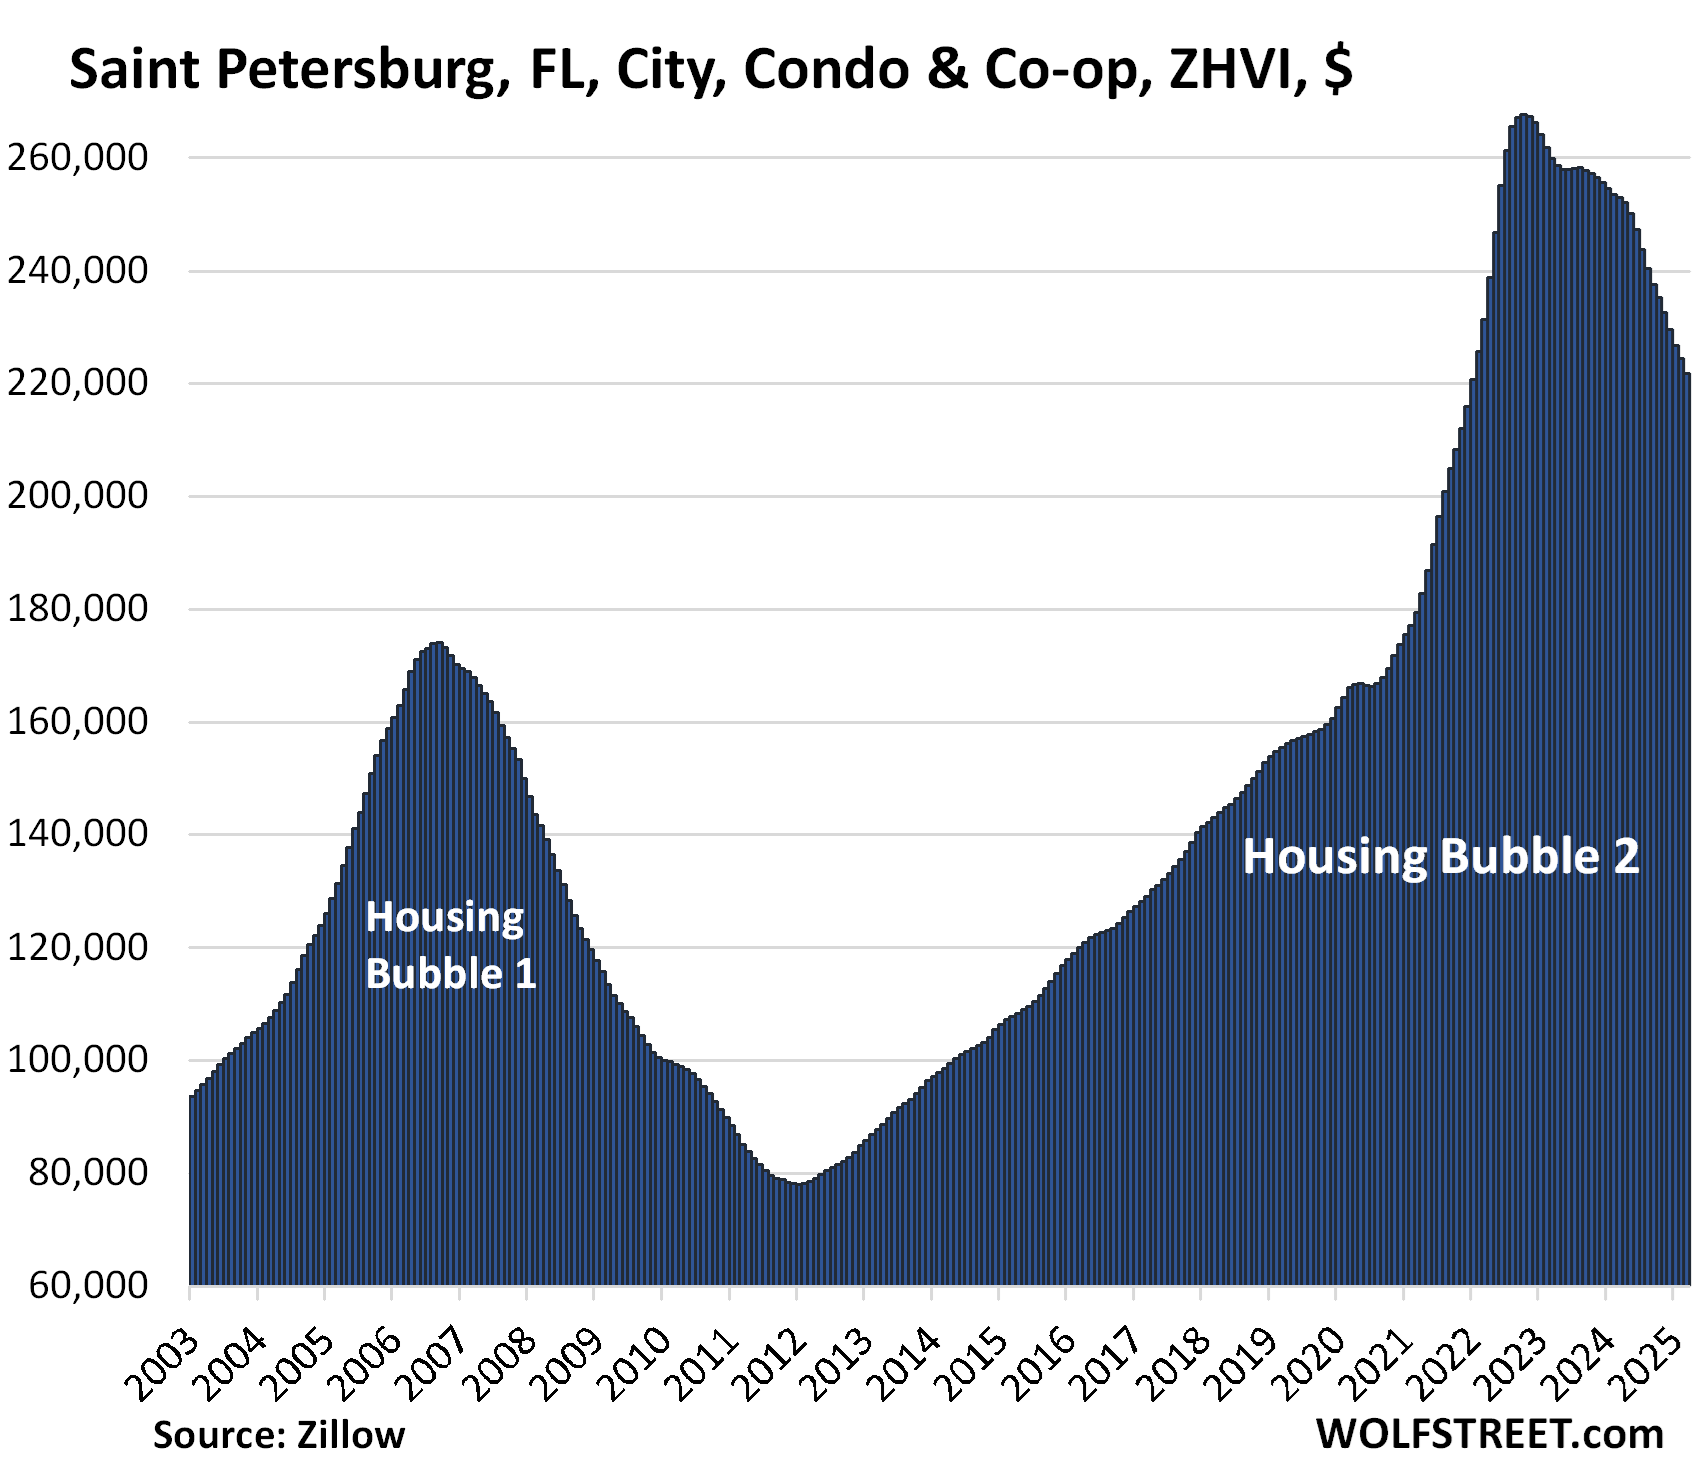
But condos are on the forefront, on the way up, and on the way down, and price drops in many cities have been substantial: In 15 Bigger Cities, Condo Prices Already -10% to -22%, 5 Are in Florida with Accelerating Drops. Absurdity Comes Unglued. Here are four of the 15:
Condo prices in Austin, TX: -22% from peak in July 2022:
Condo prices in Oakland, CA: -20% from peak in May 2022:
Condo prices in St. Petersburg, FL: -17% from peak in Oct 2022:
Enjoy reading WOLF STREET and want to support it? You can donate. I appreciate it immensely. Click on the mug to find out how:

![]()
The promised map of the four Census regions of the US:
Excellent comparative showing the differentials in the areas shown.
Have been looking in the West and the South with the South at the best pricing but it is the South…. Idaho was preferred but the 20 acres I could’ve bought in 2018 at 80K for 20 areas near Canadian border is now around 350 to 400K.
The California ADU laws (SB9) have made it so I can subdivide my property and still build another home (without a garage due to SB9) as I am on private road on a corner lot allowing for plenty of parking.
Group of Chinese doctors bought a large English Tudor across from me and have made little money with the last expense being a 100K Septic replacement. It has been ok as the people stay inside the compound but they are just getting a tax write-off for now.
Other neighbor moved his technology business to the property and build more housing for large family. So, cheap corporate rent with all his family working at the home he and his wife live in. All good, great people, and sign of the times as many families are moving into together even in these million dollar homes in my neighborhood.
Harcourt Auctions website in Laguna Beach shows only 25 homes for sale in CA as compared to 2 -3 years ago with much more inventory.
Property maintenance costs money. Ownership is more expensive than renting. The young people looking too buy but can’t afford it have again been to bear the burden. In addition to their student debt, loss of constitutional rights, meager, uncertain wages, etc.
All’s I can say is, if half the bullshit you slung was true, you must have a large income, yearning to be waylaid paying off the loans on underwater assets.
Housing crash? Can we now say, “I told you so”?
Has Mr. Helicopter money lost all of his credibility yet?
Is it safe to call most of wall Street investors as dangerous lunatics?
Honestly, my job offers me a 401k. Problem is; BlackRock runs the 401k. I took a hard pass on it.
I don’t think Larry Fink or anyone on wall street is looking at market fundamentals…. ever.
Don’t worry about a recession. Yellen said we will never see a recession again in our lifetime.
She did say that. Maybe Biden told her to say that.
I have lost faith in our political & financial system. I’m not alone in this.
Good lordy. What a pile of BS. I’ll just blow one of your items to smithereens. Won’t waste my time on the rest.
“Yellen said we will never see a recession again in our lifetime. She did say that. Maybe Biden told her to say that.”
That’s a Double Lie.
1. Lie: No, that’s not what Yellen said. NOT AT ALL. She did NOT say “recession,” she said “financial crisis.” Huge difference. If you don’t know the difference, don’t comment here.
Here is what she actually said: “Would I say there will never, ever be another financial crisis? … Probably that would be going too far. But I do think we’re much safer, and I hope that it will not be in our lifetimes, and I don’t believe it will be.”
2. Lie: Not, it’s not “Biden” who told her to say that because she said that in June 2017, when TRUMP was president.
It’s amazing to me how you could twist your stupid lie into an idiotic politicized lie to fit your narrative.
Last time I seen a beating like that someone put a banana down My pants and released a monkey.
I don’t like Blackrock either but some 401ks have a money market fund option or a stable value fund option or something close to those, meaning you don’t have to buy overpriced stonks, and the employer often will match around 3% of your contributions, which can add up over time to thousands of dollars. Also you can put $7,000 per year in a Roth or pre tax IRA and you aren’t limited with options, can invest in treasury bills, TIPS, brokered CDs, etc.
Is this balanced by population?
Great to see West is trending down…just need the west of west special bubble SoCal to follow the same pattern as general west to trend down and continue to trend down for a while because the way things are existing sellers still out to lunch with price and completely miss the memo…many still think if they hold on just a little longer, they will either rescue by rate decrease, any round of FOMO ramp up or some other BS reasons they gaslight themselves into believing..
Really sick of seeing any crapshack setting floor of $1M as some magical minimum asking price regardless of the area, house condition, size..
If you look at the inventory number or for sale in Irvine, LA, San Diego, etc it’s crazy. It’s almost like every other house is for sale. It reminds me of late 2007
With those overly inflated prices out there (I’m in Texas), it’s no wonder people are trying to cash out. I said trying….
i posted in the other thread, the paradox that if everyone tries to “cash out,” then the inventory is no longer “low” and they won’t be able to cash out.
Phoenix_Ikki,
With the LA Olympics a few years out and likely billions needing to be spent to get ready should be interesting. One has to assume lots of homeless shelters will be built or remarket homes people as “living with nature”. Unlikely any of the housing market mess will sort itself out by then as even if rate cuts there is no guarantee mortgage rates will move in same direction.
I’m with you, but on the other hand I don’t blame the sellers for holding on. I mean, JPow is the weakest, most sensitive central banker in history; he’s like two, maybe three mean tweets away from completely folding and loading up the QE cannon? 😂
Good comment because I agree with your premise. If I disagreed with it I wouldn’t be so gracious.
” trend down and continue to trend down for a while because the way things are existing sellers still out to lunch with price”
Well put.
I’m not so sure it will trend, gently down. I think that the US economy was already in a prelude period to recession when the Trump administration disrupted the chronic trade arrangements.
Also, IMO, there is at a minimum a high wave of inflation about too hit us as the Asian supply lines are terminated.
Is there a way to correlate time from downturn in sales to price correction and overlay with current conditions? I vaguely remember that some markets pulled back quickly so there were abundant deals in 2008/2009 but in others sellers held out hope and prices bottomed in 2011-12
As I said in the other thread, nothing is going to stop the tidal wave of supply coming, with or without foreclosures. 1 year from now, supply is going to be ALOT higher nationally than right now. ALOT higher.
A paltry 20% decrease in price is not going to fix this issue. Not with the cost of home ownership skyrocketing like maintaining or repairs needed, home owners insurance skyrocketing, and mortgage rates likely headed higher if not much higher from here.
There is serious pain coming to the price of homes. And people will be forced to sell at much, much lower prices in time. Divorce, death, job relocation, or simple cost to maintain, people will be forced to sell.
Yep, the youtuber Orlando Miner does a lot of videos on airbnbs failing along with hoa fees and housing payments in general skyrocketing. Everyone nowadays has to emote on tiktok about it apparently which is odd to me but nevertheless is quite revealing.
And there has to be a lot of leverage out there that is going to get absolutely destroyed, like private equity and pensions.
Every moron thinks their 50+ year old shack is worth a million and is probably driving a 70K truck because of that.
hopefully the private equity funds and pensions get bailed out by congress and the fed. there’s no reason they should have to take any losses.
to paraphrase leona helmsley, losses are for the little guy.
They’re maker heroes, not taker losers.
Really depends on when you bought. If you owned during the period to refinance to a sub 3% mortgage, you face much lower selling pressure than in normal times because your cost on that home is as free as financed housing ever gets.
So in the past we would see a lot of people sell, but instead some of those people will maintain ownership and rent the place out.
Rents can remain inflated because they are tied to perceptions of home values, and demand for rentals can stay elevated because house prices stay high.
The root of the problem is of course millions of people having 3% mortgages that will never increase.
rents are not tied to perceptions of home values. they’re tied to what people in the area can afford to pay. period.
I disagree Franz. Rising values equal rising taxes, insurance + other inflationary costs. This equates with landlords demanding higher rents just to cover expenses. In areas like Texas where expansion of inventory is easier to achieve, rents may rise slower, but in hard to expand areas like Cali, NYC and Hawaii, we see SFR turned into quasi apt buildings jammed with renters far in excess of what is comfortable, but necessary because wages can’t keep up with rent… so the solution is way more people living in the home and stupid rents.
waiono, if the people in the area don’t have the incomes, the landlord’s costs are irrelevant. that’s not to say that every renter is paying the maximum they can afford to, but a general rule of economics is that a purchaser of a product doesn’t care what your input costs are. that’s true whether it’s a rental apartment or a car.
@Waiono
Are you a landlord
I am.and don’t agree with you
Rents are decided by affordability not how much one has paid for .
In so cal for example one buy rent a home for 5k but if you buy it’s gonna cost you 12k per month .
The new landlords are losing money.
A 20% decrease would probably get the billionaires buying up the supply (again) in the places that are not in the constant disaster areas. Economies of scale when it comes to insurance and maintenance would help. It doesn’t matter if the rents keep rising way past affordability, that’s just incentive for more and more people to return to a multigenerational life in a (rented) house.
The US Gini index of the past 30 years will eventually lead to permanently lower homeownership rates.
Billionaire’s are not buying in Austin despite this being a hot job market hot housing markets and having already declined by 22 percent from peak
That is what I see also. A repeat of the collapse of the first Fed sponsored housing bubble in 2008 – 2025. This time we can dispense with the formalities, the US current and future tax payers are already on the hook for almost all mortgage contracts.
I mean what could go wrong ? IMO we are about to find out.
The problem was the huge spike up, not the correction in prices. Maybe bubbles popping is the only way for people to learn about restraint and risk and reckless govt meddling with housing if they don’t want to look at history which has shown this folly time and time again. A bubble and correction happened less than 20 years ago.
The canary in the coal mine(in my opinion) is replacement cost.
Labor and materials are still crazy high. We looked at downsizing(building a second home on our property) and letting out kids have our house. Financially ridiculous…unless we move to a dying town in flyover country.
You do live on an island after all…
look at the FRED charts for basics like building materials.
Concrete has doubled
Build a smaller, simpler house.
People act as if a 1500 sf home (pretty common from 1950-1990s) is inconceivable…and that anything less than a 2500 sf McMansion (for 1 or 2 people!) is uninhabitable.
Reducing the footprint and simplifying the rooflines of homes by 40% leads to a very large reduction in material costs, labor costs, etc.
This isn’t exactly rocket science – it is common sense (something that has apparently evaporated during the decades of ZIRP insanity).
Alternative building methods are quite prevalent, especially for a smaller building.
I like the concept of container homes. Especially using 2-3 and tying them together with conventional materials (put some trusses between them to make your “great room.”)
Of course, the mainland has more ample availability for… everything.
I like those container homes also, unfortunately lots in many areas near employment without restrictions for housing type, square footage are rare.
There are more canaries than that, yours is one of many obvious examples of inflation limiting the potential of society.
Inflation has the well earned reputation of protecting the wealthy while everyone else picks up the tab. The profits and capital gains rise faster than the wages.
We are IMO in a bubble environment which distorts and anesthetizes our perspective. The interest rate structure seems more negotiated than authentic. The 10 year should be at least 5 pct. Especially now that the US has been monitored as a potential downgrade candidate from the traditional AAA of UGD to AAB. Oh the pain.
Yeah but Wolf, in defense of the entire housing industry I also sort of like ridiculously inflated prices and hate historically normal mortgage rates.
lol jk
Superb analysis thanks.
Free money is the best money, LOL. We all love it. After us the deluge?
Wait a minute this ain’t me
One of you Erics please add some alphanumeric symbols to your screen name, such as Eric01, Eric IV, or whatever.
Oh, that explains it:
I was wondering why Eric went back and forth from being a nutbag to someone that sounded intelligent.
Yes, it can get very confusing with screen names like Eric, John, Mike, Mary… Better to add some alphanumeric gibberish if you want to use a common name as screen name.
Maybe it is just the time scale of the charts but it doesn’t seem like there has been any significant stretch where home sales stay within some average range, they either seem to be going up, up, up or down, down, down. It’s hard to say what would be an average year would be for home sales.
Tiny bubbles (tiny bubbles)
In the wine (in the wine)
Make me happy (make me happy)
Make me feel fine (make me feel fine)
Tiny bubbles (tiny bubbles)
Make me warm all over
With a feeling that I’m gonna
Love you till the end of time
Like commodities? Boom/ bust models?
An artifact of turning shelter into an “asset/ investment.”
Real estate (and money for that matter) is a bit of a shell game. From: go stake your claim, To: this unique section of dirt is incredibly valuable and potentially profitable.
Enter the zoning, the facade-omy fix-n-flip era, ABnB (vs said zoning) and pile on the free cash: what can possibly go wrong?
Imagine what a normal EKG looks like. Now imagine what it looks like when the heart stops completely – FLAT LINE. Soon the housing market
‘EKG’ will look like that – a flat line – distress, anguish, despair, demise. You get the idea. 💡
We better start making funeral arrangements.
Da Vinci-
“…. — FLAT LINE.”
This is hyperbolic talk, and not a realistic depiction of what has happened in other real estate recessions and depressions, IMO.
More realistic to recognize that eventually (too) high prices are cured by high prices and valuations decline, followed by (too) low prices eventually being cured by low prices and valuations rebound again. Ad infinitum.
(And, god willing, those gyrations will reported by Wolfstreet)
As in the past, the period of falling home prices will inflict much individual pain, but home prices won’t “flat line” unless humans cease to exist, or the government nationalizes the housing stock.
Respectfully.
Correct. I had previously sworn off RE investing due to horrible tenants, but even I would jump back in if prices went low enough.
Wolf, I appreciate your research and read every email as I have for sometime. Regarding the housing market, we run PE investment banking fund and deal quite regularly in the luxury housing market. So far, the Florida coastal market is holding up quite well. Above $3.MM up to 22.MM has been resilient. Strong spec building in this market range.
yes, that portion of the market is propped up by wealth effect mentality from stonk portfolios.
if the s&p drops to 3,500, watch that go away.
Kind of… I have heard that the “$5MM and above” market is generally pretty “stable.”
Of course, recently there’s been a lot of activity in the luxury market, so also a subsequent slowdown (anecdotal? At least that’s my Lux area).
The fact is that when the Streets are filled with blood the HNW/UHNW folks will actually protect their wealth BY putting it into something tangible (not a business on the cusp of recession).
A house is generally a “safe” asset: 20 year appreciation, protected from loss by the insurance? All good for the billionaire class. $10-$20 MM at a time? Fine.
We simply redefine all house building related companies as tax free, give them zero interest loans, and tell them to pass that along to consumers. New houses will be so cheap it will force existing house prices down.
There is a conceptual flaw in your thinking: For builders, as for any business: they’re always charging the maximum price that they can get and still achieve their unit sales goals. Their costs do NOT change the selling price, but only change their profit margins. By bringing down their costs, you would just increase their profit margins, which is exactly what happened during the interest rate repression era when we had 0% policy rates, and below 3% borrowing rates and free money everywhere.
True but incomplete. As soon as you add competition(*) to the equation, the “maximum price that they can get” gets reduced because they have to charge less than the competition and each competitor will eventually be willing to lower prices to minimum acceptable profit margin over cost.
(*) Ignoring collusion, monopolies, sticky-downward prices, etc.
Why not phase out the $500k home gain exclusion over ten years. That would activate supply and raise government revenue to boot. It would be a high class problem no one could legitimately complain about.
Another tax break for homeowners? You pay capital gains taxes on your stocks when you sell them, and you should pay capital gains taxes on ALL your assets when you sell them. RE is the most tax-coddled sector ever. I need to give Trump a call and let him know to write up and sign an executive order to that effect. You can sue him, if you don’t like it, LOL
Tell him I said hi. And, by the way, kill carried interest. And 1031….
i think bobber was calling for eliminating that tax break.
Franz G
Maybe yes. The way I read it was doing away with the cap on tax-free capital gains and make the entire gain exempt from capital gains taxes. I think that’s the case in Canada with the sale of a principal residence.
i see what you mean now. based on what i’ve seen bobber post, i can’t imagine he’d support an unlimited exemption, but i’ll let him speak for himself when he gets on this site.
i support doing away from the exemption entirely, although I do think that the tax should be able to be delayed if you roll it into a new house, if you move from a $1 million house in chicago to a $1 million house in seattle, for example.
but i also think the tax basis step up on death should be eliminated, so that in my example, the tax man would eventually get the taxes.
Big difference between cap gains on gambling vs. One’s homestead. Regular folk are getting crushed by taxes and insurance. We deserve to retain as much of the selling price as possible
Jackson Frost,
LOL, that sense of entitlement of RE holders is just astonishing. We make hugely risky highly leveraged bets… 10% down? 3% down? nothing down? And the rest is borrowed via taxpayer-backed mortgages; we then expect bailouts by the Fed when prices tank, expect artificially low mortgage rates to keep prices inflating, expect constantly soaring prices, and when we sell the house, we expect to keep 100% of the capital gains from our highly leveraged government-backed bets without paying capital gains taxes?
Bobber,
Wouldn’t phasing out the 500K deduction cause a panic with homeowners trying to sell and cash in? The supply would increase drastically.
I don’t think lack of supply is the issue. Price is the issue as Wolf has pointed out.
Creating a huge supply shock might be enough to expedite a huge price crash like 2008.
I’d prefer the supply problem take care of itself gradually without any government caused black swan shock.
It shouldn’t cause a panic if phased in over 10 years, but it would stimulate some selling and increase tax burden of homeowners who inadvertently benefited from the Fed’s ZIRP/QE mistakes.
There are lots of ways to reduce RE subsidies. I could think of 50 more. My main point is homeowner subsidies are counterproductive and lead to price bubbles that do great damage. Let the free market work it’s magic.
Bobber,
I absolutely agree that home price bubbles cause a huge disruption. I think that was caused by the Fed with sub 3% rates. The Fed overestimated the effect of COVID.
That likely caused this distortion in the housing market but saved the country from a recession/depression for those who could not work from home.
I’m a homeowner AND a landlord with a spare rental. My tax benefits for being a homeowner are nothing. The previous admin capped the SALT deductions and raised the std deduction. I can’t deduct ANYTHiNG for my primary home now. I can’t even deduct interest paid on a mortgage vs interest earned. Except the 500K when I sell it. There are very few deductions for homeowners. People predicted that the SALT cap would drive house prices down in high tax states (Retribution Round 1). They were wrong. The wages for good jobs just went up in popular high tax states. Ie High Tech.
Homeowner deductions are not the problem. There are few.
Landlord deductions are HUGE! You can deduct all property taxes, insurance, and all interest plus and repairs as a business expense. I wish I could do that with my primary home. As someone once said, if you are a landlord and paying any taxes, you are doing it wrong. I think the leader of our current administration said this so I doubt these tax deductions will go away.
I’d focus on rental property deductions to increase tax revenue and force the speculators to sell to people who need a home. The tax deductions for owning a rental are HUGE!. That didn’t stop the rents from going up to market rates. As Wolf said above for new house prices, supply and demand will determine the market price.
One final comment.
The ridiculousness of being a landlord.
I could also deduct 30K/year in depreciation on my taxes for my rental while the assessed value was going up 100K/year. Crazy loss for the US Government taxes.
This is why our current leader pays very little tax on his RE holdings. I foresee little change in thes tax laws.
regarding deductions for commercial real estate, there is nothing philosophically wrong with being able to deduct property taxes, insurance and repairs. it’s as much as an input as the raw materials are to a manufacturer of cars.
the problem is depreciation. depreciation makes sense, in theory. take a piece of factory equipment with a 10 year useful life. the idea is that after 10 years, it’s basically useless, and worth $0.
but the idea that residential real estate (the improvements, not the land) is worth 0 after 27.5 years is complete nonsense.
if that were the case, most single family homes would to be razed after 27 years and rebuilt from scratch. given the number of 100+ year old houses people are still living in in old parts of america and much of the world, that’s obviously not the case.
Franz G,
I agree! What house value goes to 0 after 27 years?? None, yet as a landlord, I can deduct thousands in depreciation for a rental. That is ridiculous.
I also agree deducting interest, property taxes, repairs, and insurance are a fair deduction. They are expenses.
A primary homeowner has NONE of these deductions. That is not fair.
A primary homeowner can rarely deduct taxes with the SALT cap and interest with the standard deduction.
A landlord has none of these limitations with a rental.
Are landlords being favored or are homeowners being persecuted?
As a homeowner, I think I’m being persecuted. (Unless I sell with a 500K tax exemption.)
Prime motivation to increase the supply for the next landlord. Government is not motivating me to stay and own my own home.
Just rent and be at peace. Or buy a house with an ADU and rake in the tax benefits with a rental.
bobe, i hear your point, but the rent you get is income. if i buy wood to build a shelf for my house, it’s not deductible.
if i buy wood to build shelves in someone else’s house, and he pays me for the work and the finished shelves, i can deduct the wood i bought.
i don’t see repairs and taxes as being different. if we prohibit landlords from deducting property taxes, would we also prohibit home depot from deducting property taxes on their stores?
i think your heart is in the right place on this, but i don’t think some of these ideas really are workable.
Wolf,
Apologies. I wasn’t serious at all with my idea. Basically packaging all historical bad ideas into one, wrapped in good intentions. Seems the more interesting things become that making fun seems to be my best escape.
If your governments (Federal down through municipal) REALLY wanted to make housing more affordable they would simply build low income housing themselves and take, say, 20% of housing right out of the market altogether (Singapore and Vienna offer variants of this). This would get a bunch of your homeless off the streets and simultaneously increase the housing “glut” in the other 80% of the housing market, putting further downward pressure on prices and rents.
But they DON’T want to make housing more affordable, so they dismiss this as “socialism” (LOL — Singapore as “socialist”? As if …) and continue crying crocodile tears as they go right on taking brown envelopes from a host of real estate and real estate adjacent lobby groups.
good one eg:
For those who don’t remember or don’t want to,,, at one point, every county commissioner in a county in FL was put in jail by the feds for taking bribes from developers who wanted to ignore the development rules and regulations.
Just one more reason NOT to buy anything in FL built before the 1994 code changes resulting from Andrew.
Since then, many more improvements in codes AND even more important code enforcement.
Totally agree. Nordic countries is another good example.
People in America are largely homeless because of addiction/mental health issues, not because they can’t afford a home.
A very noble idea.
“Focusing solely on timelines diminishes the hard work of numerous individuals dedicated to providing much-needed housing,”
Quote from the private…..or public sector?
Though my other half of the business is jealous she didn’t come up with that line. I’m sure she now has it memorized.
And anything in the US labeled “low income” or “affordable housing” gets all the Not In My Backyard (NIMBYs) out worried their property values will drop like a rock from all that low income housing and “poor” people. It’s a never ending cycle.
It is still a seller’s market here in the Midwest. I am having a tough time buying a house. Here is the synopsis of the past two weeks for me:
Made an offer 3% under asking due to their 15 year old roof. Outbid, 3 total offers
Tried to set up showings for 3 houses for a Friday on Thursday afternoon. They all three were on the market about 24 hours and were all under contract on Thursday afternoon, so I wasn’t even fast enough to see them.
Made another offer 1% under asking due to rot on siding and windows: Outbid, 3 total offers
Made another offer at list on a good house: Outbid with 2 total offers
Made another offer today, 4% over list. We’ll see if that one goes through.
If you’re looking to buy a house now, and are overbidding, don’t complain about the market because by trying to buy and by overbidding, you become part of the problem you’re complaining about. Buy it, pay whatever it takes, understand that you helped drive up prices, and understand that a house is an expense, and make sure you can make the mortgage payments for the next two decades, and that you don’t have to move for those two decades, and you’ll be fine no matter what happens to the housing market. Enjoy your life in your house, but don’t count on your house to make you rich. And if you lose money on your house, fine; and if you make money on your house, finer. But don’t complain about the market as you yourself are contributing to the problems.
Sorry if I came across as complaining, I try not to be a complainer. I agree that I am part of the problem here. I meant this comment more as a “from the trenches” view of how things are in my neck of the woods. I will also admit that I have been frustrated though!
I don’t consider the house as an investment. I have to write too many checks to it. The family does need a place to live and I would rather trade my dollars which can get inflated away for a physical structure that can shelter me if I keep it up.
I know I could rent, but I choose not to due to due to some factors that I would rather not discuss here.
Ralph,
You should ignore the comments made by those other people. Renting versus buying is a very complicated and personal decision. Some people even decide to live on the street or in a RV or in a car! Do what makes sense to you. Here is some interesting data. The home ownership rate in Q4 of 2024 was 65.7 percent. In Q3 of 1979, it was 65.8 percent.
“Made an offer 3% under asking due to their 15 year old roof. Outbid, 3 total offers”
“Made another offer 1% under asking due to rot on siding and windows: Outbid, 3 total offers”
Holy cow…try buyer protest for once, especially considering what you’re getting for the money…I promise you, renting is not the end of the world and yes you can rent a house and do something else with your down payment in the meantime. The delta you save compare to comparable mortgage payment you can also use to invest, T-bill and get some return.
Like Wolf said, if you’re still buying now then you’re part of the problem and probably shouldn’t be complaining and suck it up and overbid just like all the suckers that overbid and paid wayyy over sticker when C8 Z06 was going bonker, sure none of those people regret it now…
“I promise you, renting is not the end of the world”
Your posts suggest you feel like it has been, for you. :-)
I sat it out a long time (age 30) before underbuying, then sat for another 10+ waiting to upgrade, bitching the whole time about the idiots overpaying and ruining the market. When our perfect dream home came up right at the bottom of the 2011 market, we were too embroiled in another project to confidently swing it. We’ve wasted a lot of the last 30 years obsessed about this. Don’t be me.
What did you do from 2011 to 2019? Prices were steady and money was cheap?
Everyone, ever, should regret buying a Corvette.
I still miss my 1965 Corvette Stingray convertible….really!
I’m with AA on this one MS:
Not regretting buying my first car after years of driving parent’s cars.
Regretting selling it, but consoled that it was my BF at the time who asked to buy it.
1956 Triumph TR-3, the early one with the small cowl.
I bought it for $600, and sold it to best bud for the same… I will let you find out recent sales, but, last time I looked, it was about $60K…
You gotta add 5-10% on asking if you don’t want to insult the seller. That’s just how it is now. Like a tip.
Also throwing in a future kidney as a sweetener from you or a family member can help. Need to repeal those mandatory motorcycle helmet laws and get the organ donor count back up.
Nolite Nos Calcare!
I think it comes down to what type of home and what block it’s on. There’s some older people definitely trying to lock in a price gain on their forever home and ride off into the sunset. These places are reasonable size, median-ish price, and may need a little love. What is that worth to you? If you want a home that everyone else wants, then get ready to pay over asking.
I’m convinced the go-bar-mint and the banks must have a covert/invisible ‘Let’s Keep Housing Prices High Department’. Its mission…well, its mission is in its name. 🥸
So far so good in the Swamp. The price of existing homes and even condos are holding up well in DC. The end of WFH has al lot to do with it. People need to be close to their jobs.
Yeah Wolfman, I recall hearing on NPR or other media sources that Professor Shiller research shows housing values historically increases about 4% a year.
So theoretically if a house value is 100 in 2020 and goes up to 150 in 3 years then it should remain at 150 until 2030.
I’ve been considering buying a property in New England, though I live in Florida. Not being close to the market, I have no idea what I should consider paying for a property. So I did some modest research on historical increases in residential real estate prices. That, albeit limited, research shows that prices generally run 1% over inflation over time.
So I wrote a little program (programmer by trade) that would take the last sales price and add inflation + 1% based on the local CPI-U for the area from the BLS just to see what I got. I added 6% on top of it all for the realtor’s commission. The results are interesting. Prices are always higher than the calculation. The best was a beach side condo going for $299,000 and the system calculates I’d be okay paying $279,000. The worst was an asking of $399,000 and the the system saying I should pay $266,000. The $399k place had new granite counter tops for which I assume the flipper thought I should pay a healthy premium. That’s not my style, but I’m sure someone will.
Curious how your model does if you compare predicted values to actual sales, not listed prices.
That is an interesting experiment.
How long would it take for median price nationally to come down. It is still stuck at 2022 price.
I look at the median price chart and it clearly shows higher lows and higher highs since 2022, eventhough sales have collapsed to 2009 lows. It is quite a unique situation that I would not have predicted but here we are. If price momentum is up during a time that sales have collapsed, what do you think will happen when sales recover? Good luck waiting for the price to go down.
” Good luck waiting for the price to go down.” But prices are already going down in many of the ‘hottest’ markets.
A city in case is Austin: down 20% + from its peak.
Yes Jon, there are markets such as Austin that have been hit the hardest, but we were both talking about the national median price. Not only is price momentum up despite a sales collapse, add to it an approximately 4% jump in mortgage rates since 2022. The national median price chart looks like realtor propaganda, I don’t think I’ve ever seen such resilience. Waiting to see how big of a price jump we get once conditions are more favorable.
No ONE, and I mean NO ONE, every buys the national median house at the national median price. Not investors, not regular home buyers. It doesn’t exist. People buy in local markets and pay local prices.
HOOOLLDDDD, HOOOOLLLDDDD!!! One can dream prices will come back down – a SOL young family in NJ
3-year 50% price explosion, AND the 100% (or from the bottom 600-700%?) mortgage rate increase.
I was blessed with a sub 4% rate, by chance of timing on my home, only RE purchase ever, in 2016.
My wife had an ARM in HB1, which ended up with her buying more house than she could really afford.
She sold and didn’t lose her shirt, but the retrospective is that the house is 3-4X the price now!
The home I’m in is appreciation capped (a deed restriction to try to keep SOME housing affordable in ski country USA), so it will never keep up in an inflationary environment.
The fact is that I couldn’t afford to rent here with today’s market/ which is the 2 edged sword that also has me setting fora crummy wage!
how can a house be appreciation capped? like the hoa prohibits selling it for more than a certain amount?
It’s literally on the deed. Much of it is in relation to town developments, which generally also have a clause that allows it to revert to town ownership/ control many circumstances.
Mine was added, as an offset to other developments.
It’s a strange thing, but common throughout Colorado ski country. There’s various flavors (even in my area there’s 3 main “silos” under 2 towns and the county, with variations in each. It’s definitely confusing).
It’s the only way I could have afforded my place. I believe Aspen granted an “appreciation holiday” for their program, up to 30% in 2022, as surrounding prices were skyrocketing.
How do we know housing is in a bubble?
Alan S. Blinder gives a convincing explanation of the first housing bubble:
(1) The historical data should be long enough to give us an historical perspective.
(2) The data should be deflated (using real prices)
(3) The data should be compared to the relative prices of other things.
Using 120 years of historical home prices, the relative prices of houses in America barely changed over more than a century! The average annual relative price increase from 1890 to 1997 was just 0.09 of 1 percent. Then things changed dramatically. According to the Case-Shiller index, real house prices soared by an astounding 85 percent between 1997 and 2000—and then came crashing down to earth from 2006 to 2012. This represented a large, long-lasting, and a sharp deviation from fundamental value.” Pg. 32 “After the Music Stopped”
So, as Wolf says, housing is overpriced. Demand destruction is in progress.
Housing prices won’t collapse until after 2/2026.
An author with the initials M.S. has a recent article titled “ The Collapse Of U.S. Home Sales Is Here”.
This “M.S.” is two years late, LOL. Sales “collapsed” over two years ago. It’s in its third year now:
If that were adjusted for population growth, the decrease would be even more dramatic.
Great to see the charts and trends. 2008/2009 MBS crisis gave everyone a home they could not afford and brought down the too big too fall Titans on Wall Street. If 40 is the new entry level age for buying home in America, let it be. Most southern states judge your wealth off the vehicle you drive, so as long if you can afford a lease on a new truck:car you will be fine and keeping up with the Jones Zeez. Buyers remorse is short lived by those who are still able to liquidate and move towards the state their hearts desire. Those who are unburdened by debt, still are free to move about the cabin. The wife and I car insurance renewal with Amica decreased for the 2nd 6 months in a row in Colorado.
I think that San Francisco should pass a city ordinance that says that whatever a home lists for, it can only sell for 50% of the asking price or less. That would be on par with other things the city has done. HPSF…Half Price San Francisco. As California goes, so goes the nation.
There were lots of comments that diverged from low home sales on how to make housing affordable to build again. To me, one of the biggest exclusivity clauses in covenants for most new custom lot you-build subdivisions is minimum square footages “to protect your home’s value”. Outlaw square footage minimums and a $xx,000 lot next to a golf course becomes affordable to build on at 600-1000 sqft. Architectural design standard costs are nothing compared to requirements to build 1800+ sqft and a two-car garage.
You still see a ton of listings in Florida where owners are clinging to summer 2022 prices. However, many of these listings are sitting in this state for 180 days or more, perhaps with some Mickey Mouse price cuts along the way. These owners are playing with fire. If they don’t sell by the end of the season (late-June at the latest) they will easily be stuck with an unsold property through next spring.
Well-priced properties are selling briskly though.
WSJ just published: Battle of Home Buyers vs. Investors Is Making Toledo a Housing ‘Gold Mine’
Basically stating that cash heavy investors are pushing normies with mortgages out of market. Or at least making it harder.
Per the article, the attraction of Toledo is that it is one area where home prices never went up.