State of housing markets in New York, Los Angeles, San Diego, San Francisco, San Jose, Chicago, Dallas-Ft. Worth, Houston, Washington D.C., Philadelphia, Miami, Atlanta, Boston, Phoenix, Seattle, Tampa, Denver, Baltimore, Charlotte, Portland, Austin, Las Vegas, Kansas City…
By Wolf Richter for WOLF STREET.
What the housing market faces are mortgage rates that have reverted back to the old normal range of around 7%, the lowest demand for existing homes since 1995 amid rapidly rising active listings, and aggressive competition from homebuilders that have built up the largest inventory for sale of completed single-family houses since 2009, and they’re trying to sell those houses by cutting prices and throwing incentives at them, including mortgage-rate buydowns. And unlike sales of existing homes, sales of new homes have held up, and homebuilders, by sacrificing profit margins, have gained big chunks of market share.
But home prices don’t move the same in all markets. The markets we’re looking at here are all large, often multi-county Metropolitan Statistical Areas (MSAs), some of them spanning portions of several states, often grouping together several big cities and many suburbs, smaller towns, and bedroom communities. Each of these markets moves to its own drummer. In some of these markets, prices have dropped sharply from the peaks in mid-2022; in others, they rose until recently.
In some markets, there is essentially no seasonality to home prices, just peaks and troughs that occur at various periods of the year.
In other markets, there is distinct seasonality in home prices. Seasonal price changes must happen in a similar way in the same months every year, or they’re not seasonal. The charts below, which are based on raw, not-seasonally-adjusted prices of mid-tier homes in each market, demonstrate that absence or presence of seasonality.
Price declines from prior month: Prices of single-family houses, condos, and co-ops fell in December from November in 30 of the 33 of the large metros on our list here. In the remaining 3 metros, prices were unchanged in December from October (the metros of Washington D.C., San Jose, and Salt Lake City).
By Metropolitan Statistical Area (MSA), the top month-to-month price declines with drops of -0.3% or bigger:
- Tampa, FL: -0.9%
- Austin, TX: -0.8%
- Tucson, AZ: -0.7%
- Atlanta, GA: -0.7%
- Dallas, TX: -0.6%
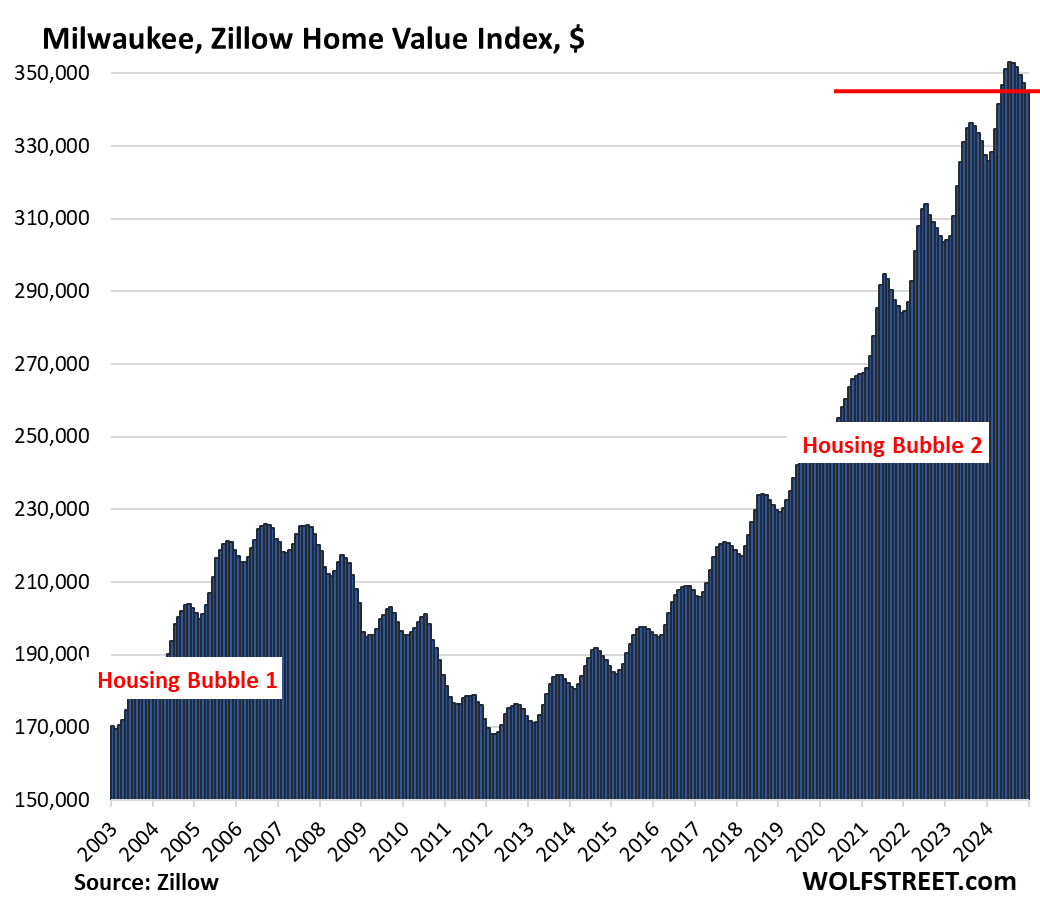
- Milwaukee, WI: -0.6%
- Orlando, FL: -0.6%
- San Antonio, TX: -0.5%
- Phoenix, AZ: -0.5%
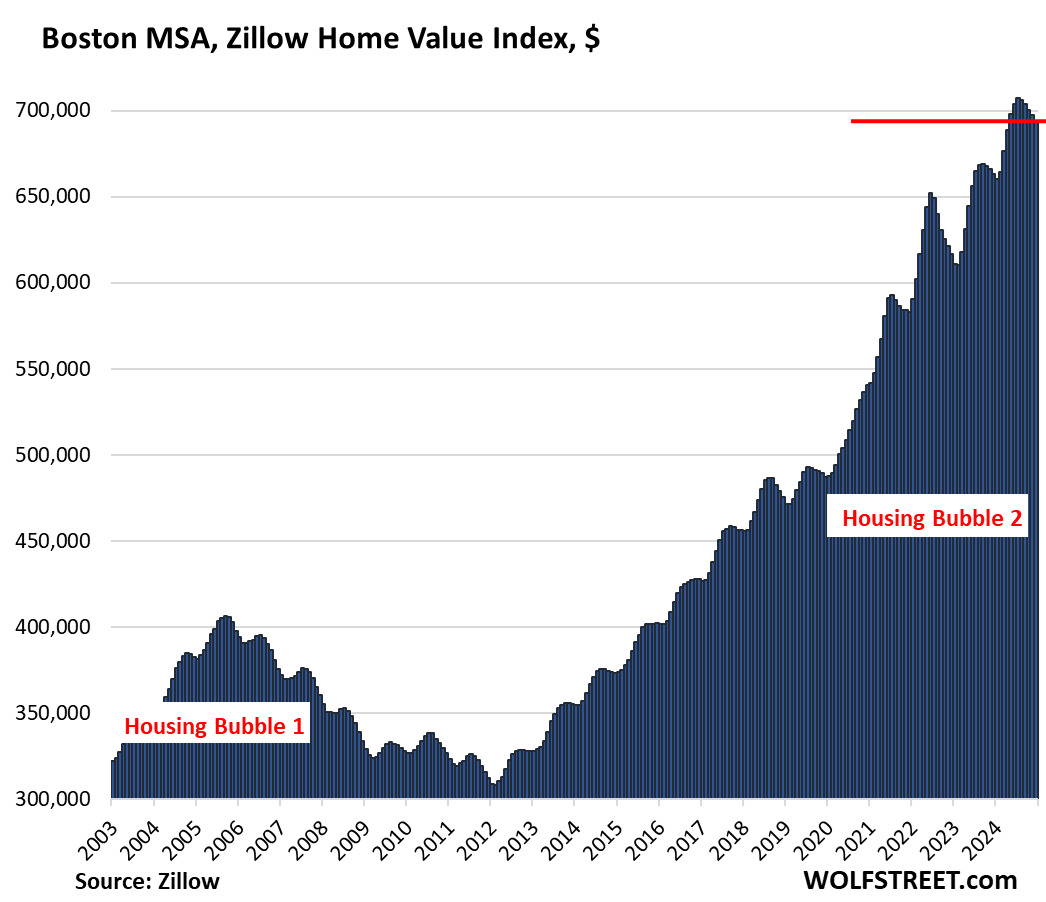
- Boston, MA: -0.5%
- Miami, FL: -0.4%
- Raleigh, NC: -0.4%
- Denver, CO: -0.4%
- Charlotte, NC: -0.4%
- San Francisco, CA: -0.4%
- Sacramento, CA: -0.4%
- Houston, TX: -0.3%
- San Diego, CA: -0.3%
- Chicago, IL: -0.3%
- Minneapolis, MN: -0.3%
- New York, NY: -0.3%
- Portland, OR: -0.3%
- Cleveland, OH: -0.3%
- Birmingham, AL: -0.3%
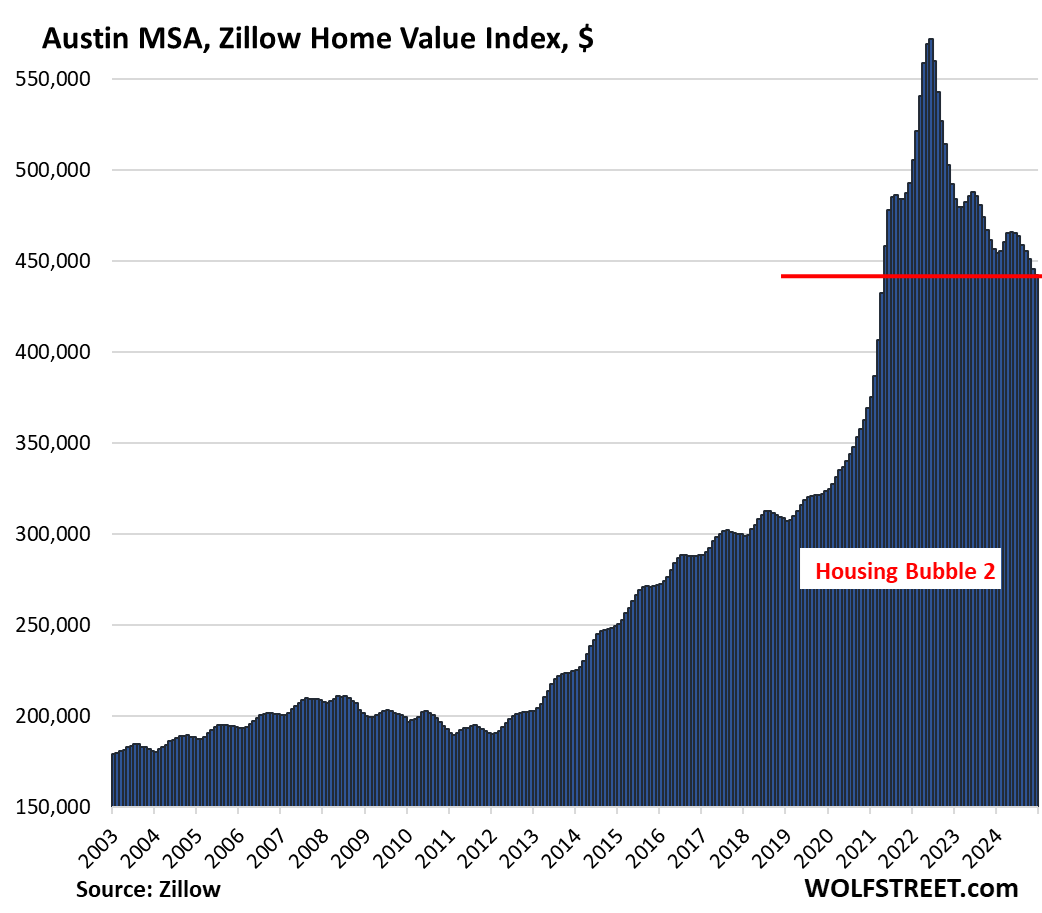
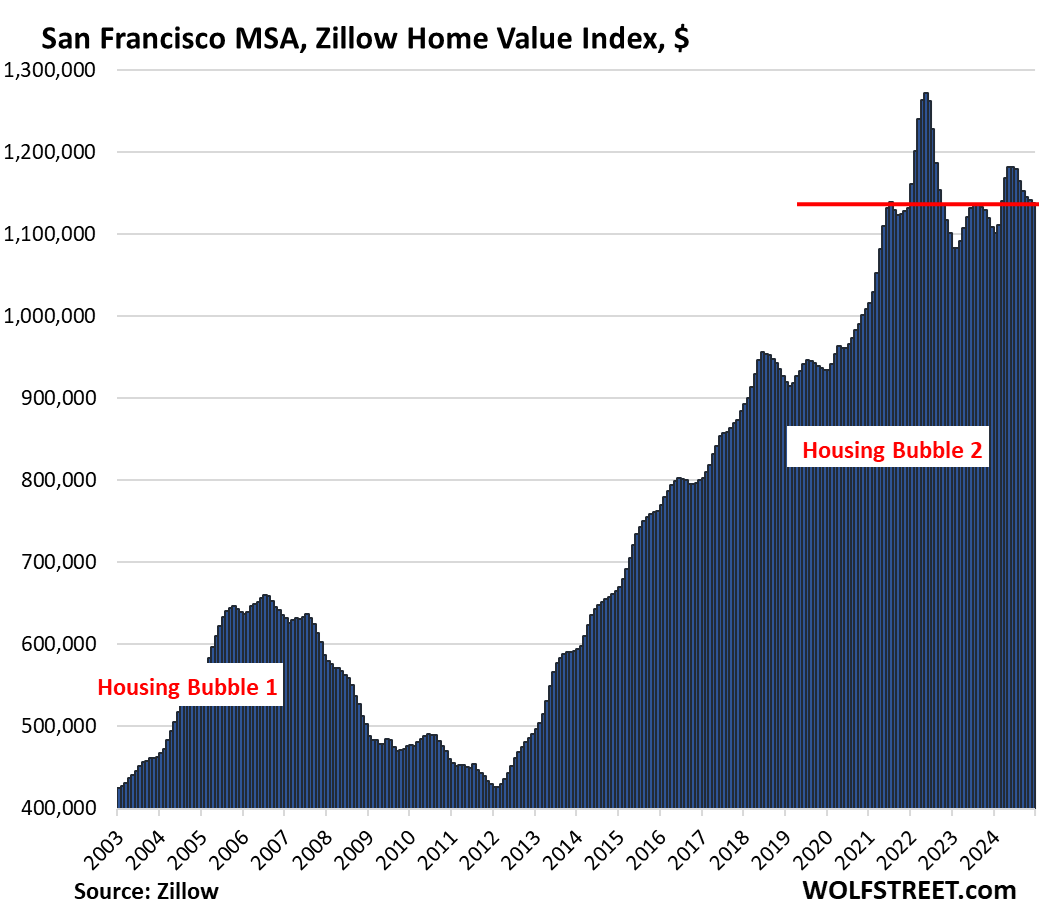
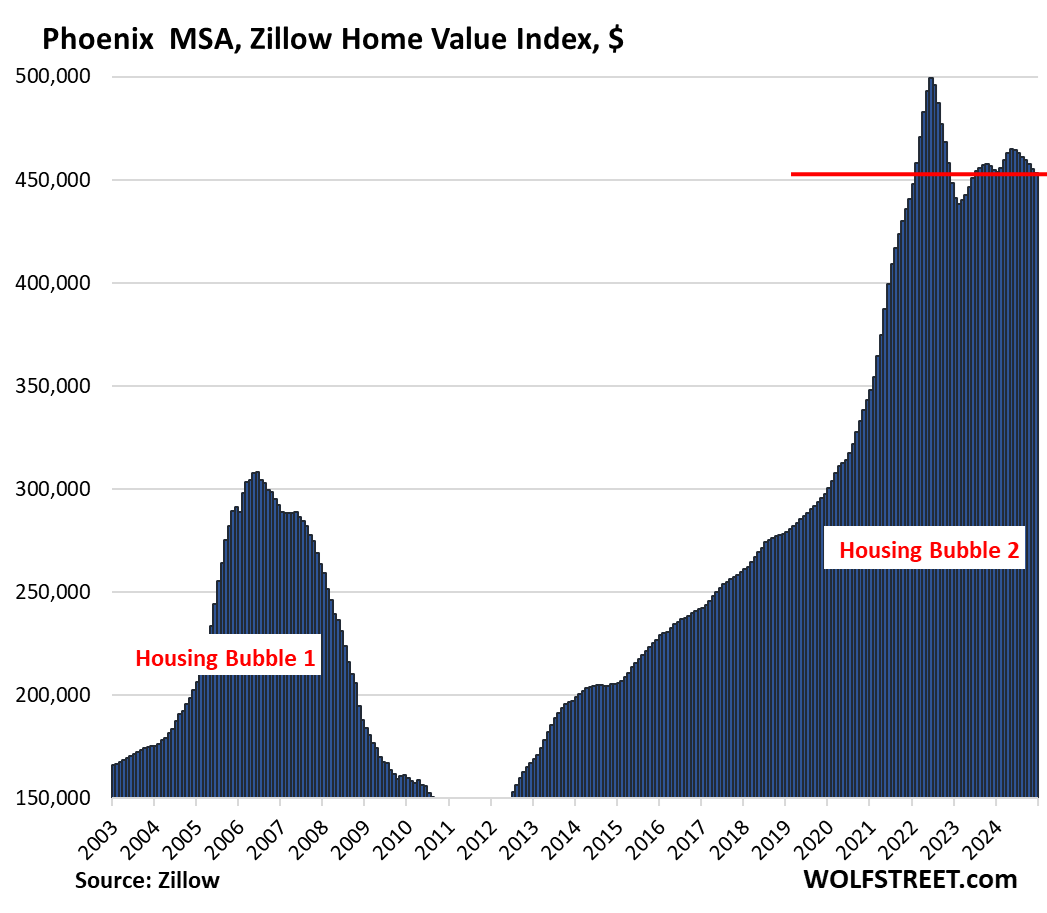
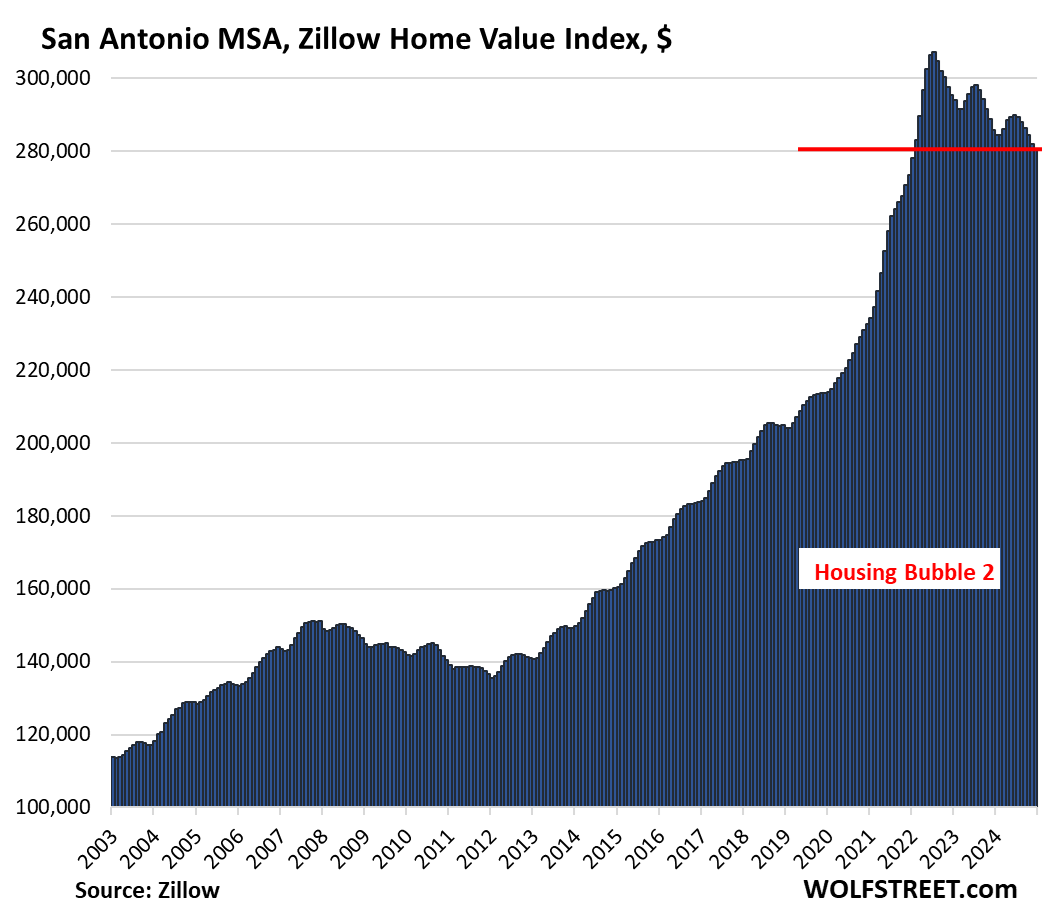
21 Metros of 33 are down from their 2022 peaks: In 21 of the 33 MSAs, home prices were down from their respective peaks in mid-2022, with two of them down by the double digits: the metros of Austin (-22.6%) and San Francisco (-10.6); and two of them down about 9%: Phoenix (-9.2%) and San Antonio (-8.7%).
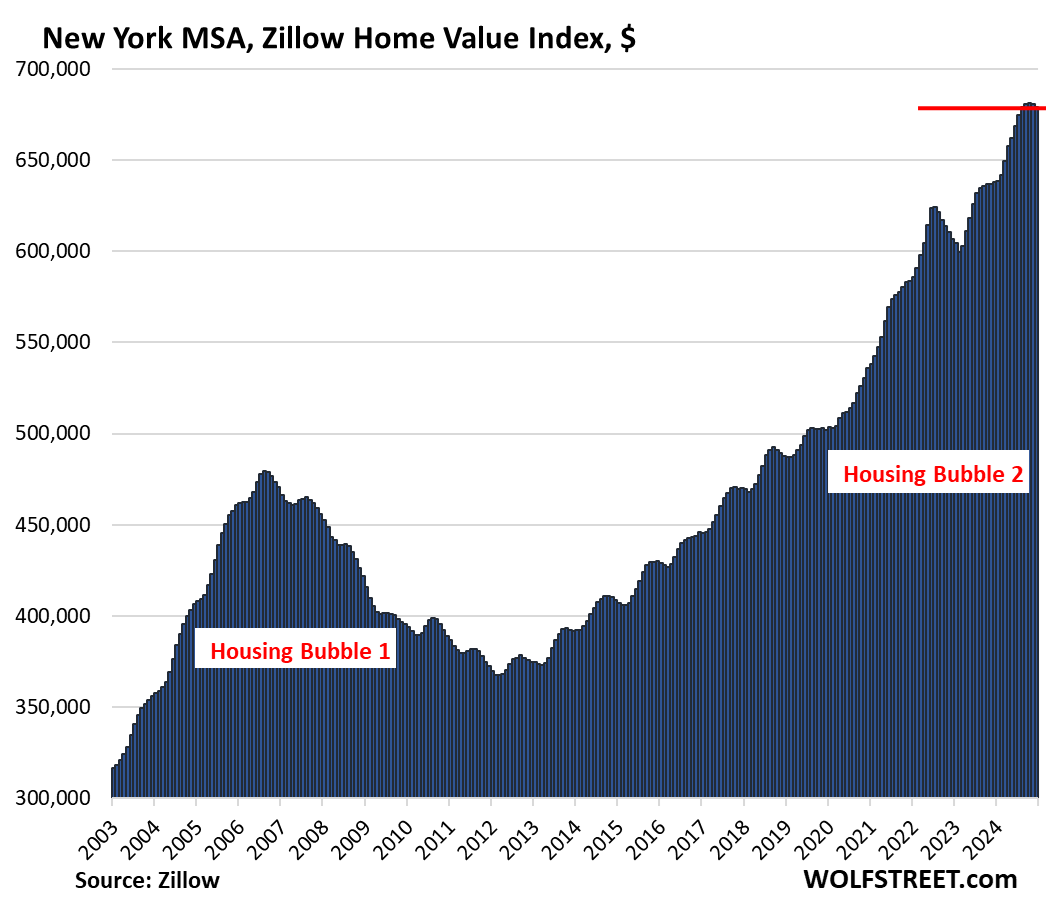
No New highs in December: No MSA here of the 33 MSAs made a new high in December. Even prices in the New York City metro dipped for the second month, after the huge uninterrupted run-up.
All data is from the “raw” mid-tier Zillow Home Value Index (ZHVI), released today. The ZHVI is based on millions of data points in Zillow’s “Database of All Homes,” including from public records (tax data), MLS, brokerages, local Realtor Associations, real-estate agents, and households across the US. It includes pricing data for off-market deals and for-sale-by-owner deals. Zillow’s Database of All Homes also has sales-pairs data.
To qualify for this list, the MSA must be one of the largest by population, and must have had a ZHVI of at least $300,000 at the peak. The metros of New Orleans, Oklahoma City, Tulsa, Cincinnati, Pittsburgh, etc. don’t qualify for this list because their ZHVI has never reached $300,000, despite massive run-ups of home prices in recent years, but from very low levels.
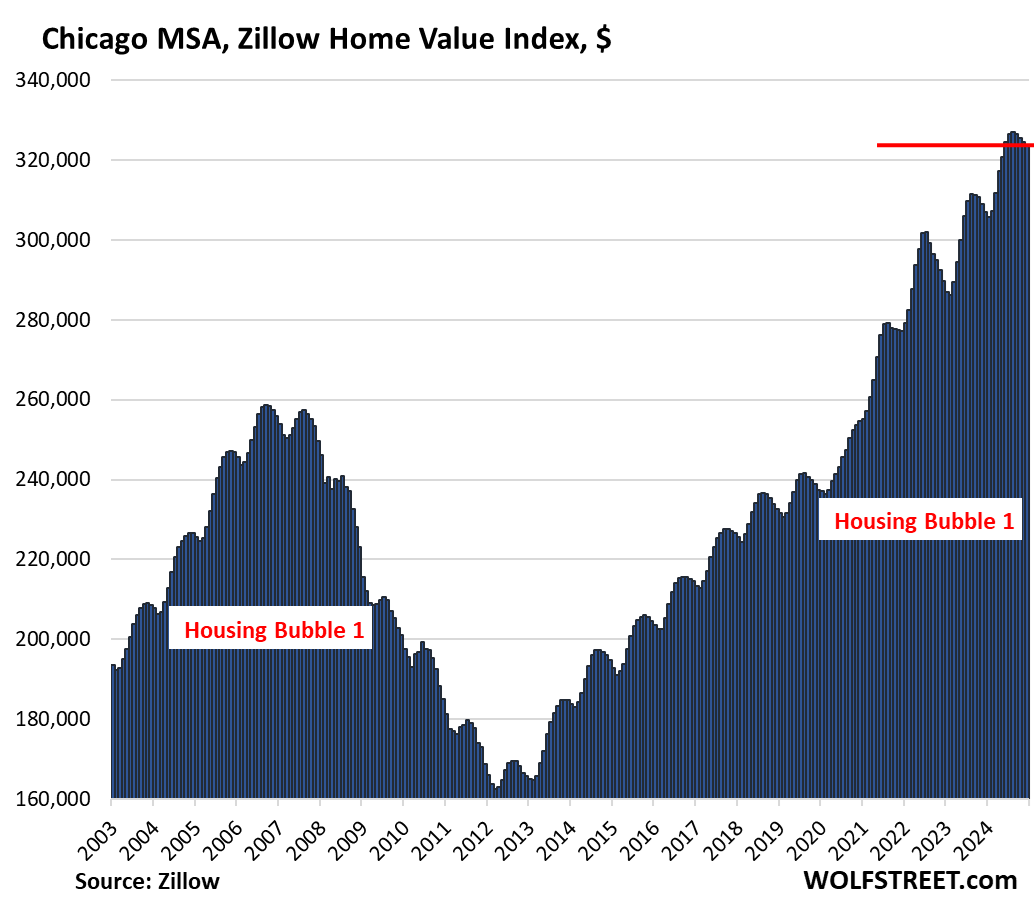
The Most Splendid Housing Bubbles in America series began in 2017 to document visually metro-by-metro the surge in home prices fueled by the Fed’s years of interest rate repression and QE that included the purchases of mortgage-backed securities, ultimately pushing mortgage rates below 3%.
But in 2022, the Fed changed course, mortgage rates have reverted to the old normal range of around 7%, as the Fed has shed $2.1 trillion in assets under its QT program.
The first 21 metros here are all below their highs in mid-2022, sorted by magnitude of decline.
| Austin MSA, Home Prices | |||
| From Jun 2022 peak | MoM | YoY | Since 2000 |
| -22.7% | -0.8% | -3.2% | 156% |
The index for the Austin MSA – includes the five counties of Travis (Austin-Round Rock), Williamson, Hays, Caldwell, and Bastrop – has dropped to the lowest level since April 2021.
The price spikes in 2021 had been nuts. Over the six months February-July 2021, prices had spiked by nearly 30%, which were then followed by additional price spikes through June 2022, after which it all started coming apart. This kind of speculative mania should never occur in a housing market. But the Fed’s interest rate repression, including trillions of dollars of QE, turned housing markets into absurdities.
| San Francisco MSA, Home Prices | |||
| From May 2022 peak | MoM | YoY | Since 2000 |
| -10.6% | -0.4% | 2.7% | 290% |
Prices in the San Francisco MSA – which includes San Francisco, Oakland, much of the East Bay, much of the North Bay, and goes south on the Peninsula through San Mateo County – are back where they’d first been in July 2021:
| Phoenix MSA, Home Prices | |||
| From Jun 2022 peak | MoM | YoY | Since 2000 |
| -9.2% | -0.5% | -0.3% | 219% |
Prices are back where they’d first been in February 2022:
| San Antonio MSA, Home Prices | |||
| From Jul 2022 peak | MoM | YoY | Since 2000 |
| -8.7% | -0.5% | -1.8% | 147.5% |
Prices in San Antonio have dropped to the lowest level since February 2022.
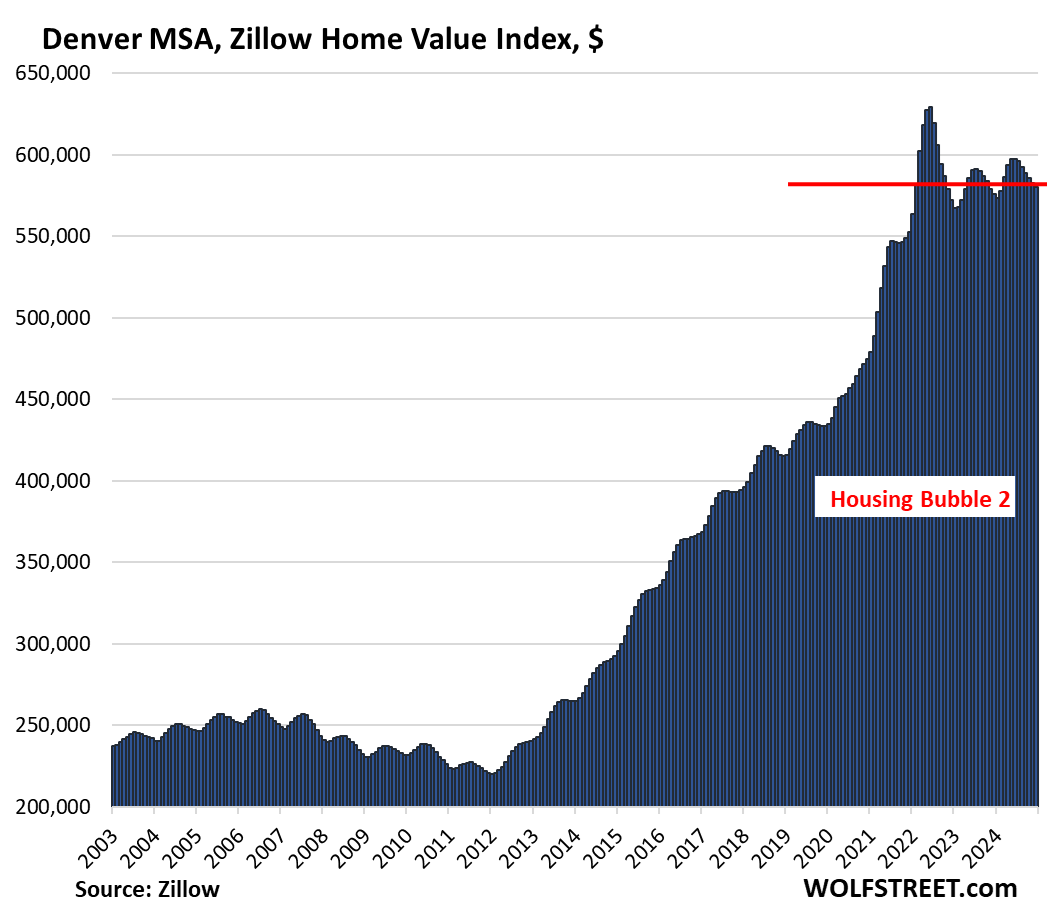
| Denver MSA, Home Prices | |||
| From Jun 2022 peak | MoM | YoY | Since 2000 |
| -7.8% | -0.4% | 0.8% | 211% |
Prices are back where they’d first been in February 2022.
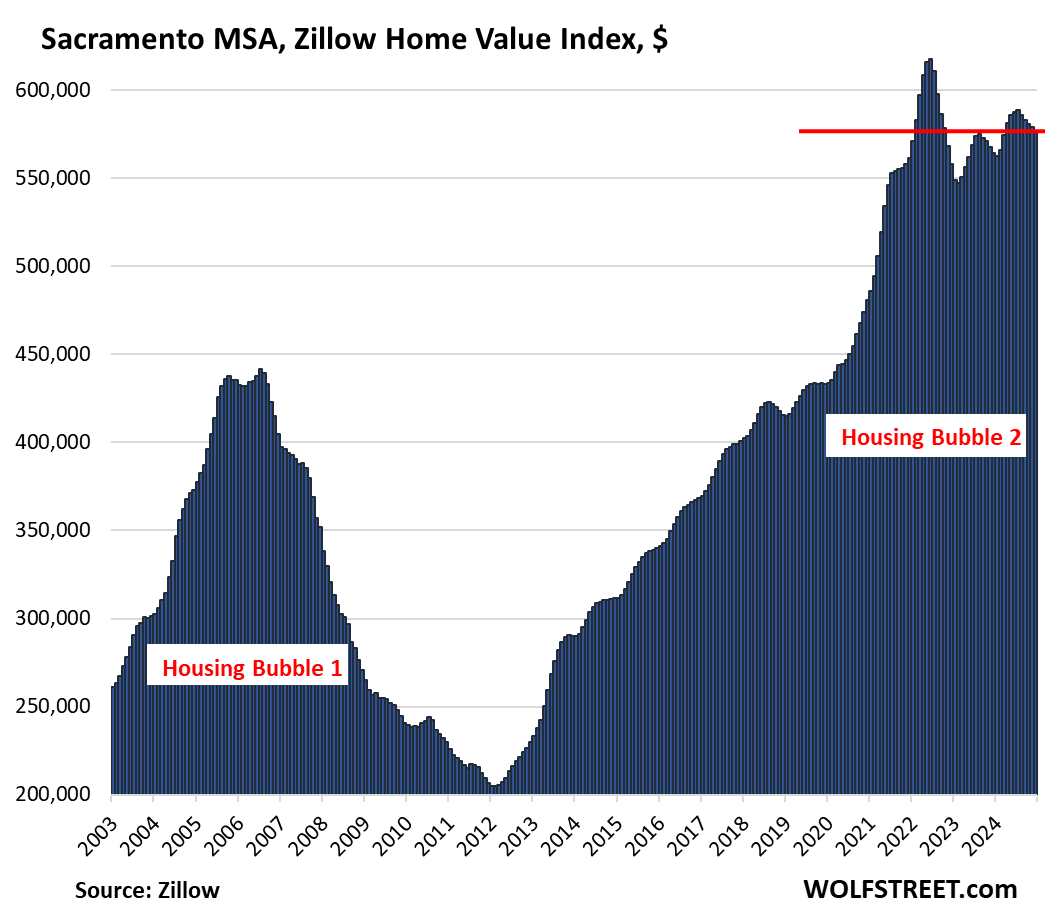
| Sacramento MSA, Home Prices | |||
| From July 2022 peak | MoM | YoY | Since 2000 |
| -6.7% | -0.4% | 2.1% | 244.8% |
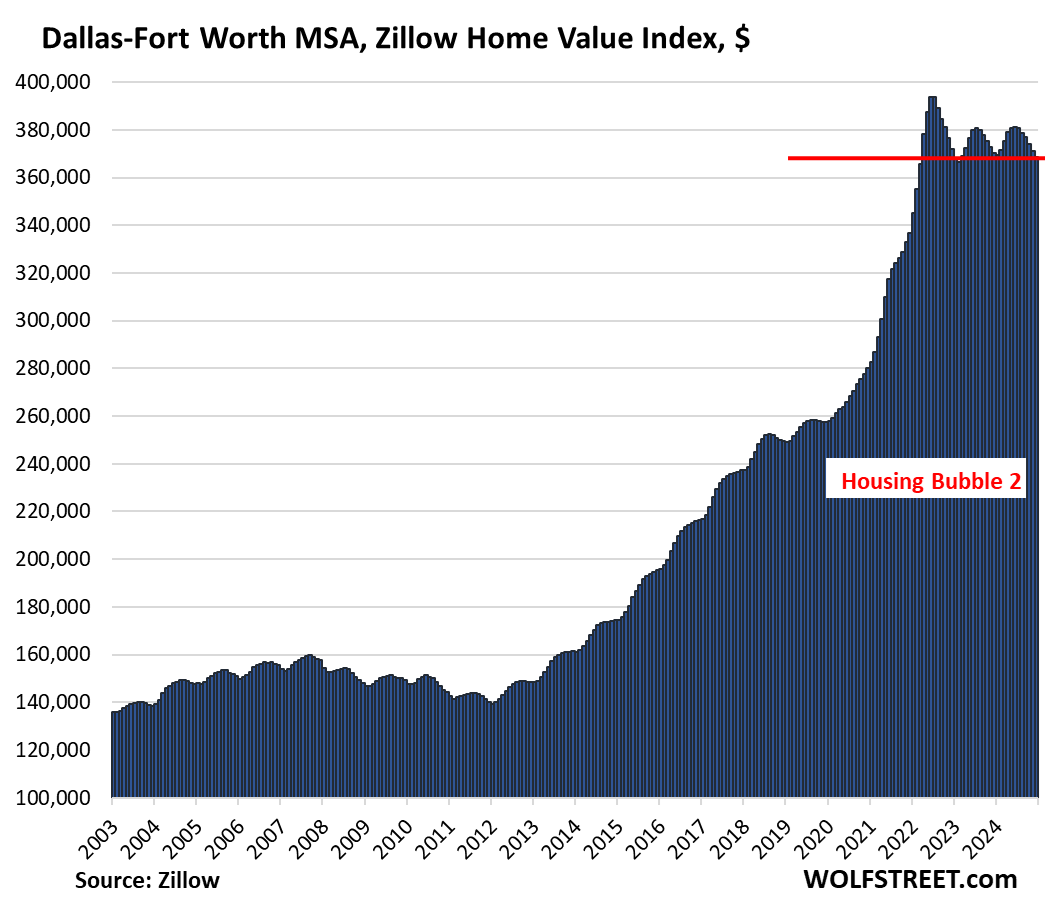
| Dallas-Fort Worth MSA, Home Prices | |||
| From Jun 2022 peak | MoM | YoY | Since 2000 |
| -6.4% | -0.6% | -0.4% | 192% |
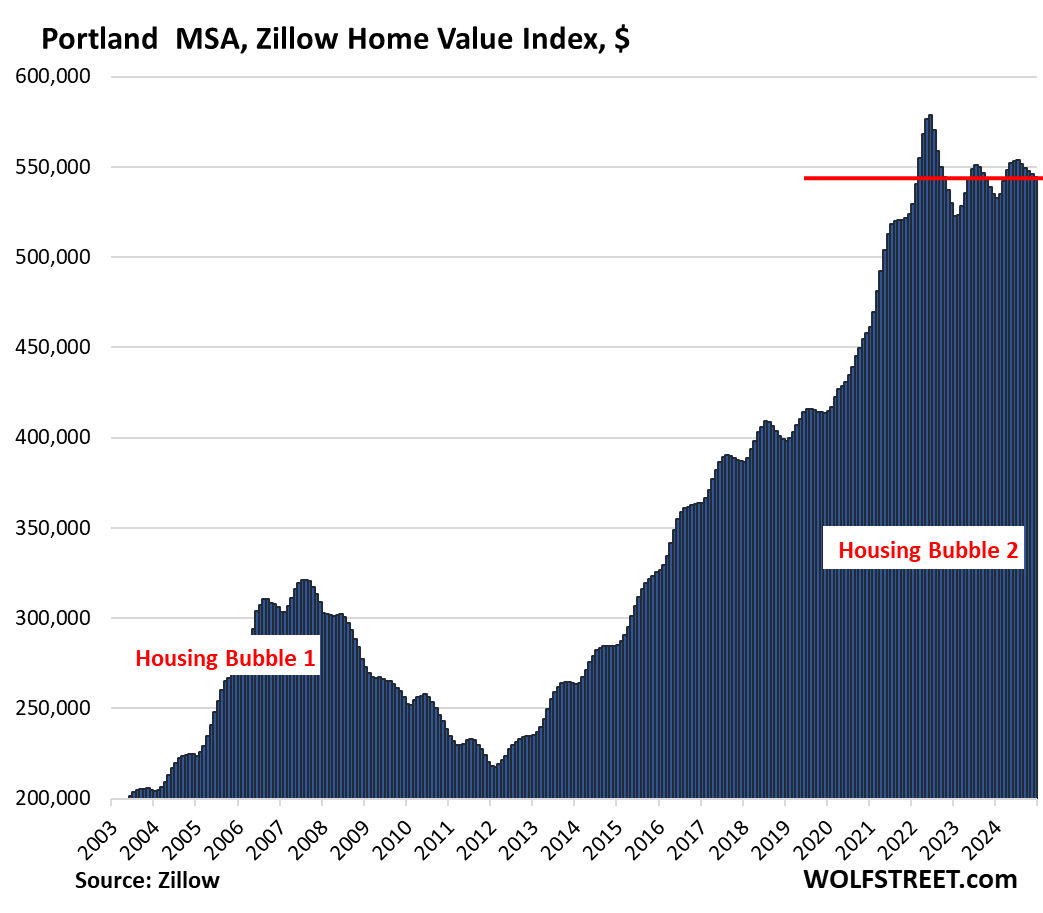
| Portland MSA, Home Prices | |||
| From May 2022 peak | MoM | YoY | Since 2000 |
| -6.0% | -0.3% | 1.8% | 217% |
Prices are back where they’d first been in February 2022.
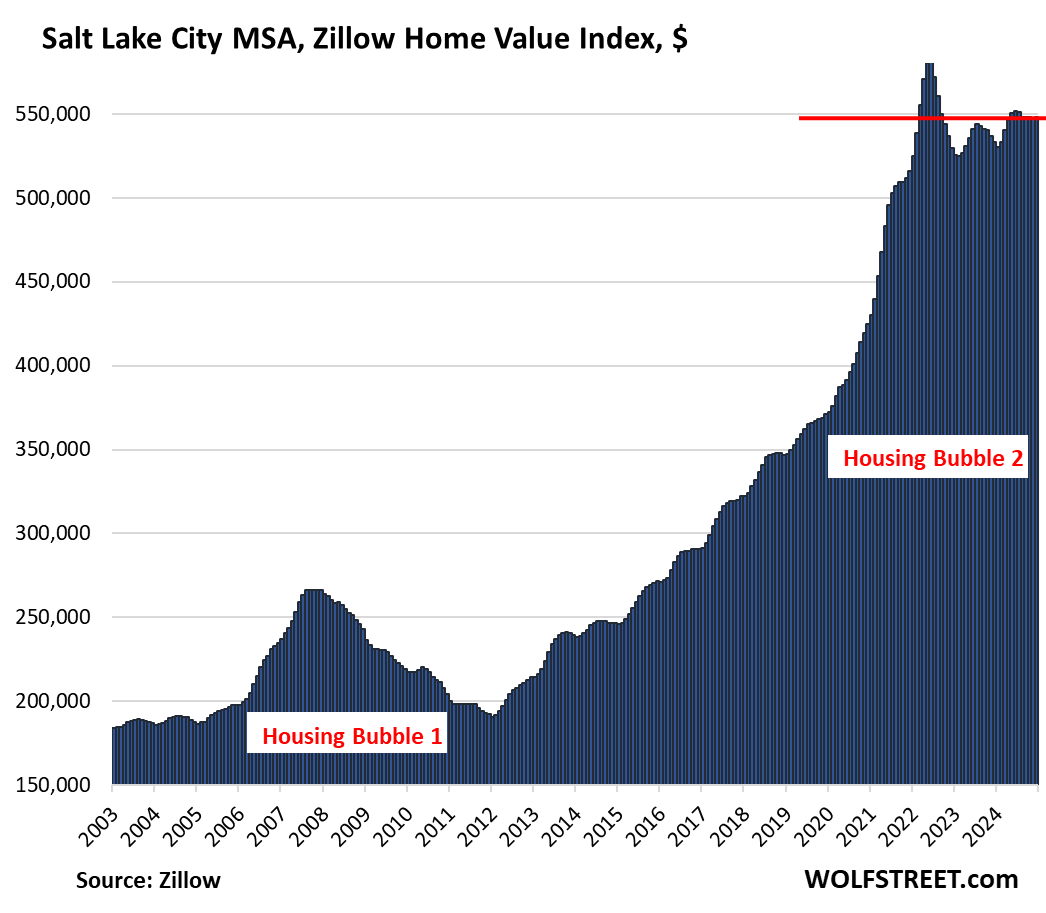
| Salt Lake City MSA, Home Prices | |||
| From July 2022 peak | MoM | YoY | Since 2000 |
| -5.7% | 0.0% | 2.8% | 214% |
Over the past four months, prices have remained essentially unchanged and are back where they’d first been in March 2022:
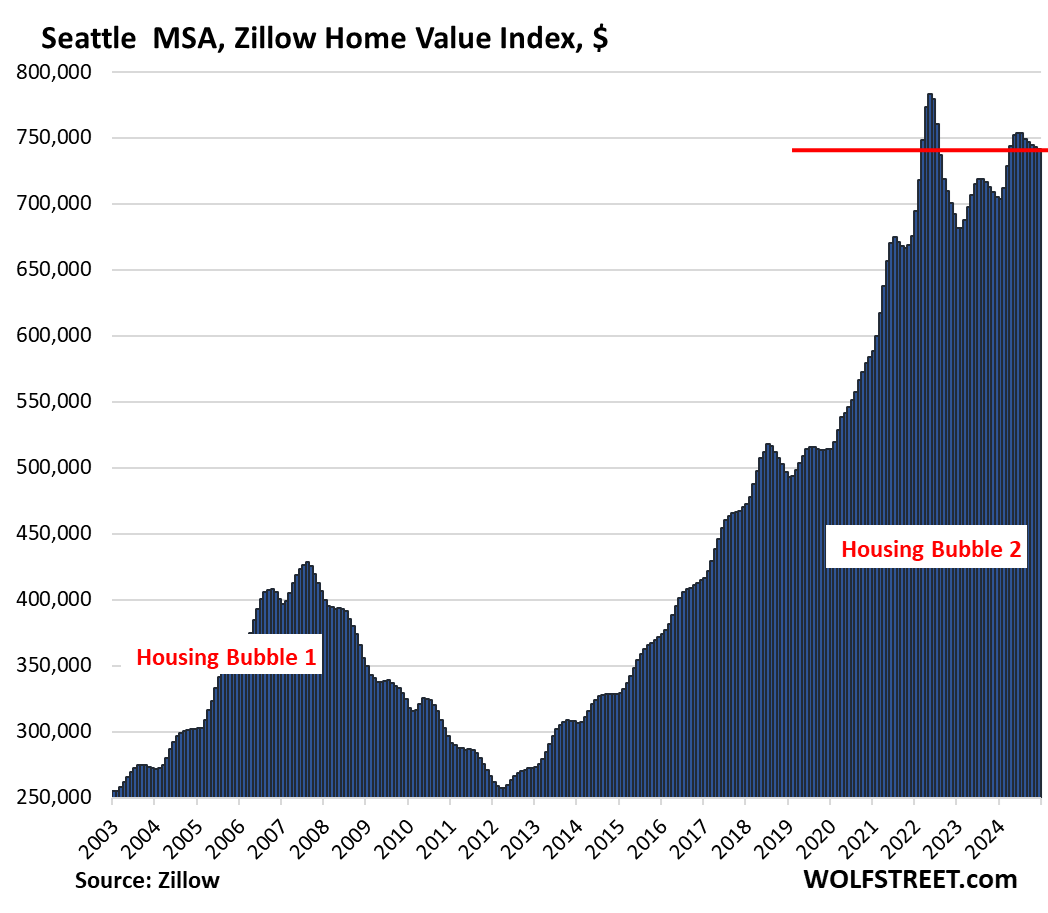
| Seattle MSA, Home Prices | |||
| From May 2022 peak | MoM | YoY | Since 2000 |
| -5.3% | -0.2% | 5.1% | 238% |
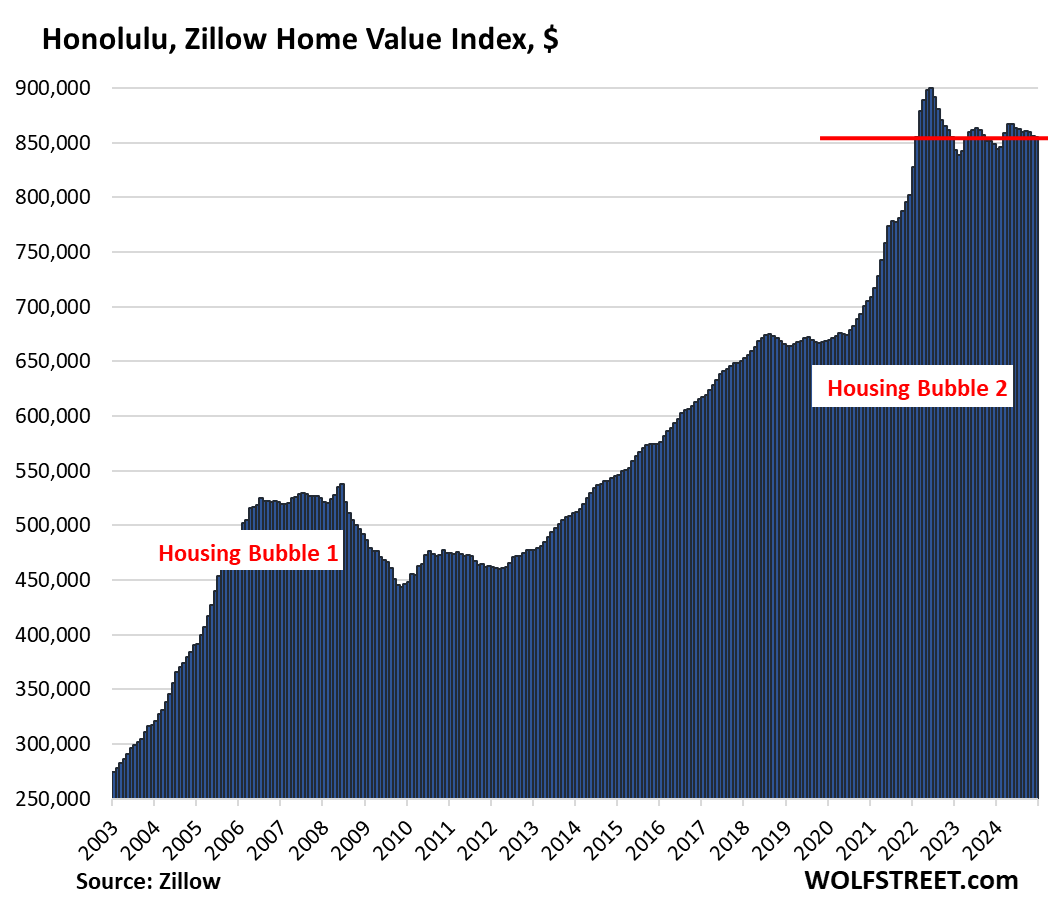
| Honolulu, Home Prices | |||
| From Jun 2022 peak | MoM | YoY | Since 2000 |
| -5.0% | -0.2% | 0.7% | 280% |
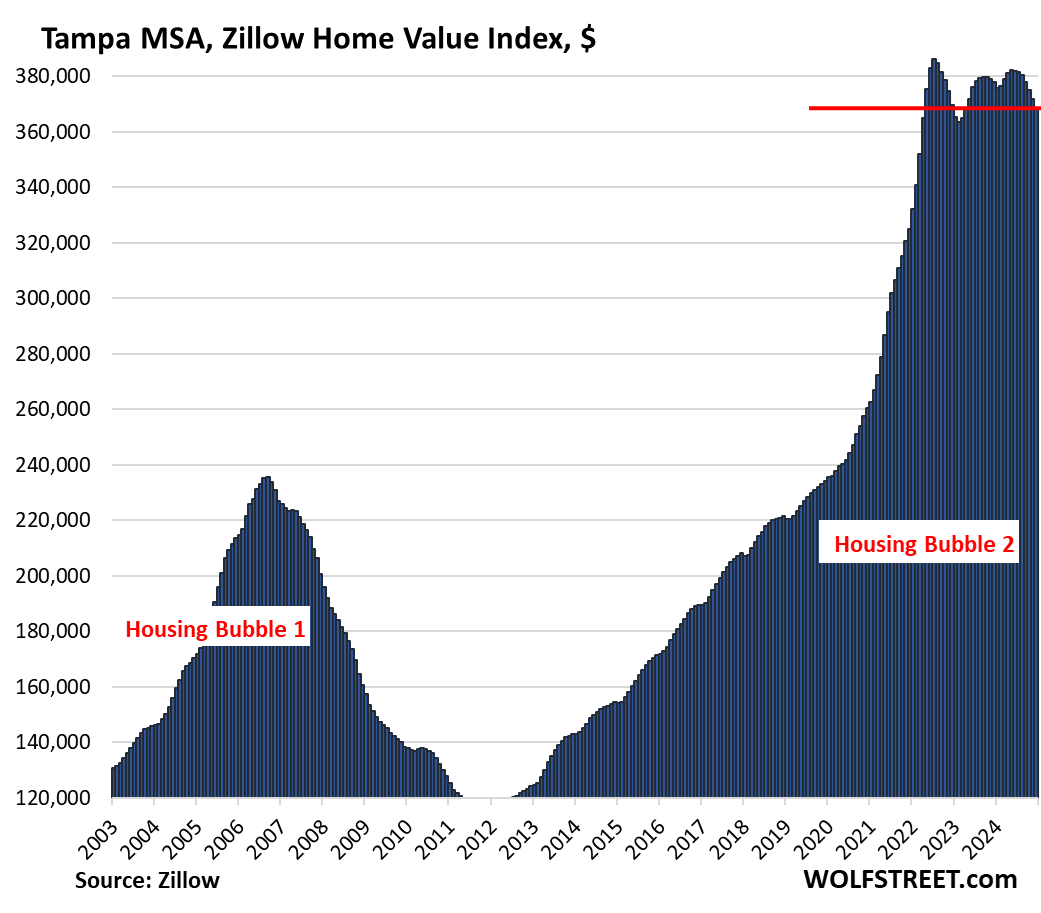
| Tampa MSA, Home Prices | |||
| From Jul 2022 peak | MoM | YoY | Since 2000 |
| -3.9% | -0.6% | -0.9% | 210% |
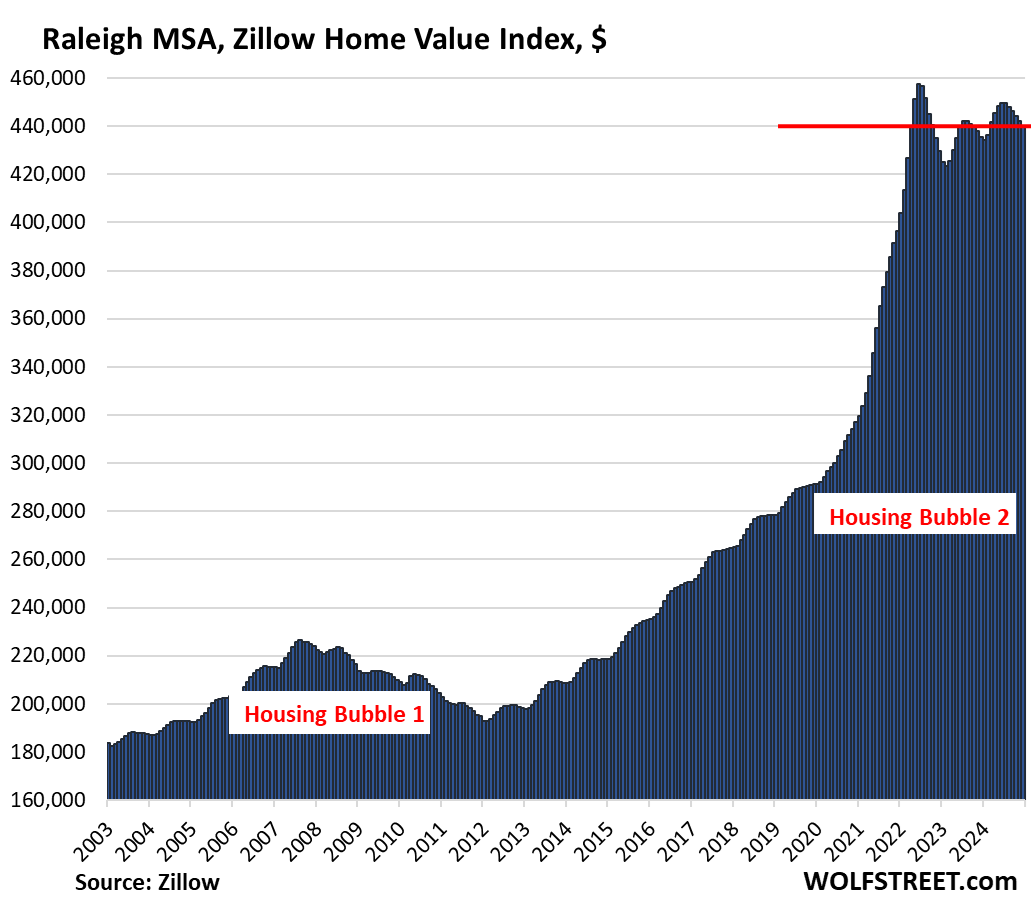
| Raleigh MSA, Home Prices | |||
| From July 2022 peak | MoM | YoY | Since 2000 |
| -3.8% | -0.4% | 1.1% | 157% |
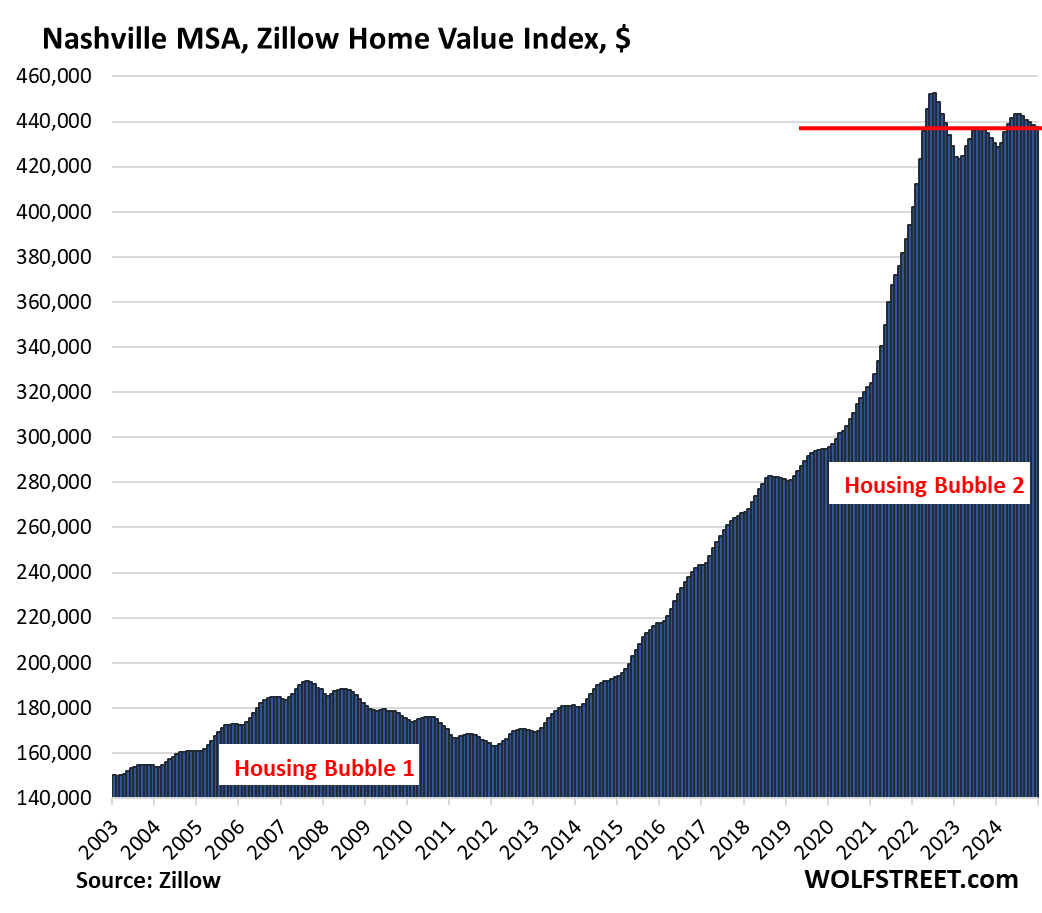
| Nashville MSA, Home Prices | |||
| From July 2022 peak | MoM | YoY | Since 2000 |
| -3.4% | -0.2% | 1.7% | 217% |
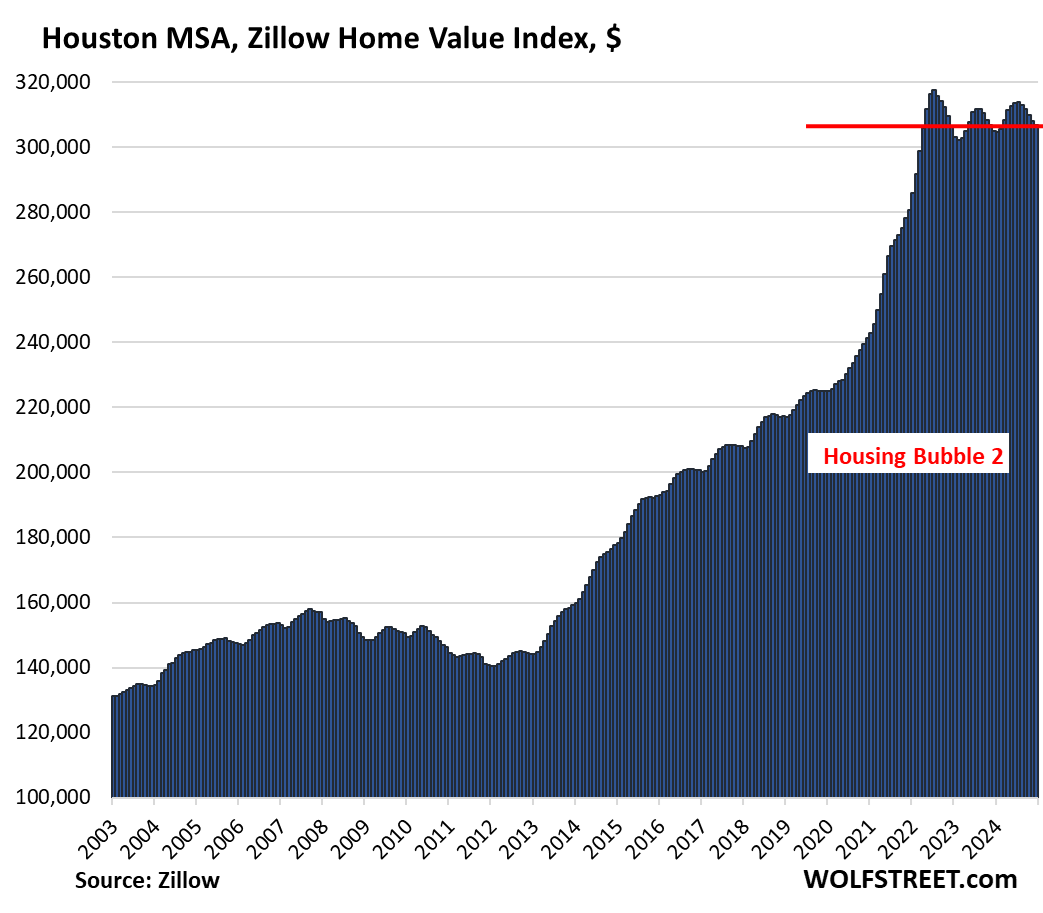
| Houston MSA, Home Prices | |||
| From Jul 2022 peak | MoM | YoY | Since 2000 |
| -3.4% | -0.3% | 0.6% | 150% |
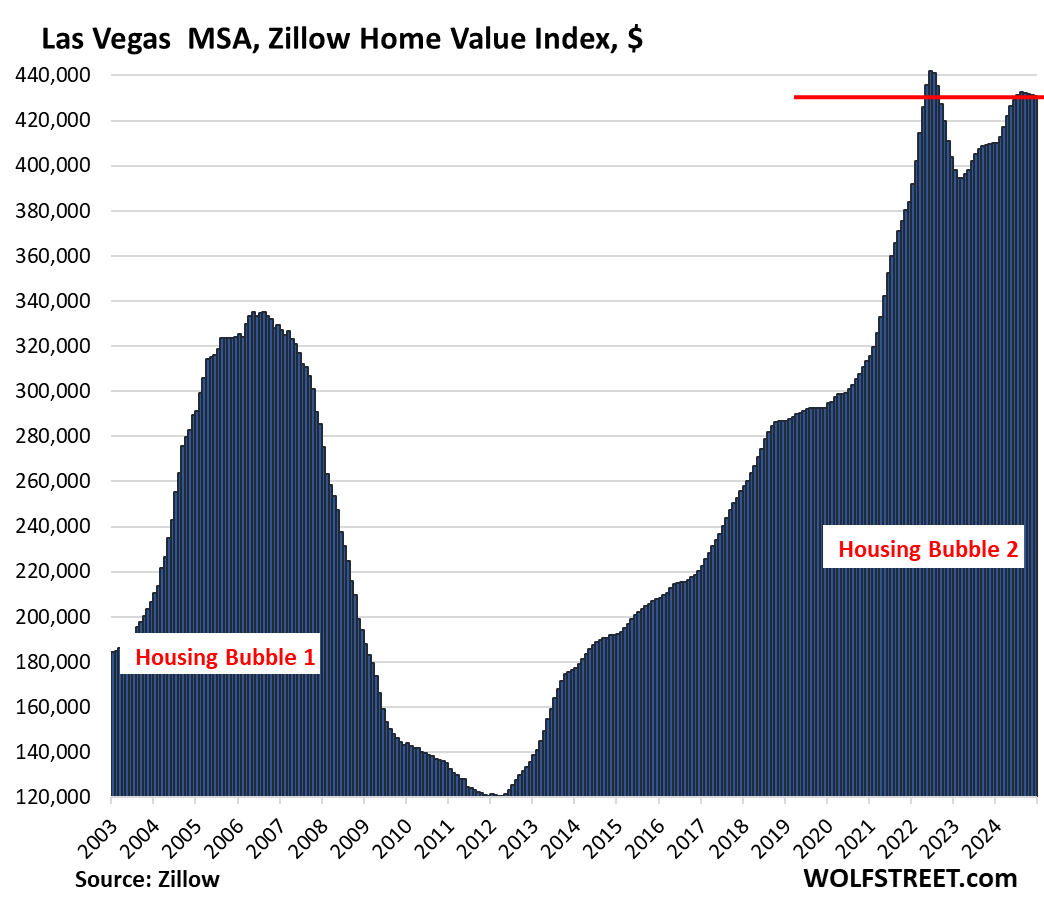
| Las Vegas MSA, Home Prices | |||
| From June 2022 peak | MoM | YoY | Since 2000 |
| -2.5% | -0.1% | 5.1% | 179% |
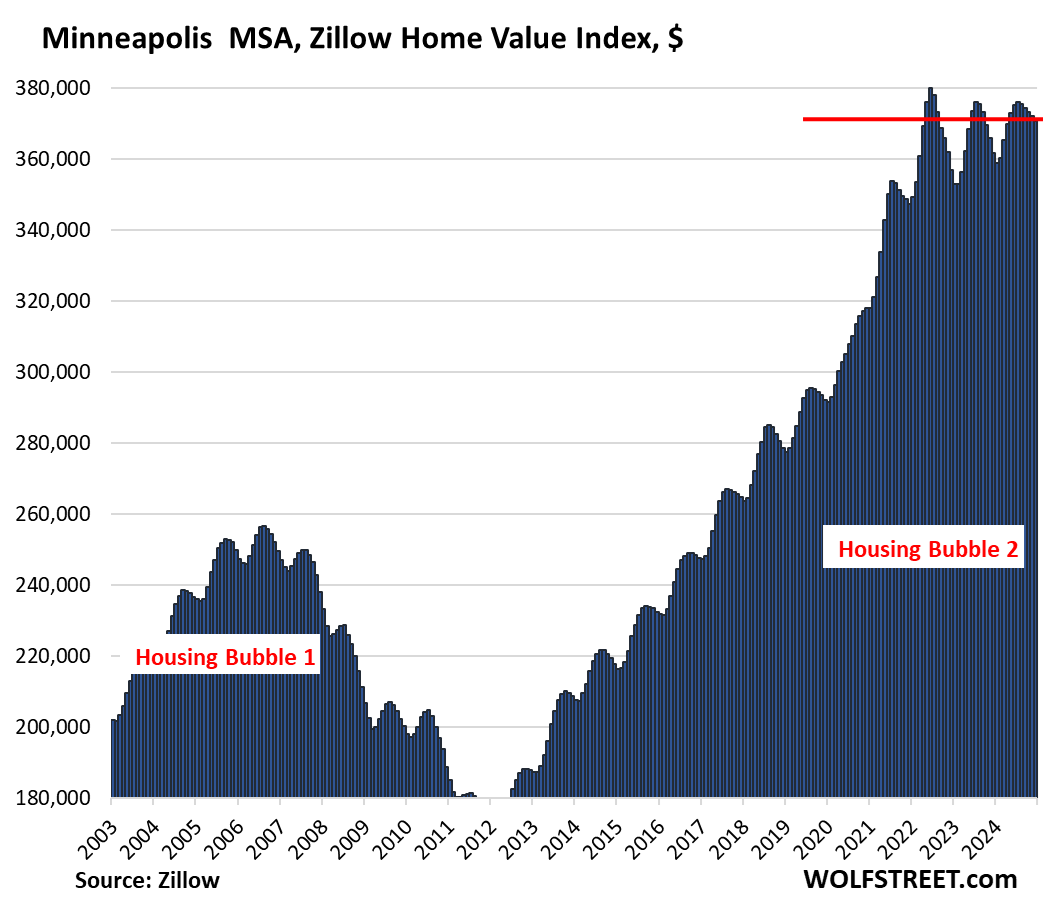
| Minneapolis MSA, Home Prices | |||
| From May 2022 peak | MoM | YoY | Since 2000 |
| -2.4% | -0.3% | 2.5% | 156% |
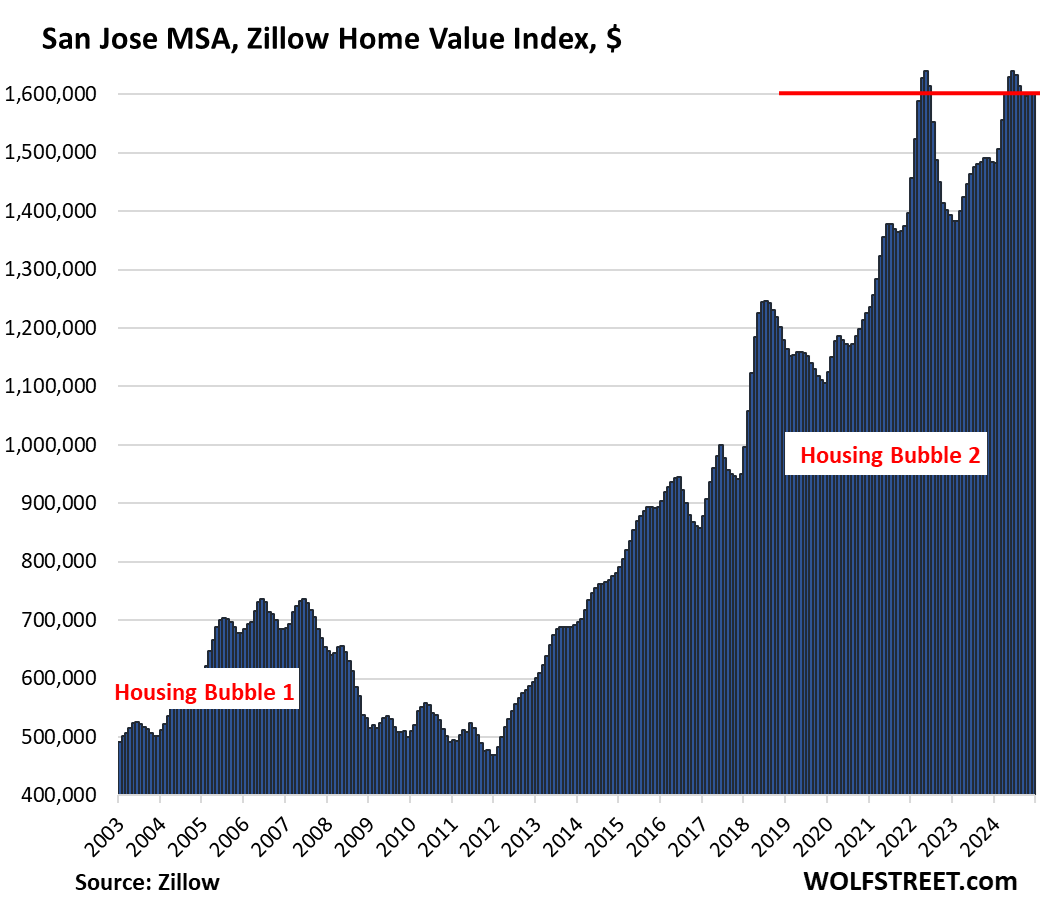
| San Jose MSA, Home Prices | |||
| From May 2022 peak | MoM | YoY | Since 2000 |
| -2.3% | 0.0% | 7.9% | 337% |
Prices have been essentially unchanged for the past four months.
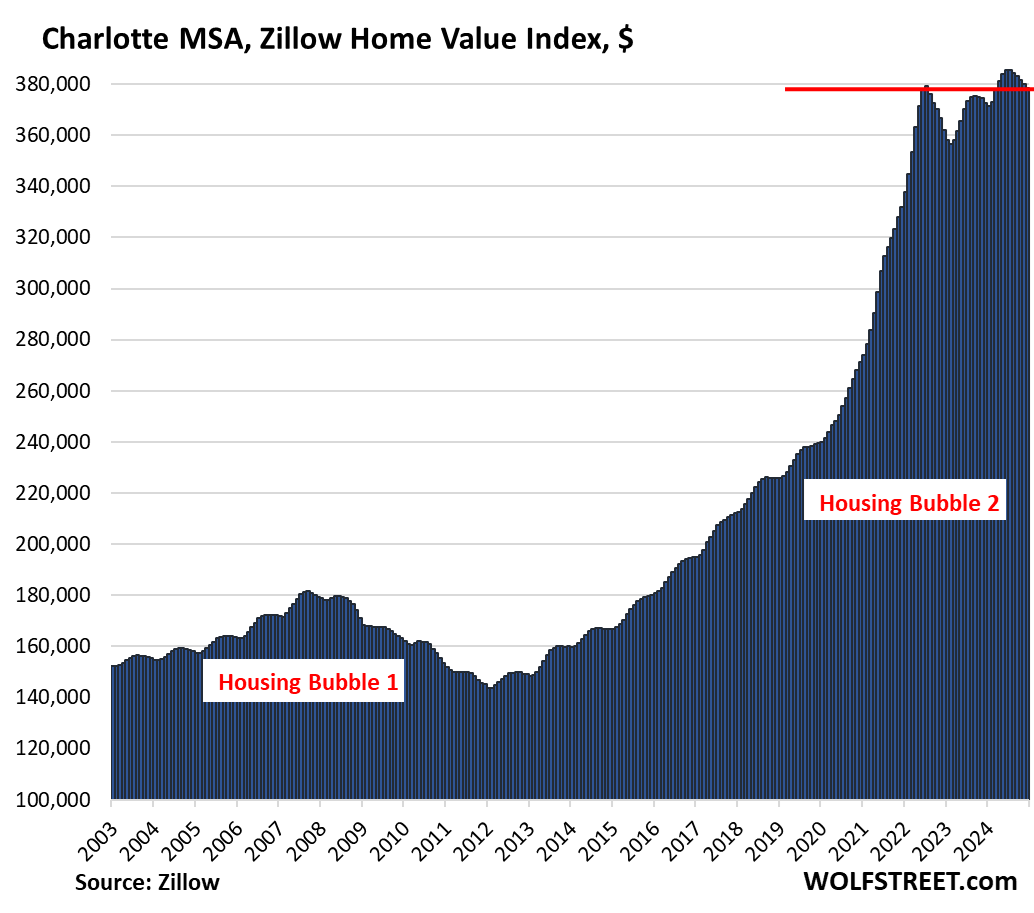
| Charlotte MSA, Home Prices | |||
| From June 2022 | MoM | YoY | Since 2000 |
| -0.2% | -0.4% | 1.6% | 169% |
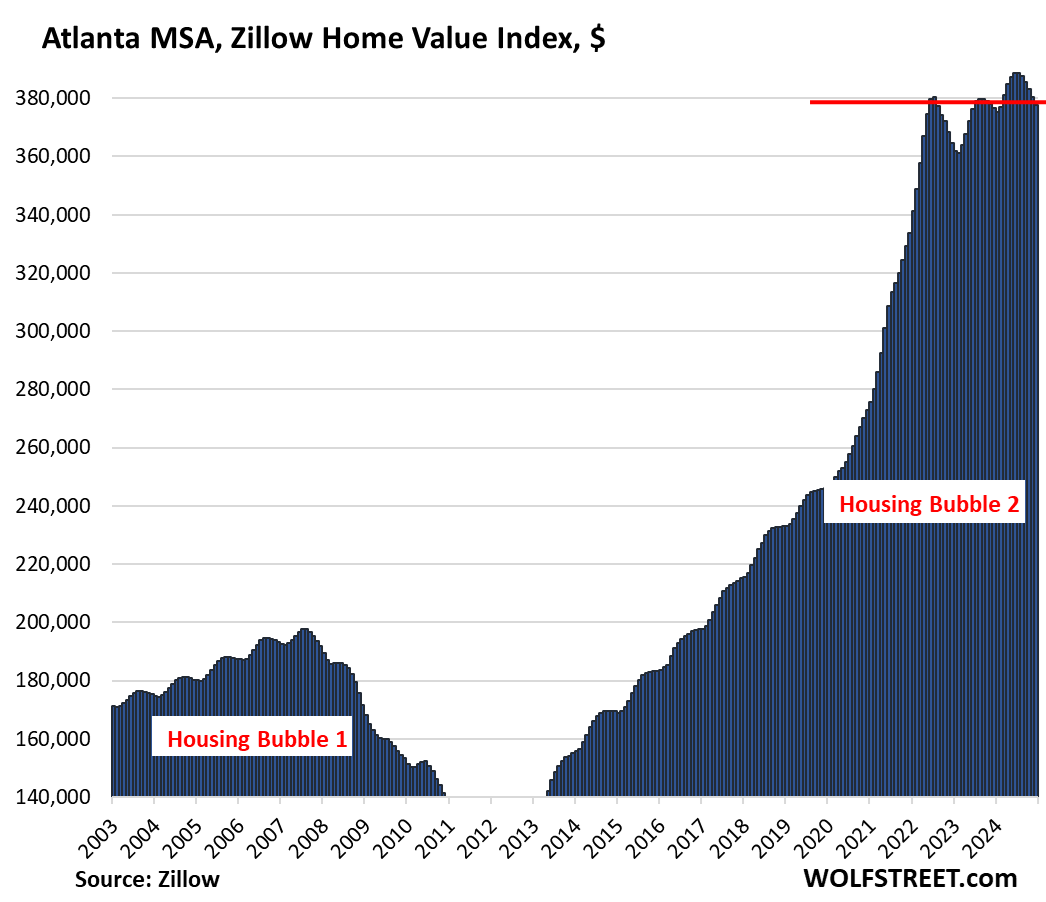
| Atlanta MSA, Home Prices | |||
| From July 2022 | MoM | YoY | Since 2000 |
| -0.6% | -0.7% | 0.3% | 160% |
| Orlando MSA, Home Prices | |||
| From June 2022 | MoM | YoY | Since 2000 |
| -0.01% | -0.6% | -0.3% | 234.4% |
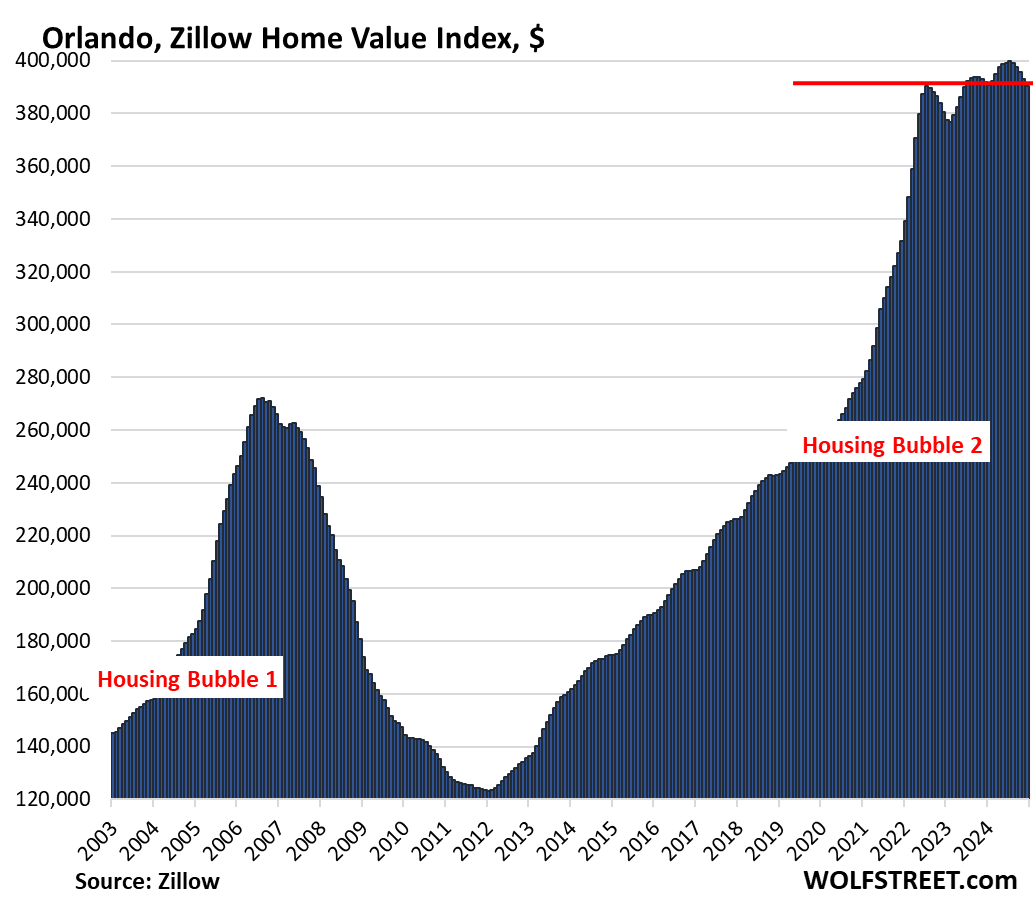
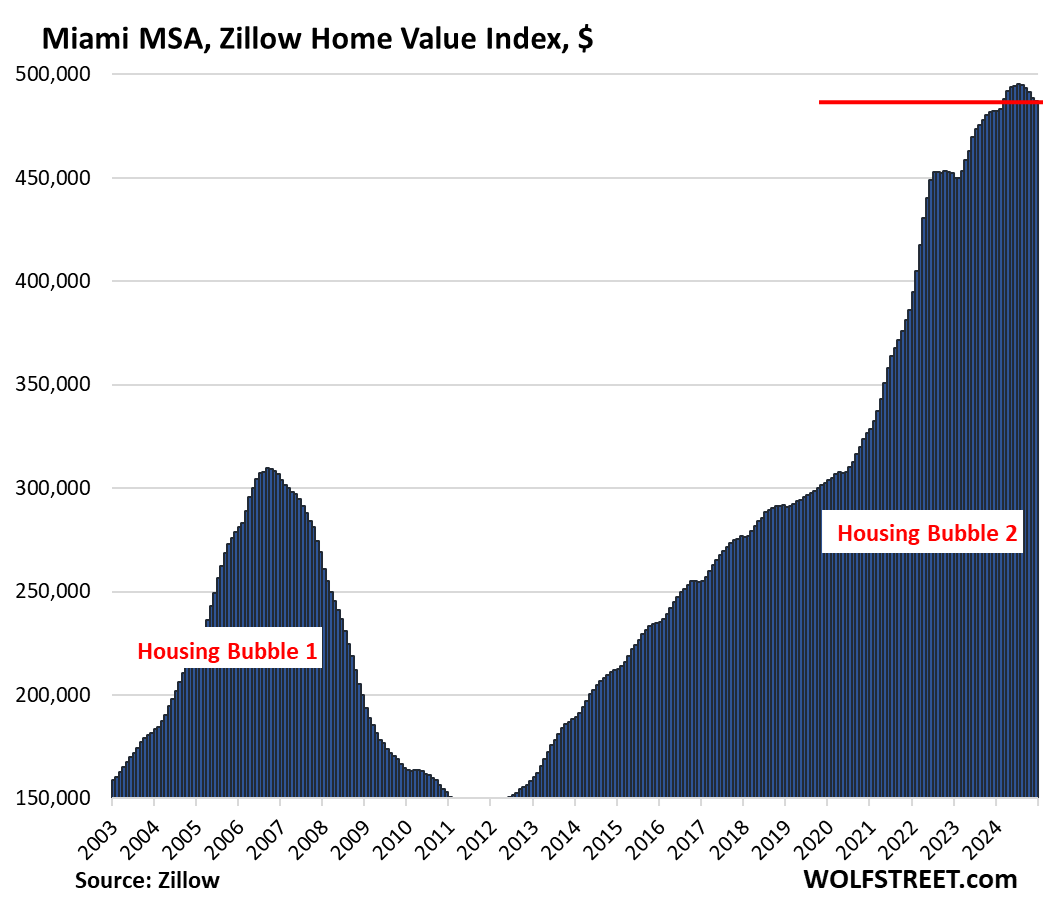
The next 12 markets have set new highs in 2023 or 2024, sorted by year-over-year gain:
| Miami MSA, Home Prices | ||
| MoM | YoY | Since 2000 |
| -0.4% | 1.0% | 329.4% |
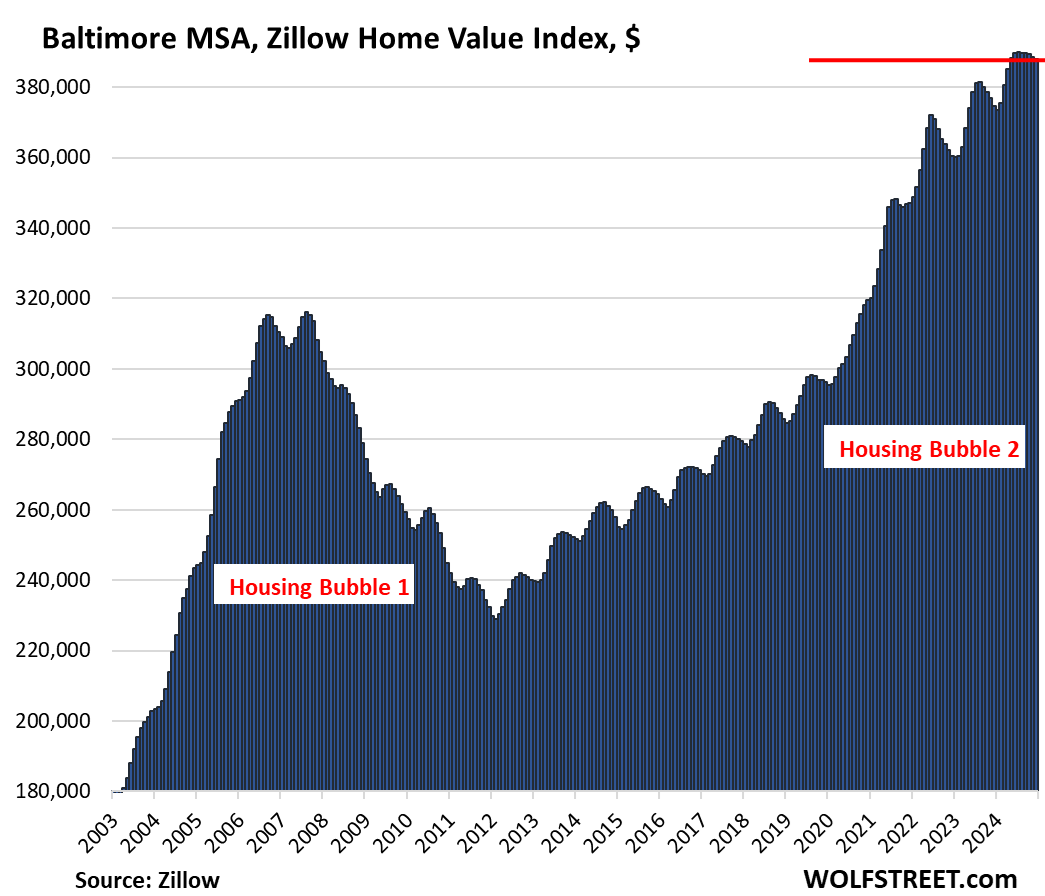
| Baltimore MSA, Home Prices | |||
| MoM | YoY | Since 2000 | |
| -0.1% | 3.6% | 173% | |
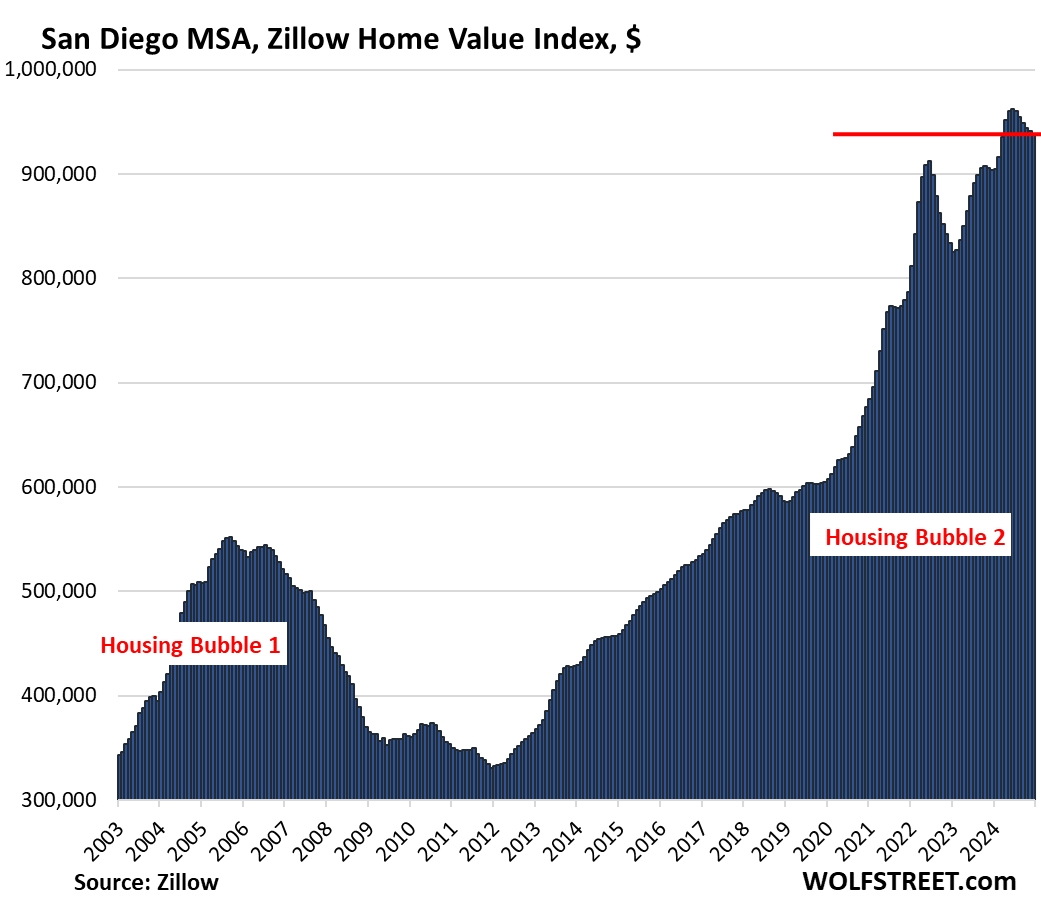
| San Diego MSA, Home Prices | ||
| MoM | YoY | Since 2000 |
| -0.3% | 3.8% | 333% |
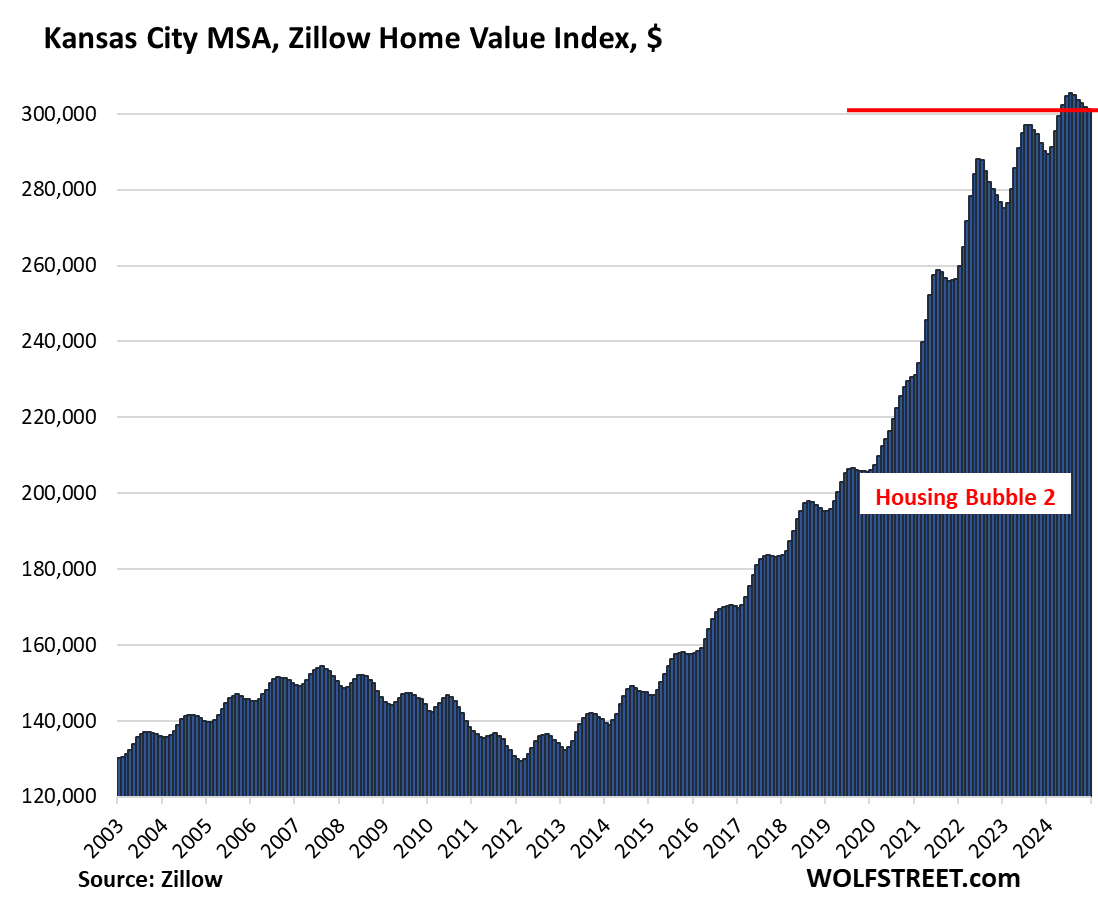
| Kansas City MSA, Home Prices | ||
| MoM | YoY | Since 2000 |
| -0.2% | 3.8% | 175% |
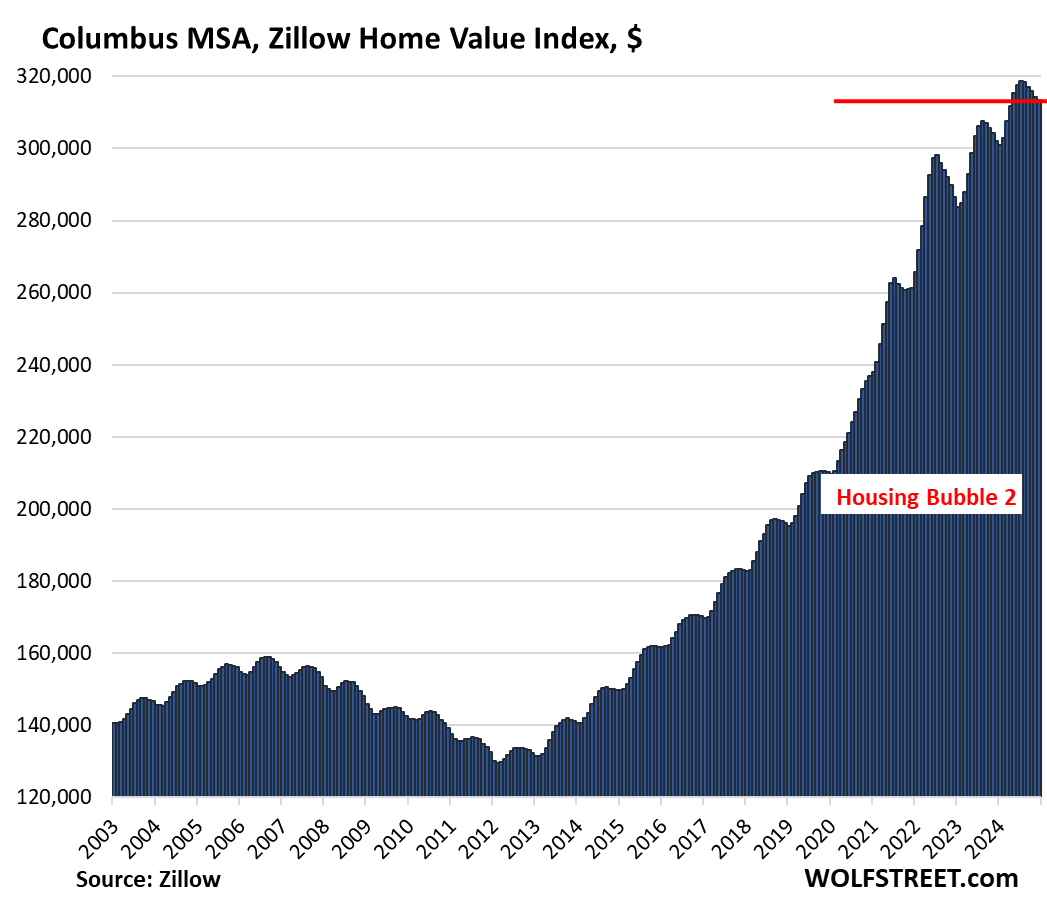
| Columbus MSA, Home Prices | ||
| MoM | YoY | Since 2000 |
| -0.2% | 3.8% | 153% |
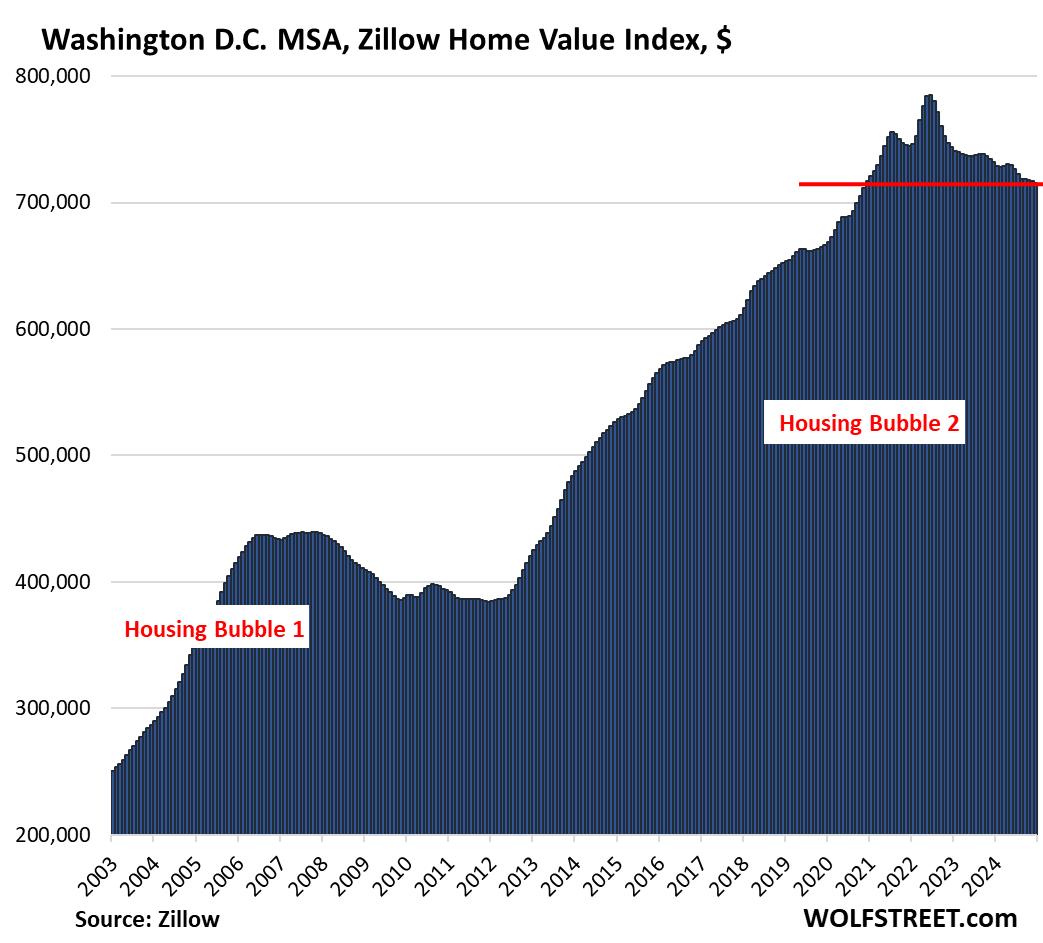
| Washington D.C. MSA, Home Prices | ||
| MoM | YoY | Since 2000 |
| 0.0% | 4.4% | 215% |
This is a huge metro that includes Washington D.C. and parts of the three states, Maryland, Virginia, and West Virginia.
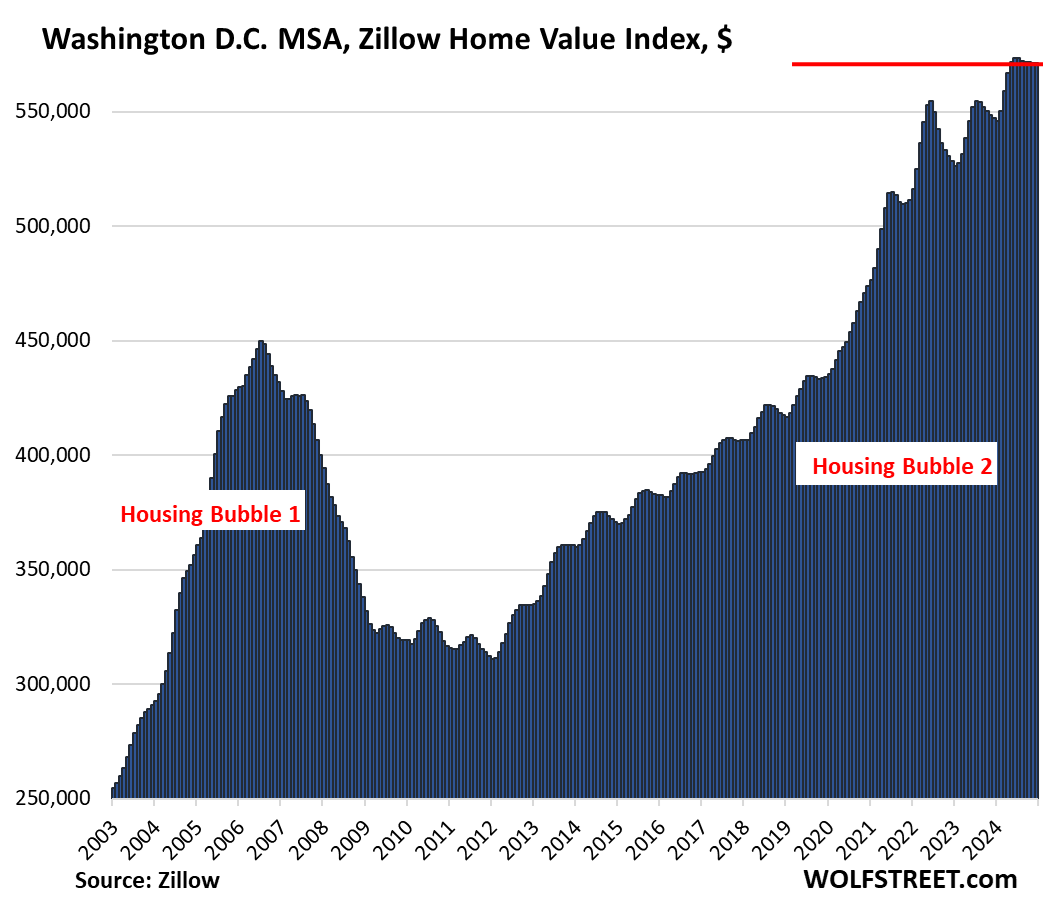
But in Washington D.C. by itself, so in the city by itself, prices of single-family houses, seasonally adjusted, have dropped by 8.6% from the peak, to the lowest level since November 2020. We will discuss the major cities with the biggest declines in house and condo prices in a separate article fairly soon, and Washington D.C. is one of them, but not at the top. This is just to show how there can be big differences between the metro index, which puts a lot of different markets into one bucket, and the index of a city by itself:
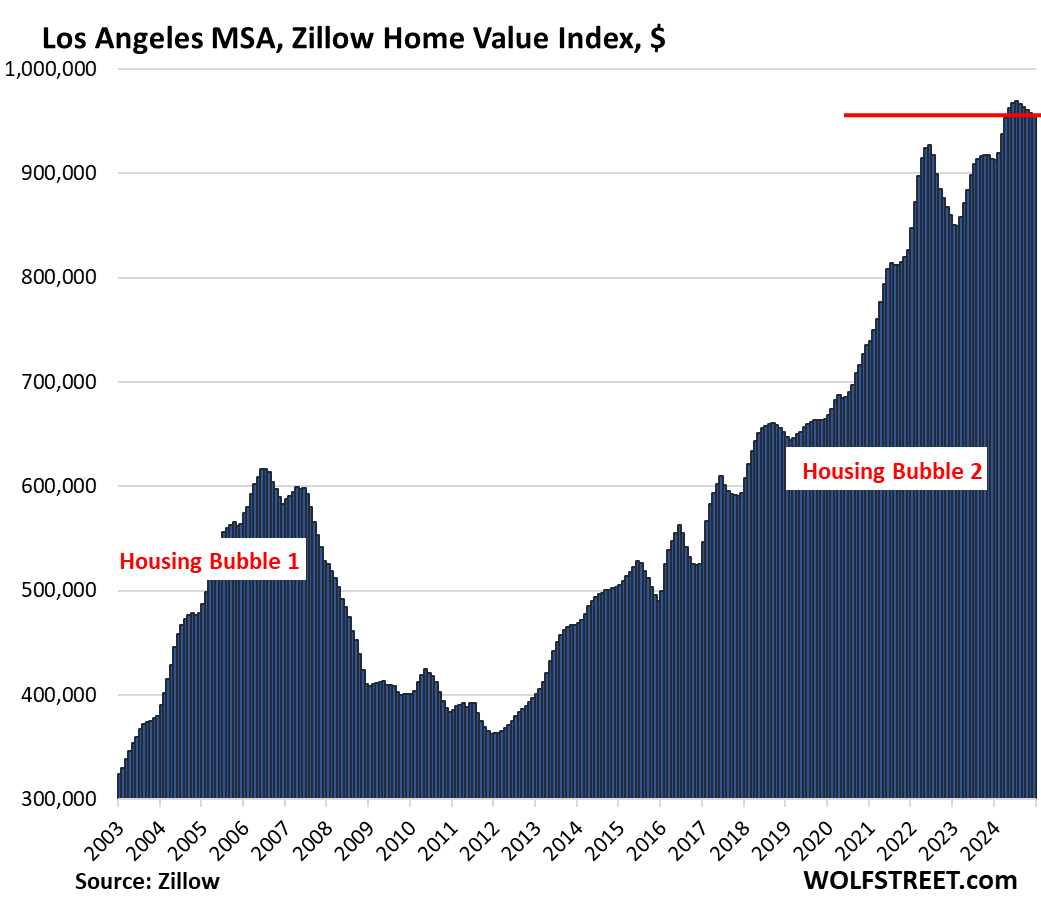
| Los Angeles MSA, Home Prices | ||
| MoM | YoY | Since 2000 |
| -0.2% | 4.6% | 329% |
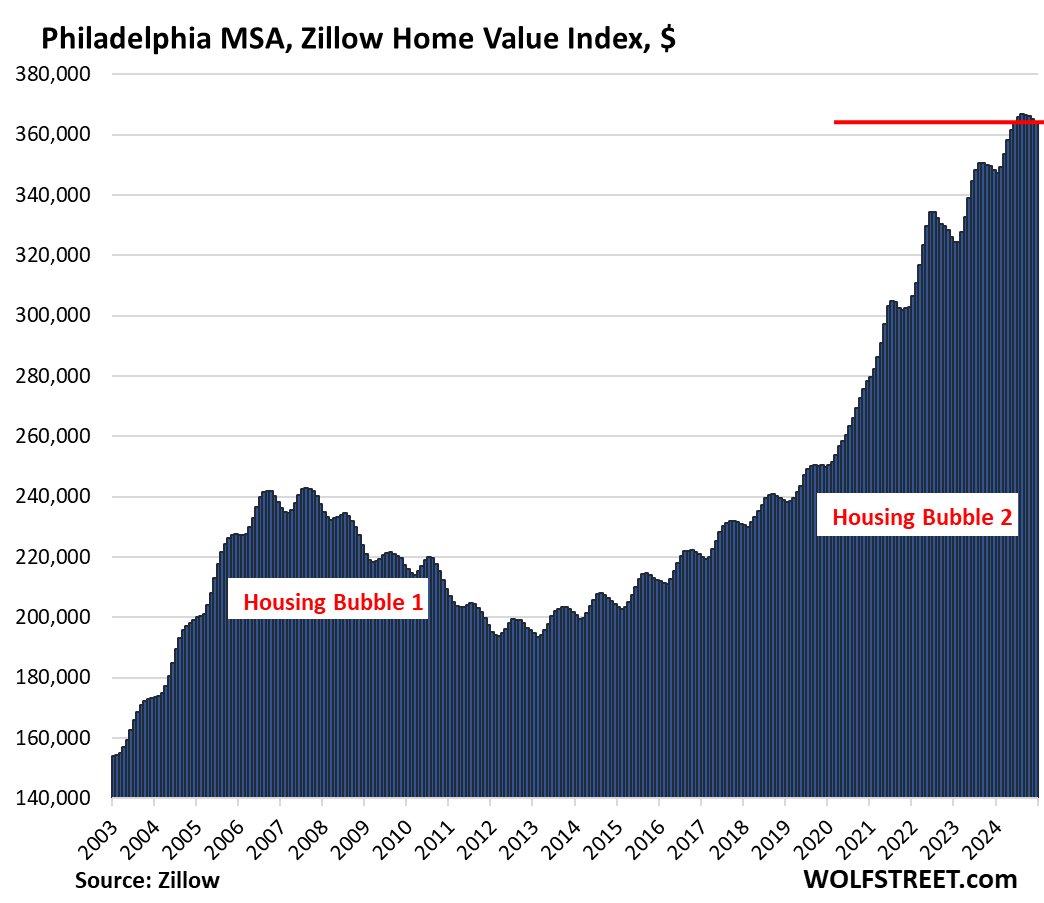
| Philadelphia MSA, Home Prices | ||
| MoM | YoY | Since 2000 |
| -0.2% | 4.6% | 200% |
| Boston MSA, Home Prices | ||
| MoM | YoY | Since 2000 |
| -0.5% | 4.7% | 224% |
| Milwaukee MSA, Home Prices | ||
| MoM | YoY | Since 2000 |
| -0.6% | 5.3% | 142.3% |
| Chicago MSA, Home Prices | ||
| MoM | YoY | Since 2000 |
| -0.3% | 5.4% | 112% |
| New York MSA, Home Prices | ||
| MoM | YoY | Since 2000 |
| -0.3% | 6.4% | 211% |
Enjoy reading WOLF STREET and want to support it? You can donate. I appreciate it immensely. Click on the mug to find out how:

![]()
This bubble is still fully inflated. It just stopped growing…. The only ones hurt were those who purchased in the past few years and need to sell, which one should not be doing if they just purchased the home. Sorry flippers….
Flippers and AirBnB speculators should get what they deserve, but I suspect the return to office workers have also been hit hard. I worked for a tech start up during COVID and was surprised by how many people moved far a field from SF HQ to places like Boise. They were banking on a future of total remote work that did not happen. I feel for the folks that tried to make a change that they hoped would be durable.
i don’t feel for them at all. they intentionally moved to the middle of nowhere, far from their jobs, hoping that the “work remote” which was always presented as temporary would stay that way. even by the middle of 2021, it was clear that offices were moving back to a hybrid approach.
they rolled the dice and lost. and don’t forget that in doing so, they bid up the prices, putting extreme hardship on the locals. nobody forced idiots from the bay area to go to boise and buy houses for 800,000 usd that were selling for 400,000 only two or three years before.
I wouldn’t worry about them, they’ll just job hop to a company that allows for remote work. There’s plenty out there.
the problem is, not at the salaries they expect. full remote jobs are much fewer and far between than they once were, so companies that offer it know they can pay less.
Yep, fully inflated and peak pricing, especially when you factor in interest rates. BTFD is still the name of the game in this 100% speculative orgy they call an eCONomy.
For nearly all of them Y/Y growth is positive, so the prices are growing again after the 2022 peak. Don’t see a correction happening here
Nonsense.
1. 6 of the 33 have negative yoy.
2. In addition, the month-to-month declines in a bunch of other markets have whittled down the YoY positive figure every month for months to a near-nothing range between +0.3% and less than 2%. Two or three more month-to-month declines, and those markets are negative YOY. This happened to three markets in December already.
3. If the YOY rise shrinks every month with negative month-to-month readings, then the price is falling, and you can see that in the charts, which is why I show you the charts so I don’t have to listen to this nonsense.
4. When the YoY goes from +7% or +10% to +0.3% or +1.7% after 8 month-to-month declines in a row, the prices are falling, and this is happening to a bunch of markets, where the month-to-month declines whittled down the big YOY increases to near-nothing. A couple more month-to-month declines, and those markets too have YoY negative figures because prices have been falling for months in those markets.
To add to Wolf’s response, keep in mind that those prices are nominal, not inflation-adjusted. In other words, some of those markets are likely flat with their 2000 or 2007 peaks when factoring in inflation.
But will there be more MOM declines? January – June prices have typically ticked up again. Are we sure this isn’t just the return of seasonality?
“Are we sure this isn’t just the return of seasonality?”
Some of these markets are in multi-year downtrends. That’s not seasonality.
Unfortunately my local RE mkt isn’t tho…
With sales volumes off by 33%+ from 2022, it is only a matter of time before home prices – like Wiley Coyote and his anvil – plummet.
(See also, 2007).
The volumes have evaporated because 33% fewer people can afford insanely inflated homes when interest rates are 6% instead of 3%.
Just imagine how much demand volume will evaporate at 8% or 9% mortgage rates.
Seattle has tripled since 2003.
How much will houses have to fall for a correction?
If this is the new normal for interest rates could it also be the new normal for home values?
I guess we will see.
while I’m seeing compression and large discounts
I also am seeing the REALTOR trick of pulling listing for short period and then coming back on market at much lower price
—
Interesting fact – realtor friend who sells lots of houses admitted 2024 was not good
however starting last week his phone is off hook
and now he’s taking buyers again
even high priced($800k) homes are showing
he has one in escrow with 50% down
—
and we’re holding our breath for LA folks coming over – we don’t want them
Don’t worry, relatively few from Pacific P and Altadena will consider moving to your area. It’s not a good substitute.
Stop reading the Realtors Board before you have had your coffee!
Are you calling $800k high-priced for Seattle? That’s below average. Or are you in another part of town
…Louisiana?
may we all find a better day,
Spring selling season is almost upon us. Hope springs eternal for the real estate industry. good luck to them..
“Spring selling season” refers to VOLUME, not prices, it refers to sellers putting a large number of homes on the market, and buyers buying some of them, and so volume rises in the spring. It’s about volume, which is what Realtors care about because that’s how they make their money.
Prices in only some of the markets are seasonal, in many markets, prices are not seasonal. See charts above.
The National Association of Realtors’ “Median Price” is seasonal not because actual prices are seasonal, but because the mix of what sells changes in the spring, with more higher-end homes coming on the market and selling, and thereby more higher-end homes are in the sales mix and shift up the median price. Median prices are shifted by changes in the mix. We discussed this year many times.
But these prices here are NOT median prices at all. Nothing to do with median prices.
I live in the Tampa Bay area and that chart still screams Sell. We have a long way to go to correct for the Covid free money bounce.
Around my town, I am starting to see Auctions start up again…in conjunction with overall price declines. ..this coming year could be the start of something similar to 2008-2011 timeframe.
Meanwhile, hopeful first time buyers have begun to die from old age.
For SoCal area, wonder how many of the houses affected are owned by AirBnB owners that got into the mad rush of buying in the last 2-3 years. It’ll be interesting to see what the fall out will be for these owners, especially for the ones that want to get out at the top but now didn’t get a chance to…
I witnessed the buying frenzy as if Airbnb’s were easy money. Though many amateur investors came and went, bought and sold within 18 months, the large, pro operators are slogging through since they already have 4 or more cash flowing properties.
For example, though I am not a pro operator, I bought in 2021 but didn’t begin operating until summer 2022. By then the bubble in my area of the Coachella Valley in Southern California was at a peak. Luckily for me I had paid about $100,000 less than what prices were in 2022. Although Airbnb supply is high, those of us priced in lower will be able to weather the glut vs those who came in from 2021 through 2023.
From my observation, the Airbnb housing bubble has popped in my area.
Coachella valley is epitome of short term rental bubble
Prices sky rocketed so much that it priced regular working Joe so much
I am keeping an eye on home prices in Palm springs as have friends and realtors there and seeing slew of home price going down over last 2 years
I believe over time Coachella valley would be worst impacted
It’s not what you paid that determines if you can weather the bubble. It’s in the presence of excess supply, can you cover your mortgage, taxes and expenses with your short term rental income? i.e. can you rent enough nights at high enough prices.
Typically as excess supply comes on a market, there’s more competition for the same demand (or as the COVID yolo travel bubble deflates less demand). Thus resulting in less nights booked, lower nightly rates, or both.
My guess, an inconsequential amount, unless maybe some coastal areas
(as in ON the coast, vacation area).
Right now, vacation rentals in the area are in very high demand from people who lost their homes. They need a furnished place to live until they figure out what to do next and are done battling their insurance company. That can take time.
Yes, astute point Wolf. My neighbor is still renting out her house as an airbnb in Tampa to folks who lost their homes from hurricane Helene (September 2024).
The AirBnB thing will come into play with insurance claims.
I wonder what the relative peak width between housing cycles looks like. Do you have days from before 2003? Can we see a correlation between the the bubble peaks and the minimum between them?
This run up had obviously been longer so the question is whether the pull back would look similar or whether the nature of the cycle curves are independent of what the curve looked like before (when rising for instance).
This housing market is insane, I predict the bubble will pop this year.
PS: Great article 👍🏻
I am curious about how local disasters affect real estate. Did the hurricane damage to the western Carolinas affect home prices in eastern Carolinas? I genuinely do not know and I am curious.
I ask, because as I have mentioned earlier on this site I live in Las Vegas and am curious about how the California fires will affect real estate. Background: I have lived in Las Vegas for a six years. I have owned property in Vegas for more than 20 years, but it was with other people and was more of a rental/vacation home.
For the first 5 years I lived here I rented with the intent to eventually buy. The problem was that I got a great rental price that never increased.
So I became “rent trapped”. I wanted to buy a house (and could afford it) but the rent I was paying was so absurdly under market that it was really hard to pass up such a good deal. My wife has always wanted to move into a place we could call our own so there was conflict.
We eventually found a townhouse we both liked that was expensive, but not insanely market priced. The reason we got it semi-cheap was it needed some work, but it was mostly superficial stuff like paint and spackle. The other reason was that it was in an area (just SW of the Strip) that was adjacent to some not so nice areas. Thing is, the areas itself was perfectly fine and there were also some extremely nice areas right near by. It was a gray zone. What sold me was that the bad areas are improving. Alligent Stadium has been built and the area is extremely close to the strip so it was more valuable than the crappy strip malls that area located in the bad areas. Already so much of the bad areas have been sold and improved. If the economy stays out of recession for just a bit longer the area will be gentrified and built up. It is too close to the strip to be crappy. Also like I said, there are some extremely wealthy homes just as close (like $20 million dollar homes).
Anyway, after following the Vegas market for over 24 months,bought a townhouse a year ago. Since then I have tried to keep up on the market just for curiosity sake.
Since then the market has bifurcation into different segments. The highest properties have done well (and always will) because there are some many people moving to Vegas from California. A million dollar house in LA, SD, or the Bay Area can be sold and a much bigger house can be bought here. For the middle and lower end of the market, it has become split. Townhouses and condos are doing fine. No drop maybe even an ever so slight increase. Single family homes have cratered. They sinply are not selling.
Now much of California has started on fire. Two people I have talked too who are not the nutty, Fox News crazy conspiracy types have mentioned that the Airbnb rental rates in Vegas have gone through the roof. I haven’t verified, but I have seen stories about how the hotels in Primm, Nevada (right on the border with Cali) were close to closing but are now renting out rooms at $29 per night and are packed.
The final straw was I talked to the real estate agent who helped us buy our house yesterday (we remain acquaintances). He said that in the past week he has done a dozen monthly rentals where normally he would do 6 a month. Almost all of the renters were from California from displaced places due to fires.
I cannot help but think this will help LV homes prices in the medium to long term, but I am just wondering what the affect will be and wondering if I can take advantage of it.
The LA disaster promises to have a lasting effect on CA’s and even beyond real estate. Of interest is an article in the 1/13 Naked Capitalism blog. It is a long article that mercifully avoids blaming the fish. Of interest is that of the 700 homes destroyed by the 2020 Santa Cruz mountains fire. only 95 are rebuilt and occupied, and nearly 2/3rds are not being rebuilt. It appears that the primary wildfire insurer is California’s state FAIR Plan and not commercial insurers. The state plan is likely insolvent. I was surprised, if true, by the comment that in 1971 the population of California was 19 M, and that LA’s current population is 20 M. As with coastal FL a concern is that there are places due to local environmental risks that should not be rebuilt. The history of the availability and use of water in the American west is the topic of Cadillac Desert the American West and Its Disappearing Water by Marc Reisner first published in 1986.
Cadillac Desert is an awesome book and everyone should read it, especially those living in the West.
We are assuming that we either won’t be able to insure our next house, or that the market will come up with an insurance product that will be a) exorbitantly expensive and b) won’t cover the full value of restoring the home and its contents – basically just enough to cover any bank losses.
We’re going to set aside a fund that we contribute to monthly (probably index investment) and if we never use it the kids get it after we pass (or we use it for long term care).
Insurance as a profit margin product is probably done for, maybe it shouldn’t have ever been one. I would lay odds though, that future modeling for fires, hurricanes, tornados and other disasters is going to need a significant update and where people can live and still be insured will constrict. Which leads back to that housing affordability discussion.
I believe the days of full insurance coverage for the average person are likely over.
Reisner also wrote – A Dangerous Place: California’s Unsettling Fate – “an informed look at an inevitable rendevous with catasrophe”
I live in Central North Carolina (Raleigh Metro). Home prices here have not been impacted whatsoever by the hurricane that was localized to Western NC. All real estate is local. People still want $250,000+/acre of uncleared land in flood zones around here. It’s nuts.
However, between the erosion on the coast and now the hurricane in the mountains, insurance costs statewide are probably about to balloon — regardless of whether you live in one of those regions. Risk is shared, unfortunately.
Weak governments here in the Mid-west are also allowing builders to to do their thing in flood plains. Plenty of areas here along rivers (and the big lakes) have flood plains. The big lakes here have a high and low water cycle. When the lakes are high, a strong wind can send a surge of water into residential areas. Buyer beware. Never buy a residence in a flood plain.
“wondering if I can take advantage of it.”
Lots of people are wondering how they can help people who have lost friends, family members, their homes and all their possessions. Losers!
One can do both. For most, the only way they can reliably help others is to be solvent themselves.
Just curious, what are these “nutty, Fox News crazy conspiracy” theories you’re talking about?
All of them? How does one choose….
I thought by now mortgage rates would be decreasing and housing prices increasing but instead mortgage rates have bounced around for 2+ years between roughly 6 to 7% (with a brief 2 month runup that peaked close to 8% around October 2023). This bouncing around could also be seen in a lot of these housing index charts, indicating to me the important role mortgage rates are playing in this housing market. The new administration seems to favor lower interest rates, whether that will translate to lower mortgage rates we shall see but it would be wise to keep an eye on mortgage rate trends to help predict what direction housing prices will take.
Historically whenever inflation rates have surpassed 5%, it’s taken on avg 10 years to get back to 2%. Bank of America and a couple other financial firms discussed this in 2022. I would expect high interest rates/mortgage rates for the foreseeable future unless there’s a recession.
Even if the fed cuts. The yield curve is still normalizing. If say the new neutral rate ends up being 3%, a 2% premium puts the 30 yr at 5%, which puts mortgages at 6.5-8% assuming a 1.5-3% margin on the 30yr.
There won’t be mortgages below 6% again without a recession.
“puts the 30 yr at 5%”
The 20 yr is already >5%.
Wasn’t saying it couldn’t go higher. Just probably not lower.
If you really want to have some fun take a look a what happened to the 10-year after those bouts of >5% CPI. The historical response lag and magnitude would suggest that there’s a long tail on this donkey and it’s just getting started.
Yea, the new administration promised low interest rates and low inflation.
They either don’t understand basic economics or simply conned half the country (most likely both).
So…. What _should_ the price be?
If these prices are fluffed up by short term issues, what would be the ‘long term issues’ price level be?
So much for the American dream.
It’s called the American Dream because you have to be asleep to believe it.
RIP George Carlin
The American Dream is being a capitalist and not owning a home.
Dear America,
Here in Boston we’re completely full. There’s no more room. Please stop buying houses and moving here. Thanks.
Really? Not according to Mayor Wu. Looking to build “Affordable housing. Look at MBTA communities, just settled by Ma. Supreme Court…gotta build!!
I wish I had the capital to take advantage of this. Gonna be a big opportunity here.
I really wonder where they want towns like Marblehead to build more housing… it’s literally a peninsula that’s been completely built out. Unless they zone away the conservation land or wildlife sanctuary…
And the two bus routes that have one bus per hour don’t make for a very appealing commute…
If you can’t build out – build up. Multi story little boxes to become the cages for the unwashed. Ebbets Field Apartments -field of dreams.
Nearly all new multifamily construction (condo and rentals) are higher end. You cannot profitably build low-end high-rise rentals. People who want lower rents are relegated to renting in an old rundown building or house. There is a lot of demand for higher-end medium-rise and high-rise condos and rentals. People like living in them. There are apartments that rent for several tends of thousands a month and condos that sell for several tens of millions. It’s not the “unwashed” that live there.
Marblehead is a rich town. They certainly /could/ afford it.
But they’d literally have to bulldoze some existing houses to make room, which is probably why the residents voted against it.
MBTA communities act would have made a lot more sense if they limited it to rapid transit (subway and key bus routes). I get the idea behind it, but no one in their right mind is moving to Marblehead so they can spend 90-120 minutes commuting in on the 442 and Blue line. There are cheaper /and/ closer places to live.
you don’t have to worry about me, because there’s nowhere in america i’d rather live less than boston.
The best thing that could have happened is the Feds rate cuts since it ended up pushing rates up.
Everyone in Socal was getting into the market to get ahead of falling rates and hoping for the return of insane appreciation. Now that high rates are here to stay it’ll be interesting to see what happens next.
Jay must have a huge HELOC.
Wolf, do you have any idea how hard it might be to get property tax decreases from areas where prices went nuts, then property taxes weren’t far behind, IF those prices take a substantial hit in the next few years? I mean 50% seems like not even enough but I’m cheap.
Not WR but my unsolicited advise would be to talk to your local tax authority
Related…commercial real estate tax in Boston, you can appeal, but don’t expect to win. I believe just 6 properties were decreased for this fiscal year.
I am currently in the process of appealing my re-assessment. In my city, you have to appeal the current year (2025)’s assessment after paying the last part of 2024 taxes.
I’m about to put the 2024 tax check in the mail and then file the paperwork requesting a re-assessment. I’m unsure what happens after that.
I already had done an informal appeal through the company that my city uses for appraisals (Vision Gov’t Solutions), but they decided against me so now I’m appealing with the city directly.
Should we consider interest rates and the cost of a mortgage here as the real price (i.e. cost of housing)? Meaning, if 80% of buyers get a mortgage (according to NAR), has the cost of “owning” a home gone down when you look at mortgage payments? The mortgage dictates how much 80% of buyers are able to pay. 30 year mortgage rates started 2022 below 4%. Now they are at 7%. A 100k mortgage goes from $477 per month at 4% to $665 at 7%. This is a 39% increase in housing costs. Each 100 basis points in the mortgage rate seems to add 10% to the cost of the mortgage.
Here is the problem:
Quite few years back, only mortgage was the main sticking item in monthly outlay but not insurance and other fees have increased drastically at least in my hood.
My friend is paying $3K/month for his 2500 sq ft home for all other fees other than mortgage ( principle and interest ).
INsurance, and miscellaneous cost have increased drastically as well.
Many people I know are not able to buy because of other costs.
Very very interesting data. To say RE is sticky on the way down is an understatement.
Seems most areas are still in one of the following seller stages:
This is what I should get.
This is what I want to get.
This is what I need to get.
The final stage will is acceptance….this is what I can get.
I am astounded RE prices have not dropped more this past year and wonder if it isn’t as simple as inertia? This begs another question. Why do so many people move, anyway?
In other news the median age for first time home buyers is now 38 years old. Up from 30 in 2010.
Part of it is people were betting on rate cuts so that’s why the market traded sideways since 2022. And when they did come it caused mortgage rates to spike the opposite direction.
Slim checking in from Tucson. If what a neighbor told me yesterday is true, flipping is still happening here.
According to that neighbor, a nearby house was purchase for a mid-five figure price. Then it got flipped into the low hundreds.
I might add that the place is a real dump, and the squatters who were just kicked out? Let’s say that they didn’t occupy their time with home improvement.
Methinks that the in-VEST-or who owns it now is going to have quite the fixup job. And we neighbors know this guy well.
If there’s a corner he can cut, he will do it. We’ve seen his “work” on other properties in this city.
I pity the next owner of this house.
Very good reason always to have a full inspection by a qualified home inspector, of which I was one years ago when also being employed for a while as a certified municipal building inspector.
I certainly did it for far too cheap, but my goal was to help folx, especially on the low end of the housing market: $100 for oral report only, $200 for full written details.
IMHO, it’s nuts to buy any structure without an independent inspection by a now certifiable professional inspector, unless YOU are equally qualified.
For those considering buying some of the CRE now selling for VAST discounts, I suggest at least a qualified engineer, but even better would be a qualified and certified ”Forensic” engineer, or maybe a couple.
Kinda like ya want to get a couple opinions from qualified and certified appraisers.
Hah, I keep a spreadsheet of those so I can follow along as things develop.
This is one of my favorites:
2020 sold for $830,000
Early 2024 sold for $1,255,000
Jan 2025 listed for $1,295,000
We think this property is worth closer to $900k. The kitchen is really down market for a million dollar property. If feels like an speculator purchase and suddenly they realize prices are dropping.
All annual appreciation rates are not equal. 10% in 2016 is not equal to 10% in 2023. If you adjust these figures for inflation, you’ll find the hit taken by residential real estate is much larger than it appears on these graphs.
That 2022 spike in Phoenix represents a few thousand closings at the all-time tippy top peak $500k pandemic rate level. Those people now have the distinction of buying the last $18 can of beer in the 7th inning before sales are stopped. But the rolling six month average probably never exceeded $460 or so, and appears to be very slowly walking down. There are still very few houses for sale here, and they are still priced pretty aggressively. I’m not saying prices won’t continue to gradually slide over the next few years with 7% mortgages, but it will likely not be the painful/exciting half off sale of 2010-2012.
I drove through a new housing development in California a few days ago. A sign said “Priced from the high 700’s.” Taking $780K as a starting point, I put it into a mortgage calculator and added conservative numbers for tax and property insurance. The payment came out to $4810 per month! ($57,720 per year). And that is for the lower price range for those homes. I used an interest rate of 6.68%, which is lower than average.
With the fires raging in California, it’s possible that an extra $1000 per month in insurance costs may be added onto the monthly payment.
Whoopie! Home prices are coming down. Yes, that’s sarcasm.
I will report back with some more accurate prices for these homes, not the “starting at” price.
The fires seem like a win win for those with money. Very remote that any modest homes will ever be rebuild, replaced, or even permitted. Would they even allow trailers in 2025 or owner built?
It is not just California. Some years ago a twister took out a local hood alone the river. Now there are nice homes on much larger lots.
It is all about location, location, and location! Any rebuilding will be for those with very deep pockets.
I would wager that prices are not going down in L.A. and Malibu oceanfront gets rebuilt first!
I can see Blackrock moving in and buying the demolished homes from the insurance companies for the land value. Larry Fink is already salivating, while LA burns.
I’ve thought the same thing. These burnt out neighborhoods may go from having a dozen 3000 sqft houses on the street to four 6000 Sqft houses with large gaps (for “fire safety”) in between. Total property tax take will be the same. No more million dollar starter homes for the upper middle class – these start at $4M and you probably should be paying cash if you want to fit in here..
It’s not just a permit and rebuild question, will SCE replace those power lines? How about the gas lines? What about water lines and infrastructure?
The burnt canyon sides will be prone to mudslides when the rains finally do come.
Those are big questions. A trailer with no services isn’t workable unless you’re used to roughing it.
I am in the midwest and the constant text, calls, and postcards to “Buy you house with Cash” have dried up.
That could be an ominous sign that a top is in and weakness as shown in the charts posted by wolf.
Interesting but some of those midwest cities like KC, Chicago, and Columbus, and even Houston are still up to 50% lower in price than many larger markets and I bet the median house size is also bigger as well as cheaper.
Tucson report: I’m still getting postcards from We Buy Houses.
Same here in Sacramento. Admittedly new year brings in all sorts of mailings!
Same here in Boston. They go right in the recycle bin.
I am also getting them and even talked to them.
It does not mean market is hot. They offer 30% or so less than current market price.
My husband gets calls daily from people offering to buy our house. He tells them two million, cash, as is.
They usually hang up :)
I had a neighbor offer to buy my house for cash. I asked him if he didn’t like me or what the hell was he doing this for. He said he wanted to build an empire. Translation. “Tear my house down, and sell it to a builder to put up a monster home on the lot.
I told him to go f$ck off. That’s the last conversation I ever had with this loser.
I am still getting them for a house I sold 7 years ago.
While of course there have been wage increases (but also significant services inflation in insurance and so forth) it is unclear where this needs to get to for most buyers. I purchased my house in 2016 for about 400K. Impossible to know what it would sell for(guessing 600K based similar sales in neighborhood) but even if it went back to 2016 prices the mortgage rates would make it significantly more expensive. Just feels like while not the same as 2008-2009 for lots of reasons seems like if prices do drop enough it will just be another cash buyer bonanza. Nothing wrong with rentals except when those that want a house get pushed out by all cash offers.
During HB1 burst, I along with lot of my friends were able to buy homes to live in.
It was not like that only cash offer were accepted.
BTW, in my neighborhood, almost most of the homes can’t be afforded at current price/rate by current owners. This shows something is broken.
MW: Tech stocks weigh on Nasdaq, S&P 500 as bond yields rise
I’m wondering when the whole marry the house date the rate crowd is going to start running into trouble?
I’m also wondering when student loans will actually start being repaid. Most people I know are paying nothing and interest isn’t accruing while the save plan is being appealed in court.
Perhaps the economy is doing so well because most people aren’t making their full debt payments? When student loan payments start and mortgage buy downs expire, I wonder how much that will take away from consumer spending.
Right now there’s no reason to sell besides divorce or death or unloading an investment property. Friends who want to move have been renting their house out and then renting another house in the new area since renting is so much cheaper than buying the same property at 7%. Price declines will continue to be slow without a panic.
DM: Biden uses loophole for defiant last act on student loans – as total forgiveness cost hits $183 billion
President Joe Biden has now overseen the cancellation of student loans for more than 5 million Americans – more than any other president in US history.
Tomorrow he’s going to declare a Jubilee and cancel all mortgage debt.
Like the end of “Fight Club”? I want to be the one holding Helena Bonham Carter’s hand and listening to the Pixies while the world burns
I think student loans only affect a small portion of potential buyers in certain cities like SF and Boston.
Normal people in Tampa and Milwaukee don’t have significant loans.
Student loan payments resuming would be a hit to gdp. There was a lot of talk about this when the original freeze was expiring. It’s not the size of the loans/payments, even at $100 a month when you multiply that by 42.7 million Americans, that’s a sizeable hit to consumer spending.
Which flows through to companies, which flows through to stock prices, raises, hiring, layoffs, etc.
From the homeowner standpoint for people who bought in the last few years, my point was their free cash flow may start going down not up as buy downs expire, insurance goes up, and student loans resume
The student loans my wife and I have started getting repaid in October… 2023.
I never applied for “forgiveness” as the whole thing is a scam and boondoggle, going from approval to court denial/ hangup (despite whatever headlines say).
My loan is from a bygone era, with a tiny interest rate and small balance. The ability to refinance the debt to a minimal payment has always existed.
My wife’s is more recent and has a rate with some consequence (upper 5%), and she’s been making the payments.
Economy is good. Anecdotally I have a friend that accrued a 6-figure loan, but never got the Masters’… he’s been paying for years… and the economy is good (driving a truck is more palatable than anything in his educational field).
I think the rate- daters are probably just fine if they are in the home, as it’s meant to be.
Those graphs are starting to resemble other asset price graphs.
Bonds led the way – TLT 80’s through 2008, climbing to 120’s with the first QE wave, then 160’s after the covid QE wave, now back to the 85’s
Housing market was the next to go, much slower to decline, but the decline is clearly visible. Most overheated markets dropping quickest.
Stocks are now also just starting to resemble some of those housing market graphs. Your imploded stock series shows the same pattern with the overheated stocks losing most.
The world is healing, the asset bubble is deflating. A few more years of this and young people will be able to afford a house once again, and we won’t need to save millions to be able fund our retirement with 1% returns. Everything eventually returns to the mean. QE created the asset bubble by lowering long term rates and QT is deflating it by raising them.
Washington DC has been hit hard by the pandemic aftermath. About 40% of the small businesses have closed. WFH has decimated the downtown area businesses which depend on foot traffic. Crime is out of control. I’ve never seen a decline like this in my entire time here. No one wants to go downtown unless you have to. With the changover in administration a lot of Federal appointees, 5000 in all, will be losing their jobs. Most of them are Dems many who who prefer city living. The new employees, mostly, Republicans will move to Virginia, and the exurbs in Maryland. So look for a housing glut in DC to materialize further depressing RE prices there while the suburbs will flourish. Any metro-wide average price data is very misleading as Wolf’s data is already showing.
Look forward to the District of Columbia Condo market to slow, inventory is slightly higher than a couple of years ago. The first time home buyer is finding it difficult to buy in DC, and condos are the only game in town. Single family detached and townhouse prices are out of reach for the first time home buyer. Only the upper class can afford to live in DC making it more like a European Country. DC used to be an affordable place to live in, having a good transportation system. Currently DC is unaffordable for the low to moderate income family.
Swamp Creatures wife who appraises in DC
I think people slowly realize that gray paint/vinyl floors don’t justify overpaying. When flippers realize how little profit that brings, it put a lot of flipping on hold.
Amazingly i learned from cabinet maker next door that gray cabinets are getting out of style and more people order natural oak… Funny how history makes a uturn.
Adjusting for inflation…or wage gains ….
Anyway, I’m a landlord in 3 different states, and there’s not a single location I’d put new money to work. Especially when the competing yield is nearly 5%.
Anyone buying now is betting that rents will inflate faster than taxes, insurance and repair costs. That’s a bad bet.
New York is the best performer, is that correct?
Yes, currently on a yoy basis.
Since 2000, it’s Miami, Los Angeles… that crowd. NY since 2000 +211%; Miami +329%; Los Angeles +329%, San Diego +333%…
The current housing market is just like the areas affected by the fires in Southern California. Lots of danger signs. (Overgrowth of brush, lack of water). Surely, there are many red flags in the housing market, and I believe that just like the fires destroying homes, the housing market meltdown will come with equal surprise, causing massive damage and destruction. The rug will be pulled out. But this time, the devastation will be economic Do you have your fire hoses ready?
what effect of LA fires?
on home values?
banks?
You can take the banks off your worry list. Most mortgages are sold to investors as MBS, either through the government or private label. In addition, a lot of the collateral values were insured. In addition, the biggest mortgage lenders are not the banks, but non-bank lenders, Rocket Mortgage being the #1 mortgage lender in the US.
How about the re-insurers who are exposed to the explosion in pending California Insurance company fire related claims. Will they be pulling out of Southern California?
Are builder incentives throwing this off? The new homes still sell for asking price with rate buy downs or what not instead of just taking that money off the selling price.
On a secondary note, people who bought on these 3,2,1 buy downs are going to be in huge trouble if rates don’t come down significantly soon, and that is likely what will cause this bubble to pop. The lack of foreclosures is why this bubble has yet to pop.