Oakland, Austin, San Francisco, Denver, Tampa, Seattle, Saint Petersburg, Fort Myers, Sarasota, Boise, Jacksonville, Detroit, New Orleans, Portland, Arlington, Naples, Mesa, Aurora, Reno.
By Wolf Richter for WOLF STREET.
Every housing market dances to its own drummer. Condo prices had exploded. But then in some of these markets, prices began to turn south in mid-2022, in other markets in 2023, and in others in 2024. One of the 2024-peakers already made it on this list, which was fast: Arlington, TX (-13% from the peak a year ago).
In many markets, condo prices have been dropping, but to get on this list, prices must be down by at least 12% from the peak. Smaller cities had big declines too but were too small by population to qualify for this list.
The 19 cities with price declines of 12% to 24% through June:
- Oakland, CA: -24%
- Austin, TX: -24%
- Saint Petersburg, FL: -21%
- Fort Myers, FL: -17%
- Sarasota, FL: -17%
- San Francisco, CA: -16%
- Boise, ID: -14%
- Jacksonville, FL: -14%
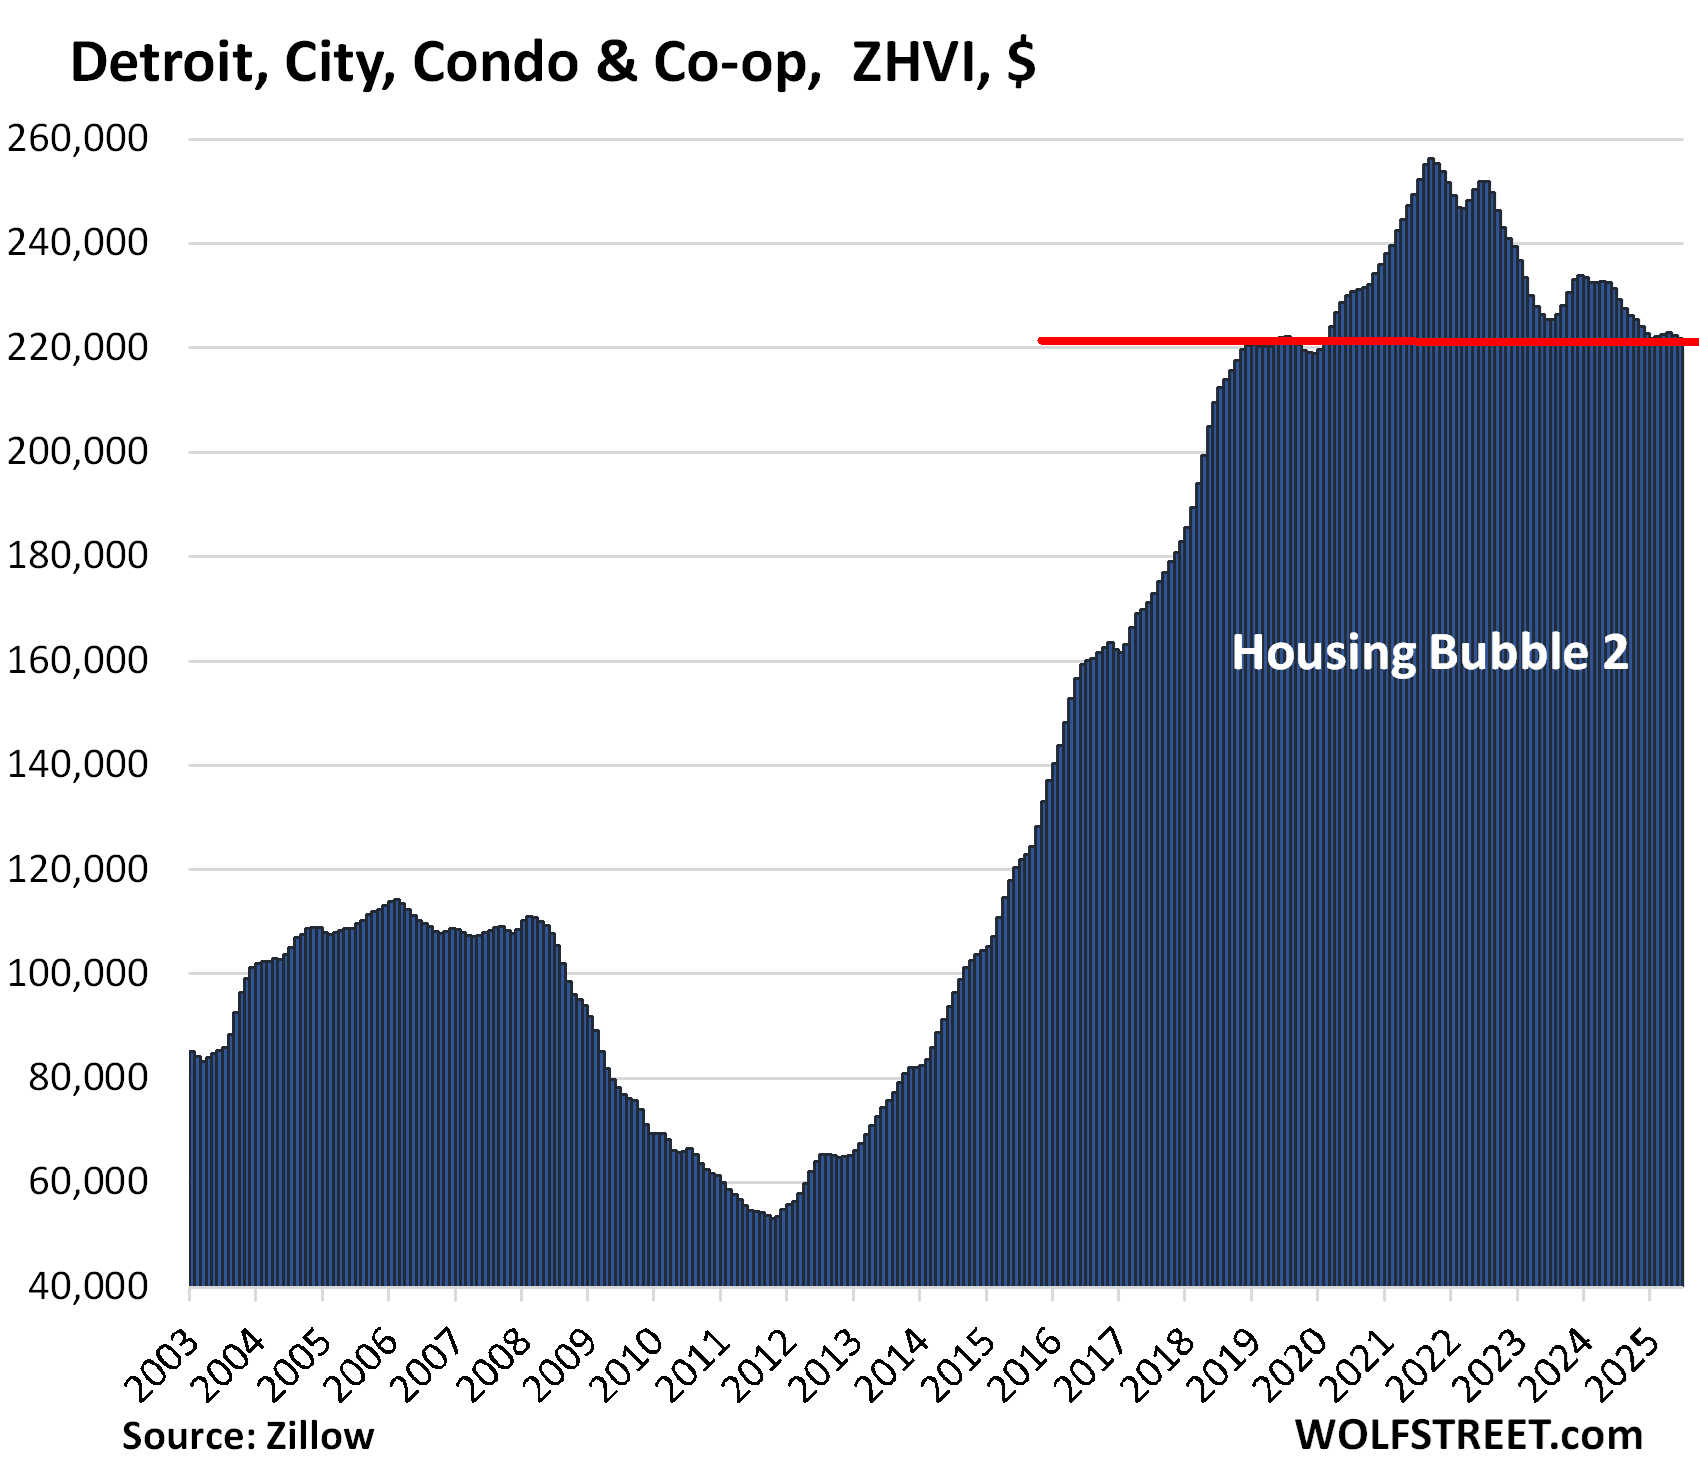
- Detroit, MI: -13%
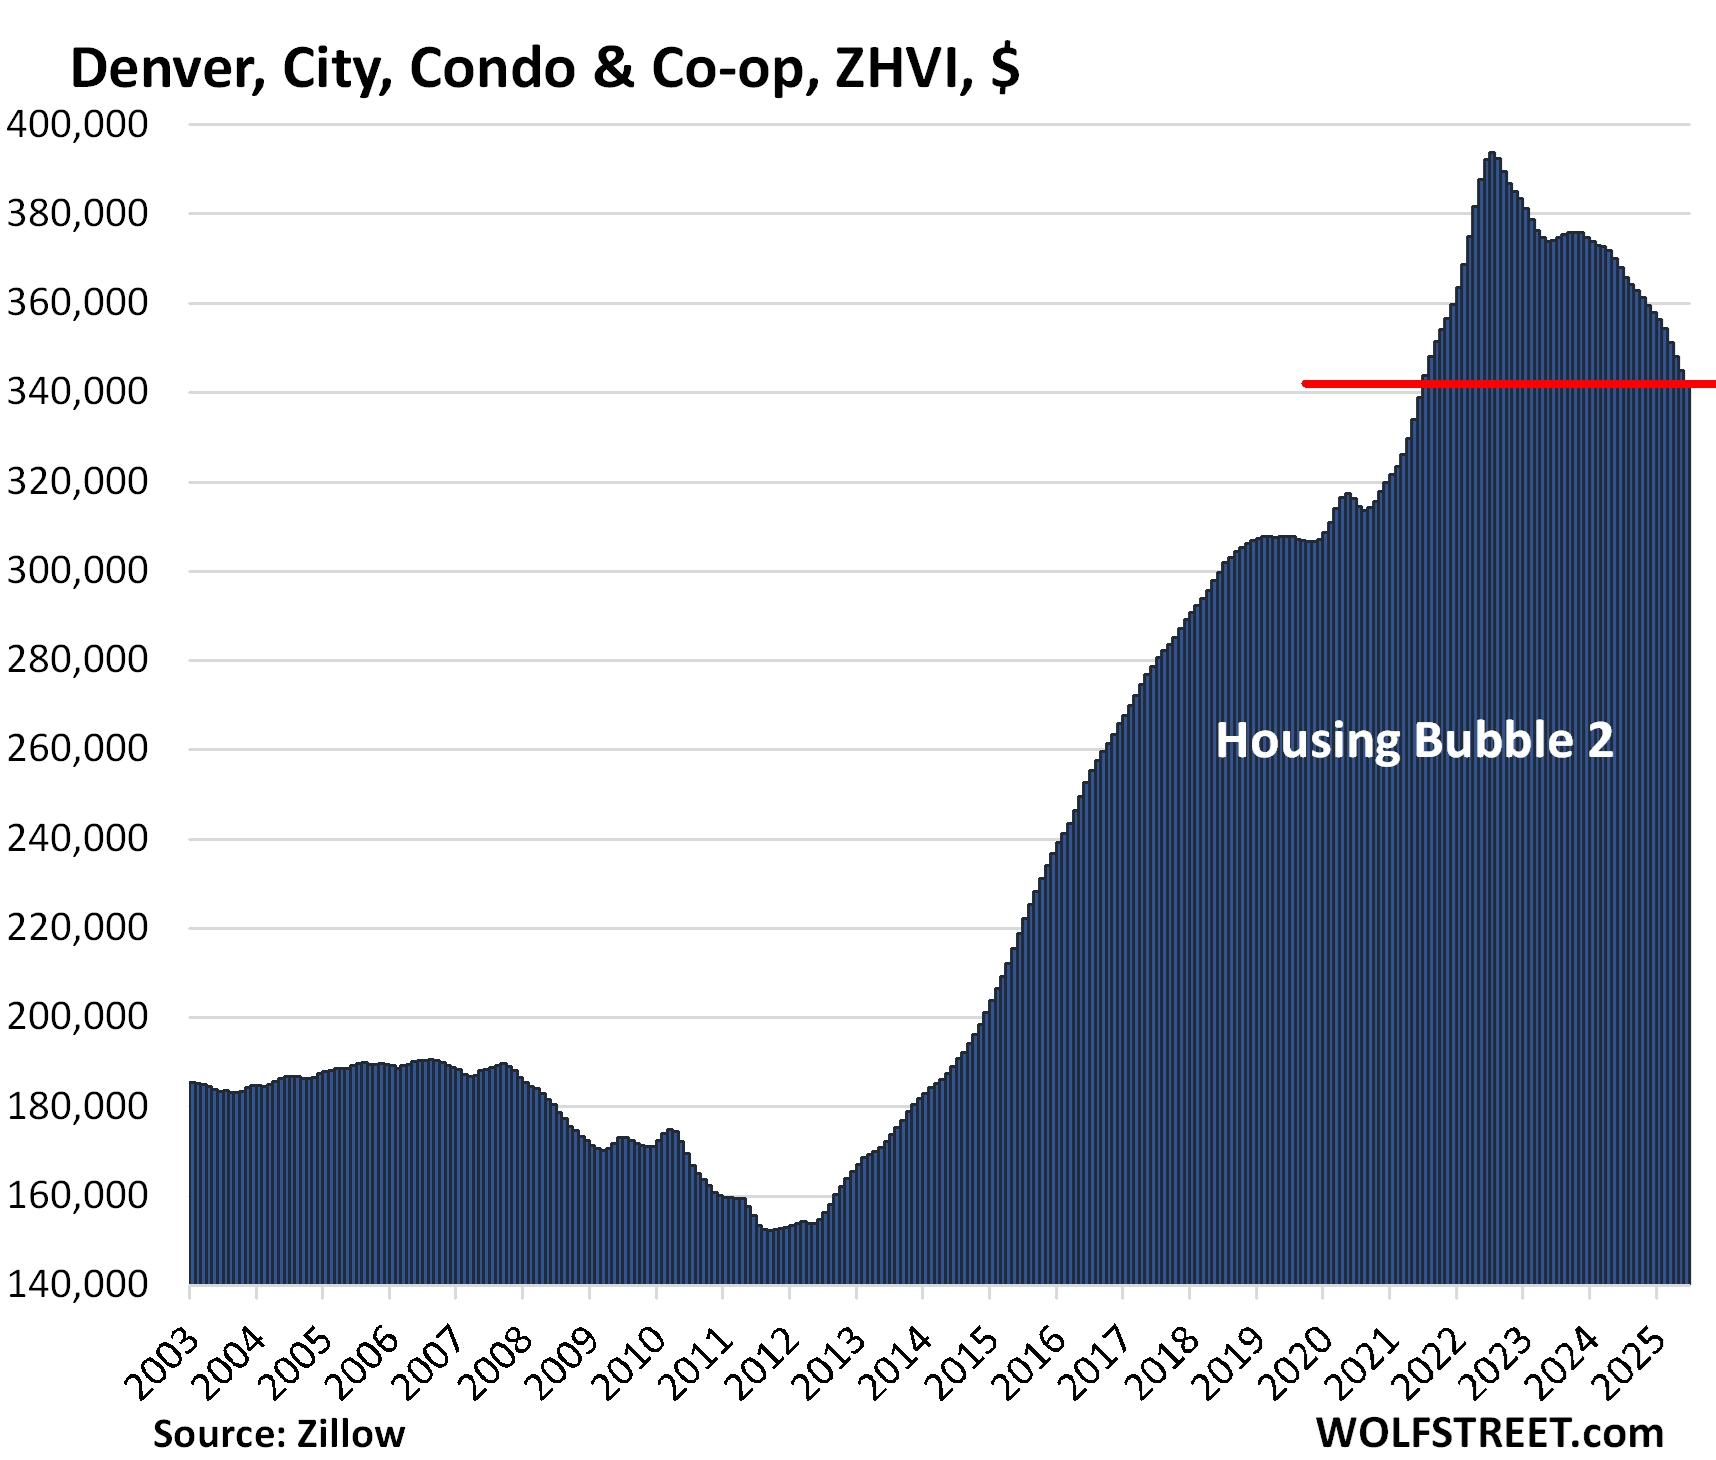
- Denver, CO: -13%
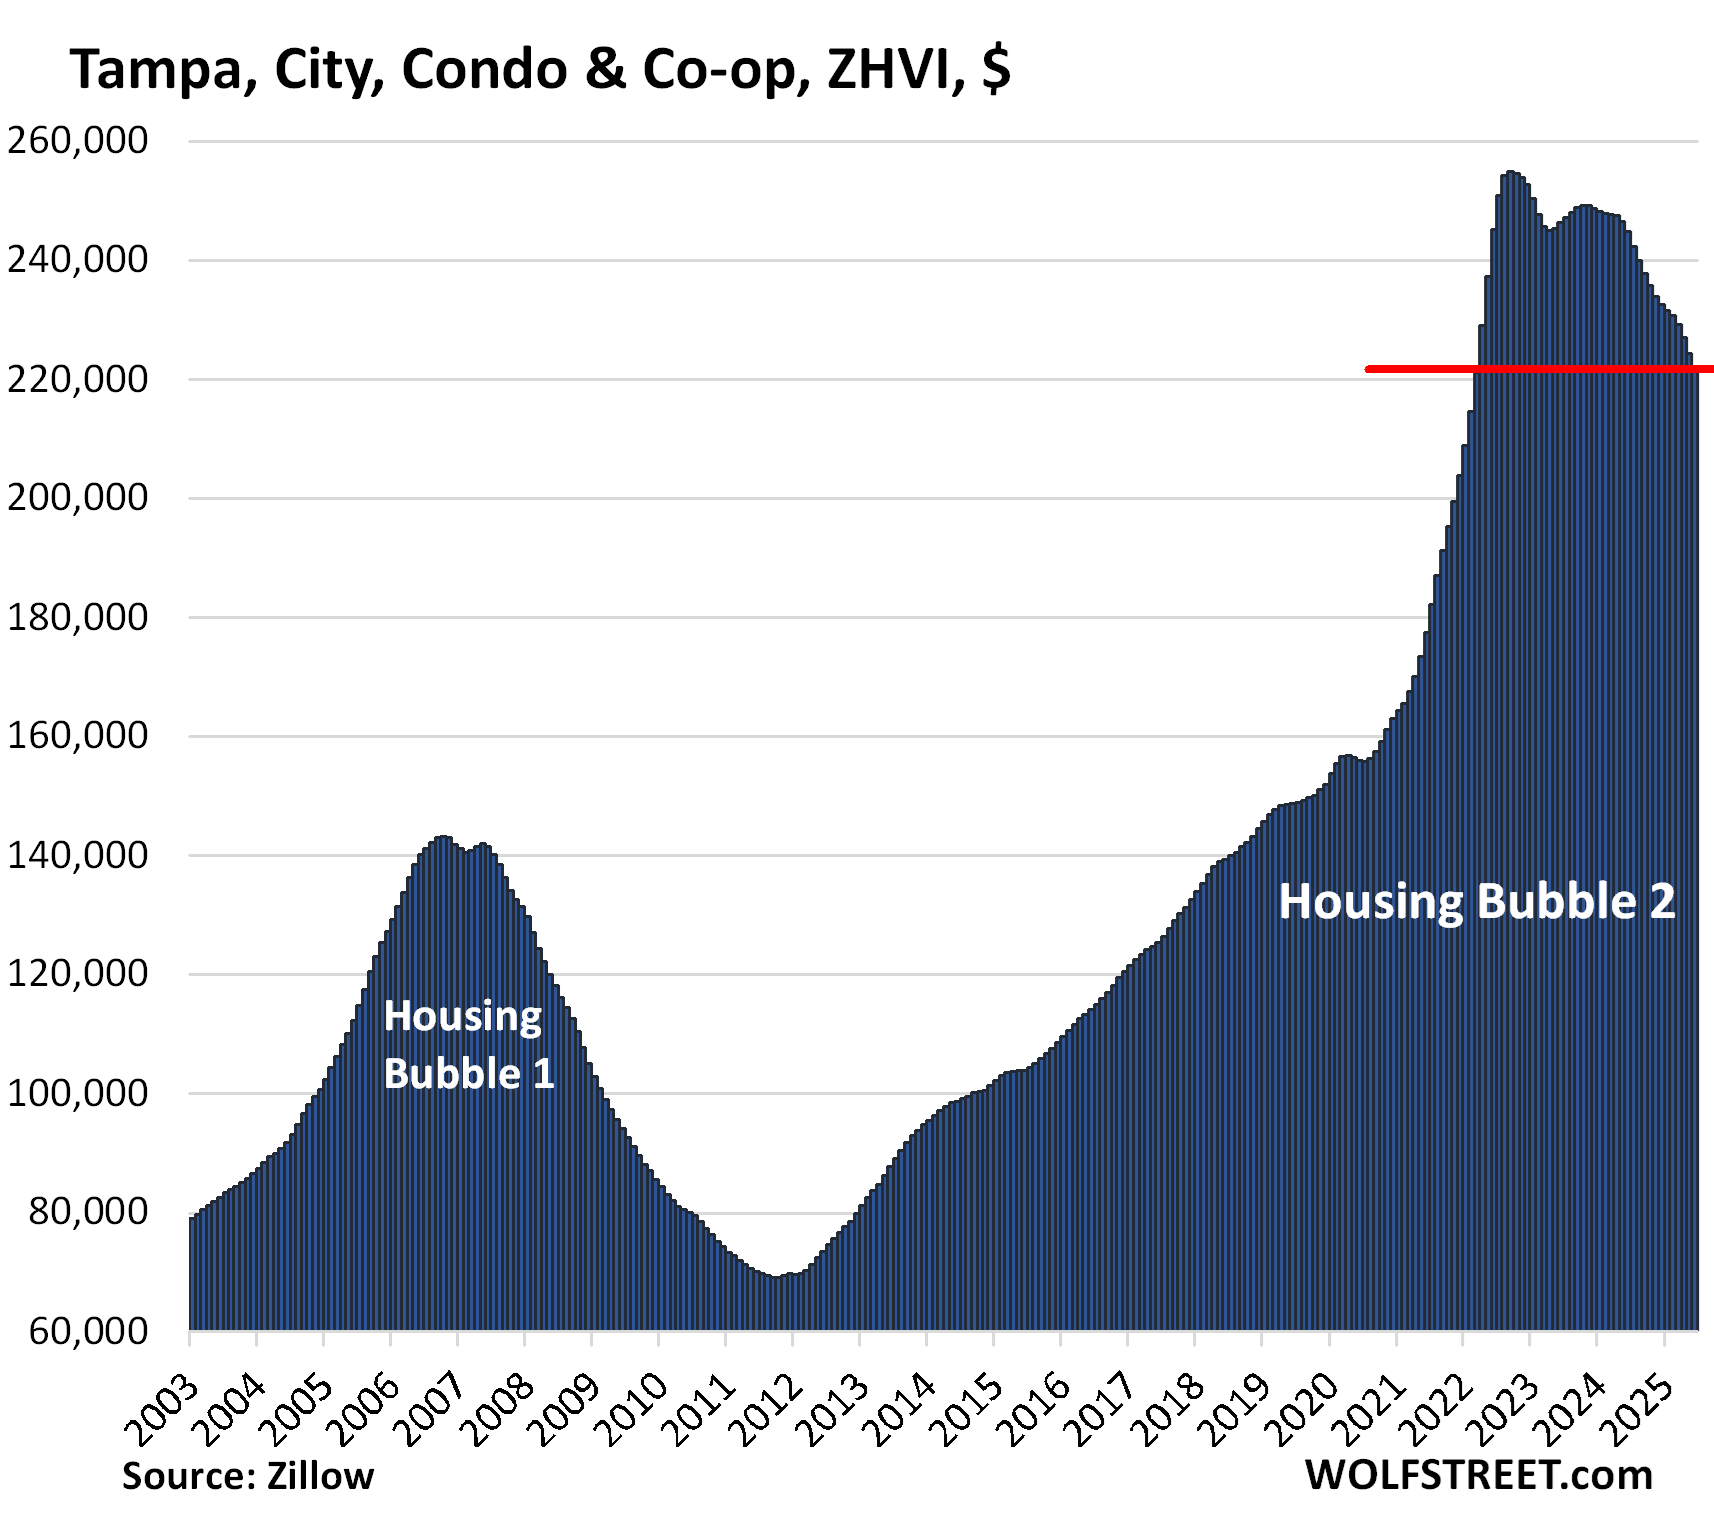
- Tampa, FL: -13%
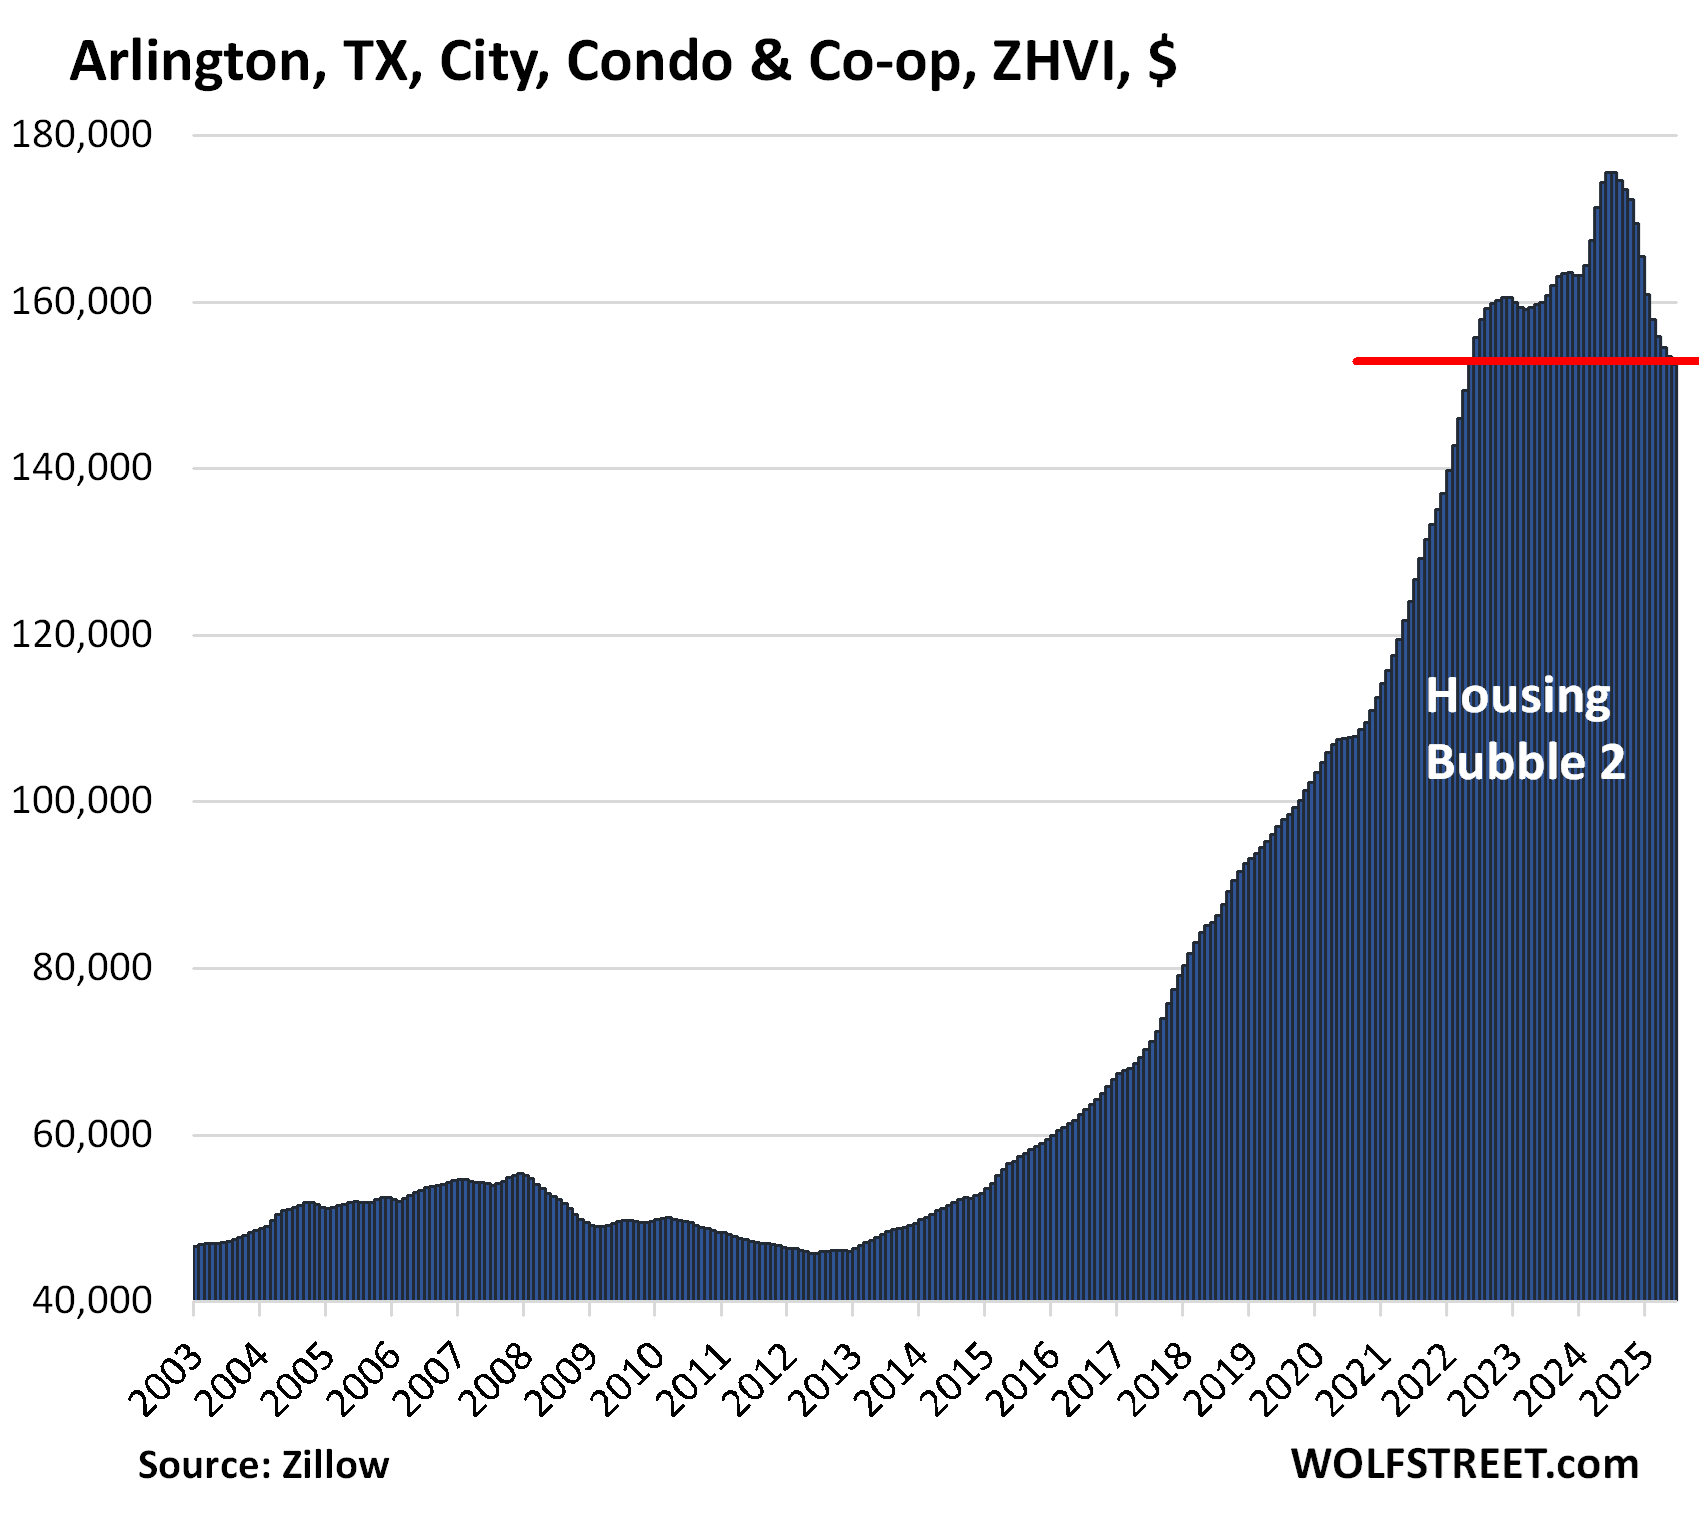
- Arlington, TX: -13%
- Naples, FL: -13%
- New Orleans, LA: -12%
- Seattle: -12%
- Reno, NV: -12.0%
- Mesa, AZ: -12%
- Portland, OR: -12%
- Aurora, CO: -12%
Prices in all of these 19 cities fell month-to-month topped off by Fort Myers (-2.0%), Oakland (-1.8%), and Saint Petersburg (-1.8%).
All 19 cities had year-over-year price declines, topped of by Saint Petersburg (-14.5%), Fort Myers (-13.8%), and Arlington (-13.1%).
In some densely populated cities, such as San Francisco, condos make up a bigger part of home sales than single-family homes.
But it was a fantastic condo bubble, topped off with a mania, driven by the Fed’s interest-rate repression that included near-0% short-term rates and trillions of dollars in QE, including purchases of mortgage-backed securities (MBS), which pushed down mortgage rates below 3%, triggering the most astounding buying behavior.
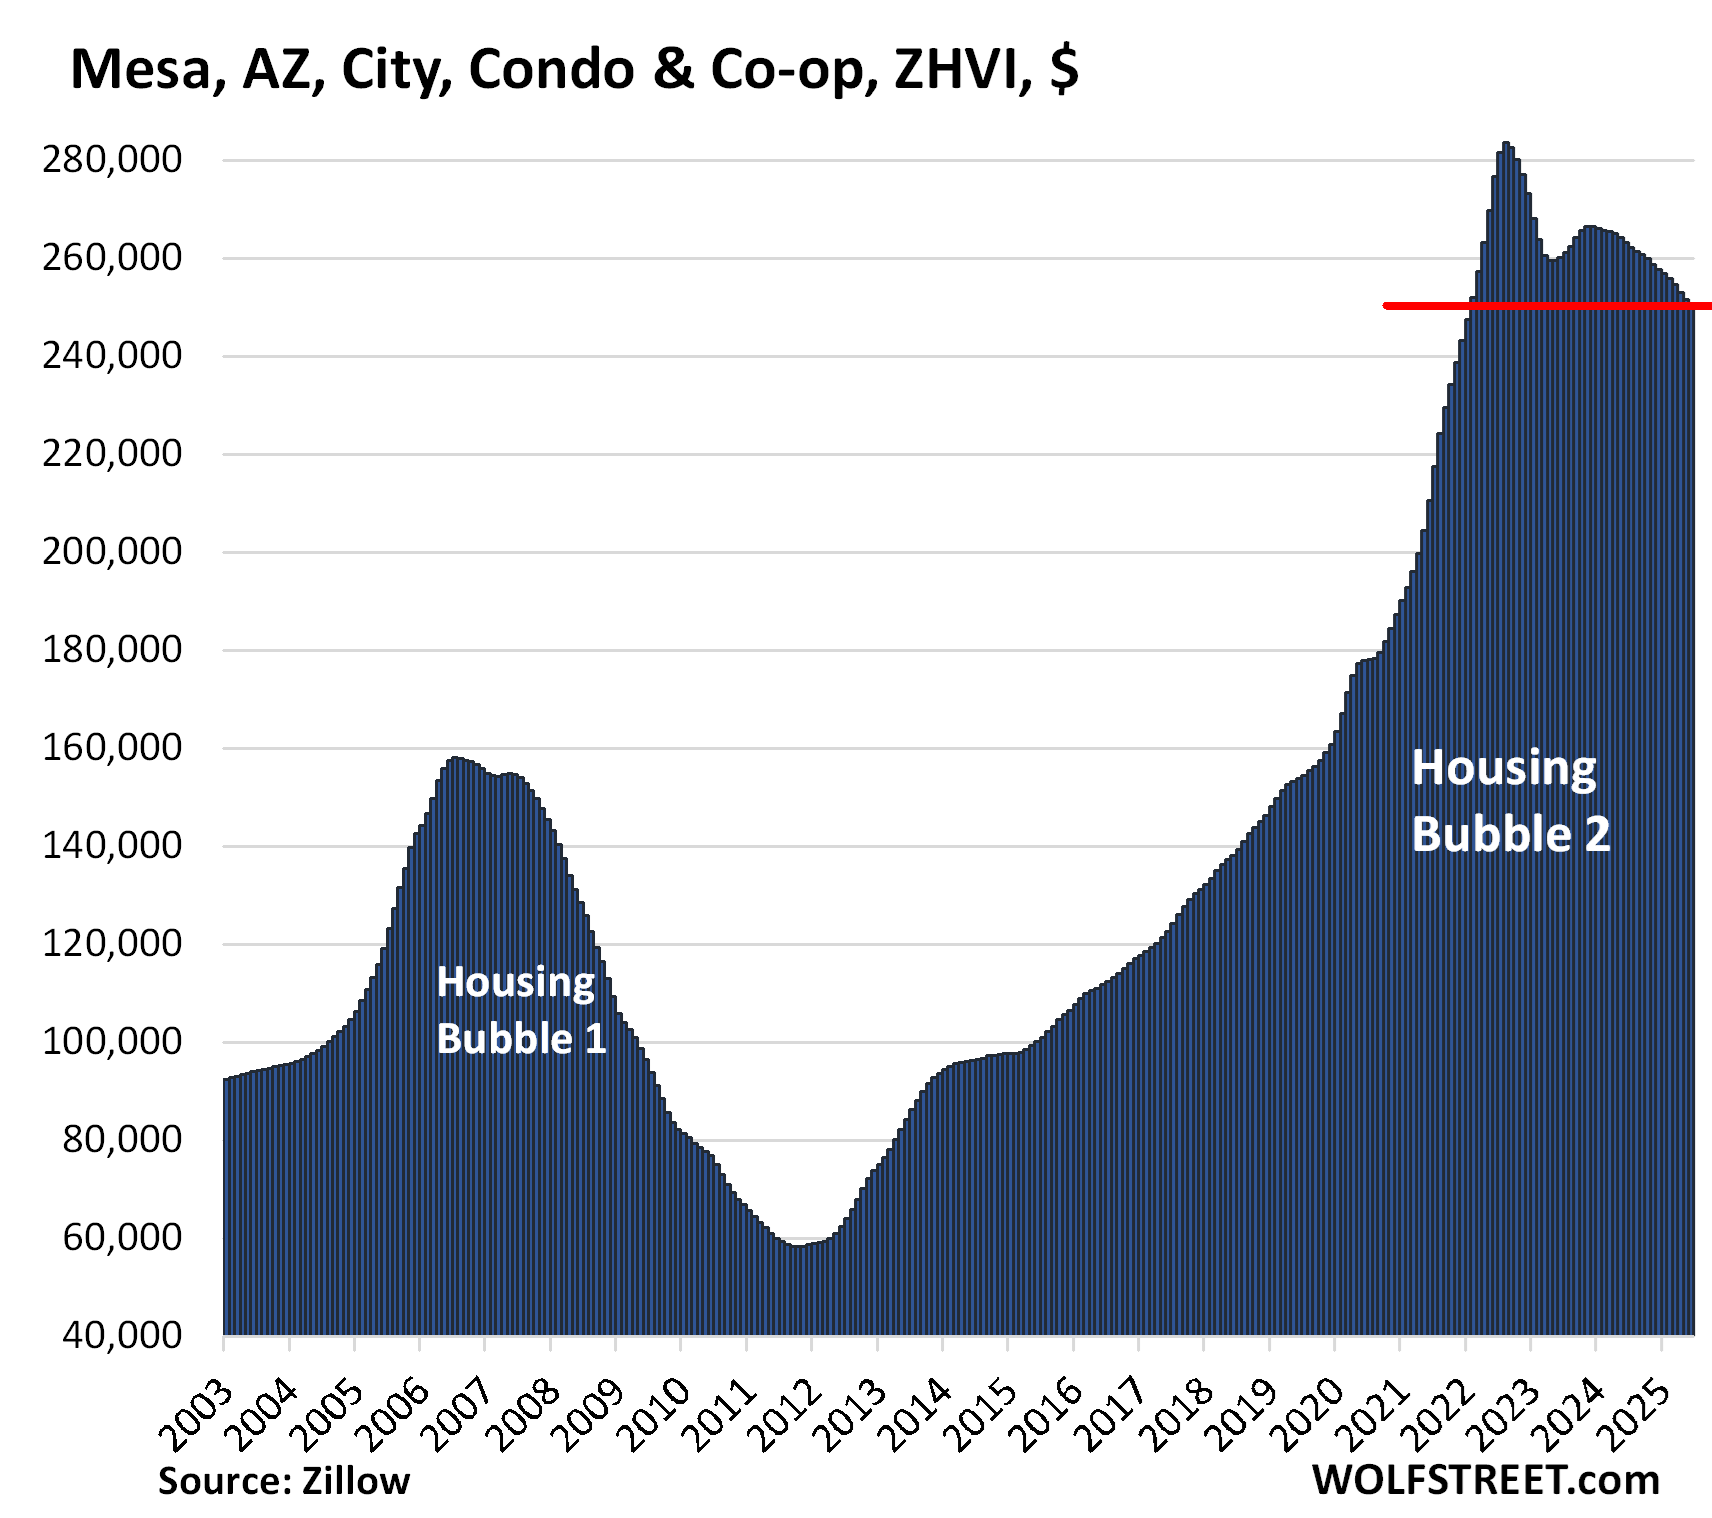
In the 10 years to the peak, prices exploded by 200% (Jacksonville, Tampa), 300% (Detroit, Aurora), or even 350% (Phoenix, Mesa). But Phoenix is not on this list because prices dropped by only 11% from the peak so far, and the cut-off is 12%. Mesa is on this list (-12%). And Scottsdale (-12%) didn’t make it because it’s too small by population.
These prices here are seasonally adjusted three-month moving averages of “mid-tier” condos and co-ops in “cities” (not in metros or Metropolitan Statistical Areas) from the Zillow Home Value Index (ZHVI), which is based on millions of data points in Zillow’s “Database of All Homes,” including from public records (tax data), MLS, brokerages, local Realtor Associations, real-estate agents, and households across the US. It includes pricing data for off-market deals and for-sale-by-owner deals. These are not median prices.
Condos are now dogged by a laundry list of issues:
- Too-high prices that exploded over the past few years.
- Big special assessments for long-neglected big repairs.
- Often dizzying increases in HOA fees.
- Being on Fannie Mae’s ever-expanding Condo Blacklist of condo buildings that makes financing a unit very difficult.
- The threat of ending up on Fannie Mae’s Condo Blacklist.
- Mortgage rates that have returned into some sort of normal range, from the interest-rate repression range.
- Foreign-based owners who no longer want to live part-time in the US, such as Canadians, and are putting their condos on the market.
In addition, rentals of condos deal with the supply of new higher-end apartment developments that sprouted up over the past few years. The vacation-rental boom may have also peaked. For investors in long-term rentals and vacation rentals, condos are expensive to carry, and they can quickly become a money pit. And some of these units have started to show up in inventory for sale.
The budding Condo Bust:
In the little tables for each city below, note the sharp month-to-month drops – a sign that the declines are heating up. The drops are not seasonal because the index is seasonally adjusted.
The metrics in each table from left to right: price decline from the peak, change from prior month (MoM), change year-over-year (YoY), and remaining increase since January 2000.
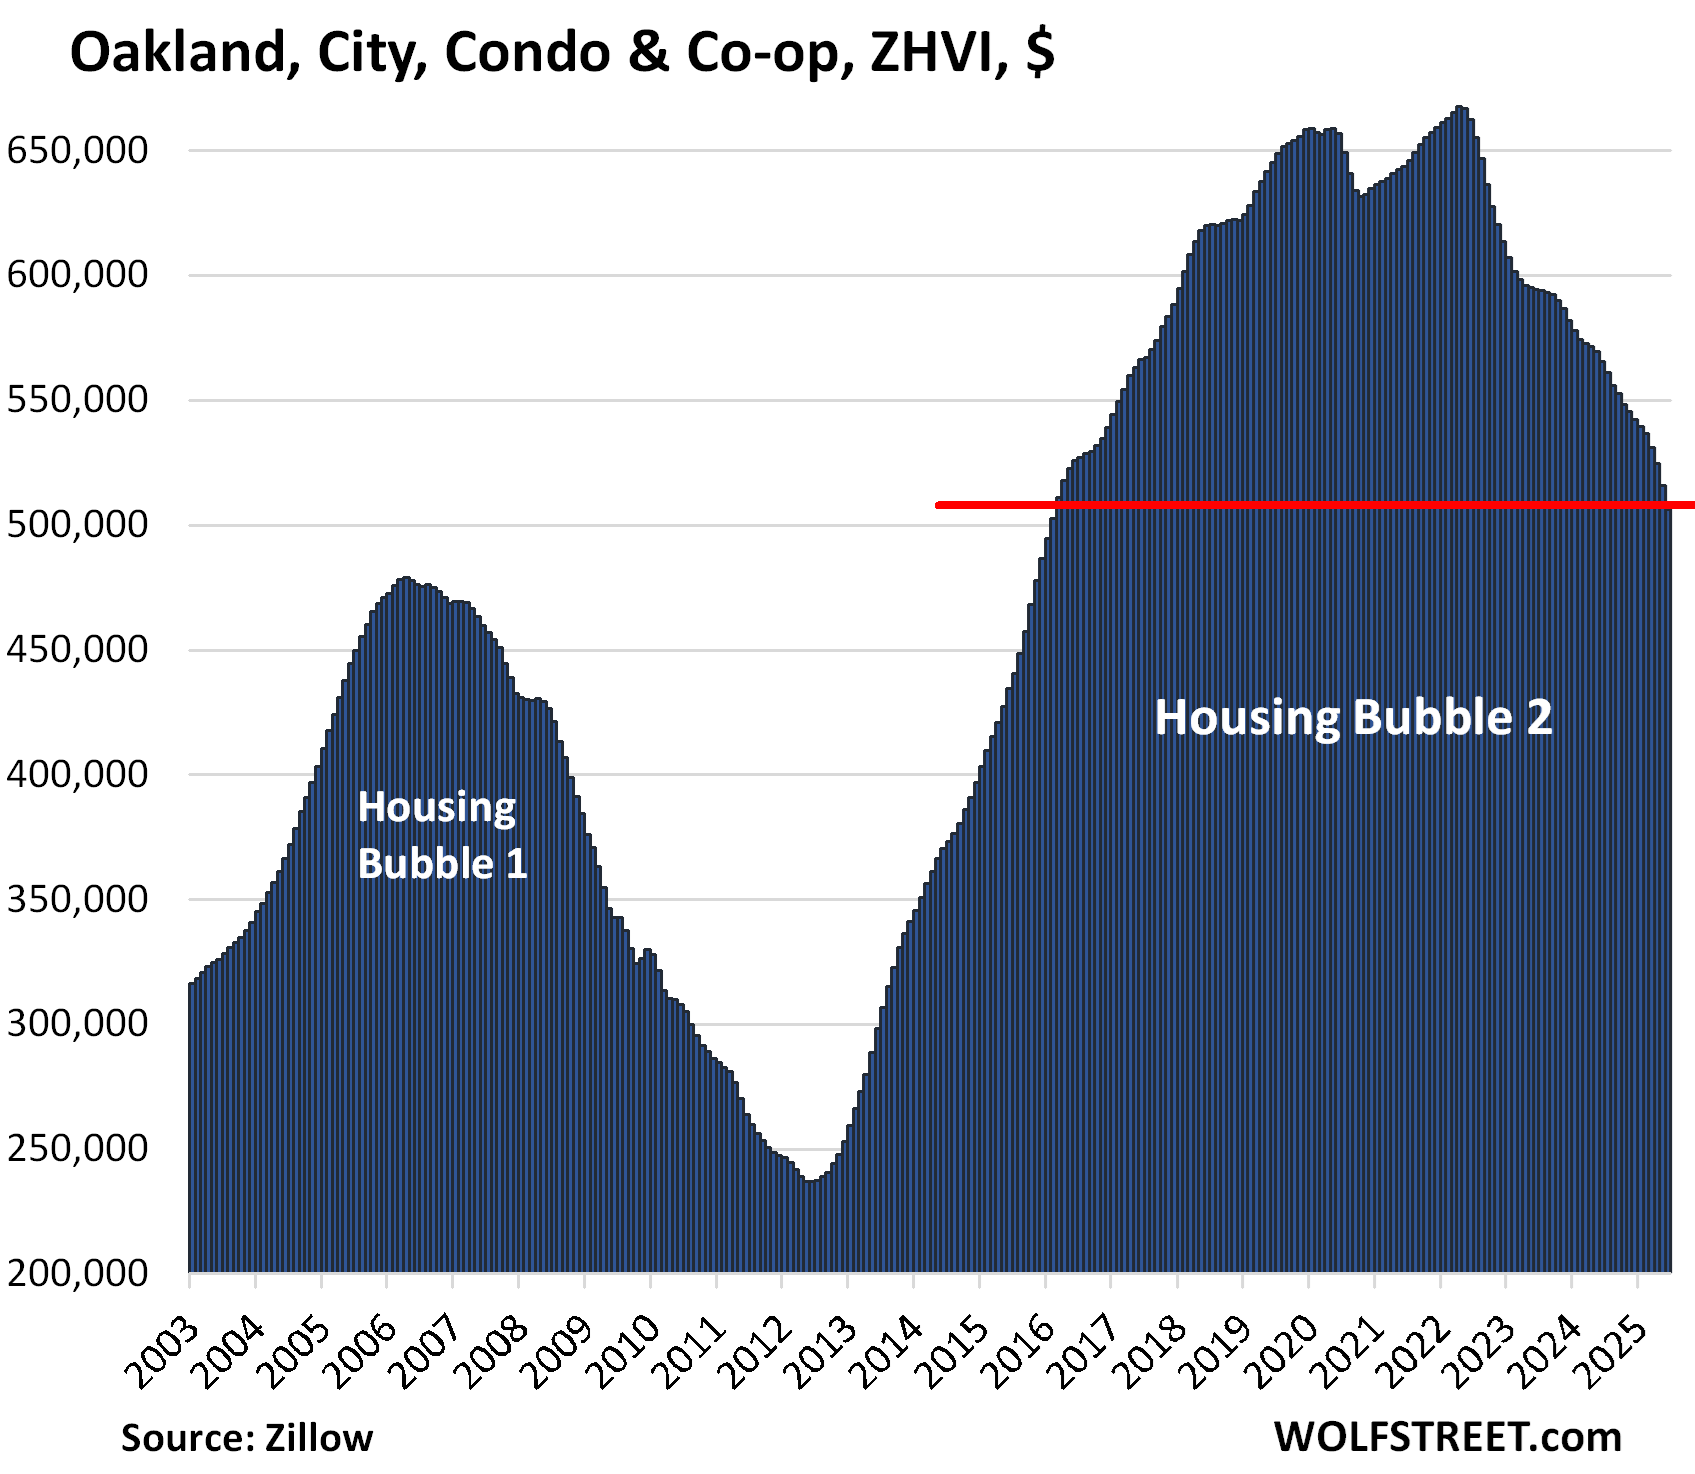
| Oakland, CA, City, Condo Home Prices | |||
| From May 2022 peak | MoM | YoY | Since 2000 |
| -24% | -1.8% | -10.5% | 166% |
Prices dropped to the lowest level since early 2016. That was over 9 years ago. The pace of the price drops has been accelerating: Note the 1.8% drop in June from May, taking the elevator down:
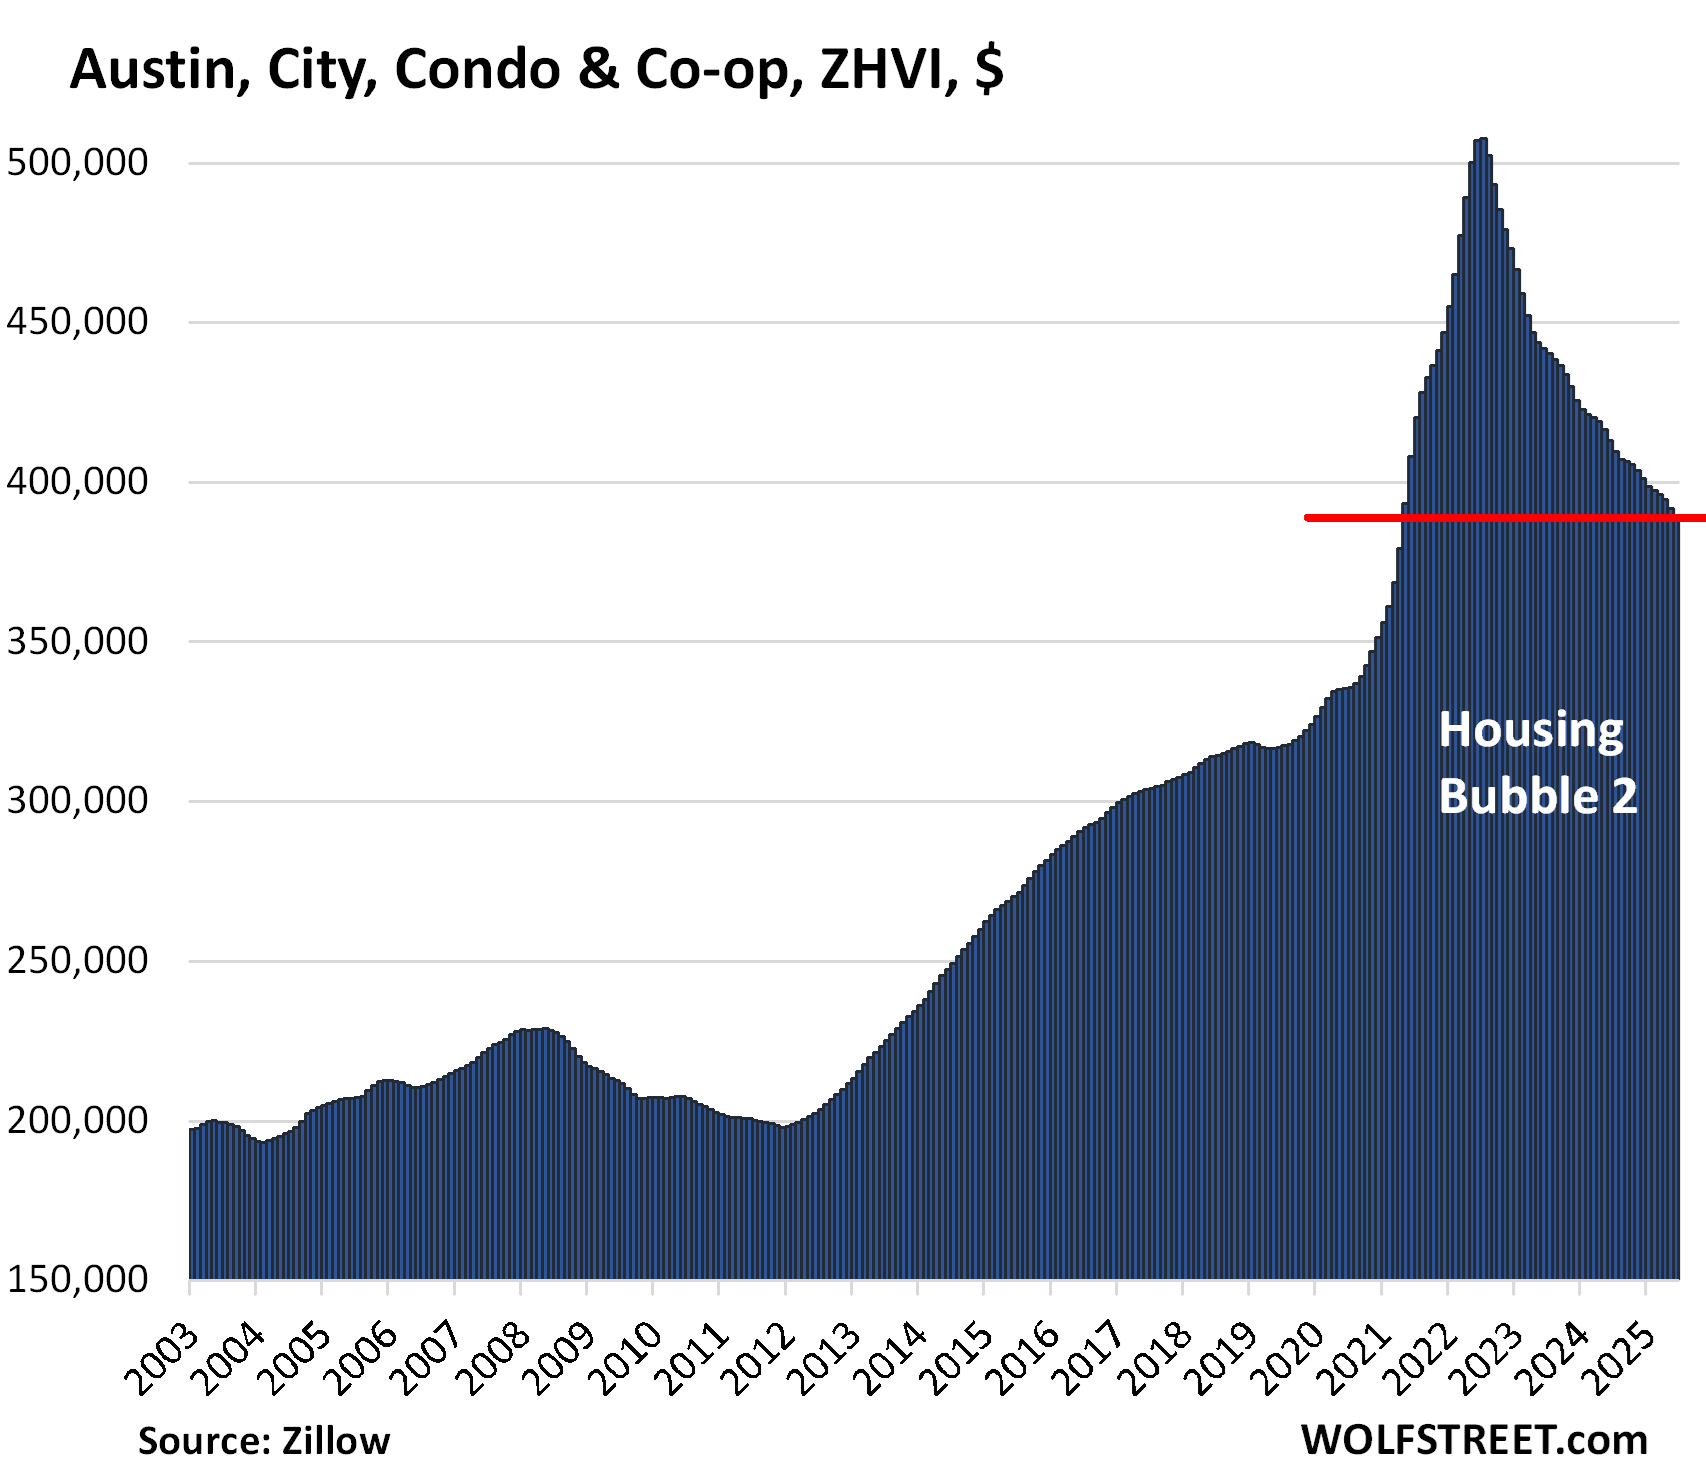
| Austin, TX, City, Condo Prices | |||
| From Jul 2022 peak | MoM | YoY | Since 2000 |
| -24% | -0.9% | -6.0% | 116% |
Lowest since April 2021.
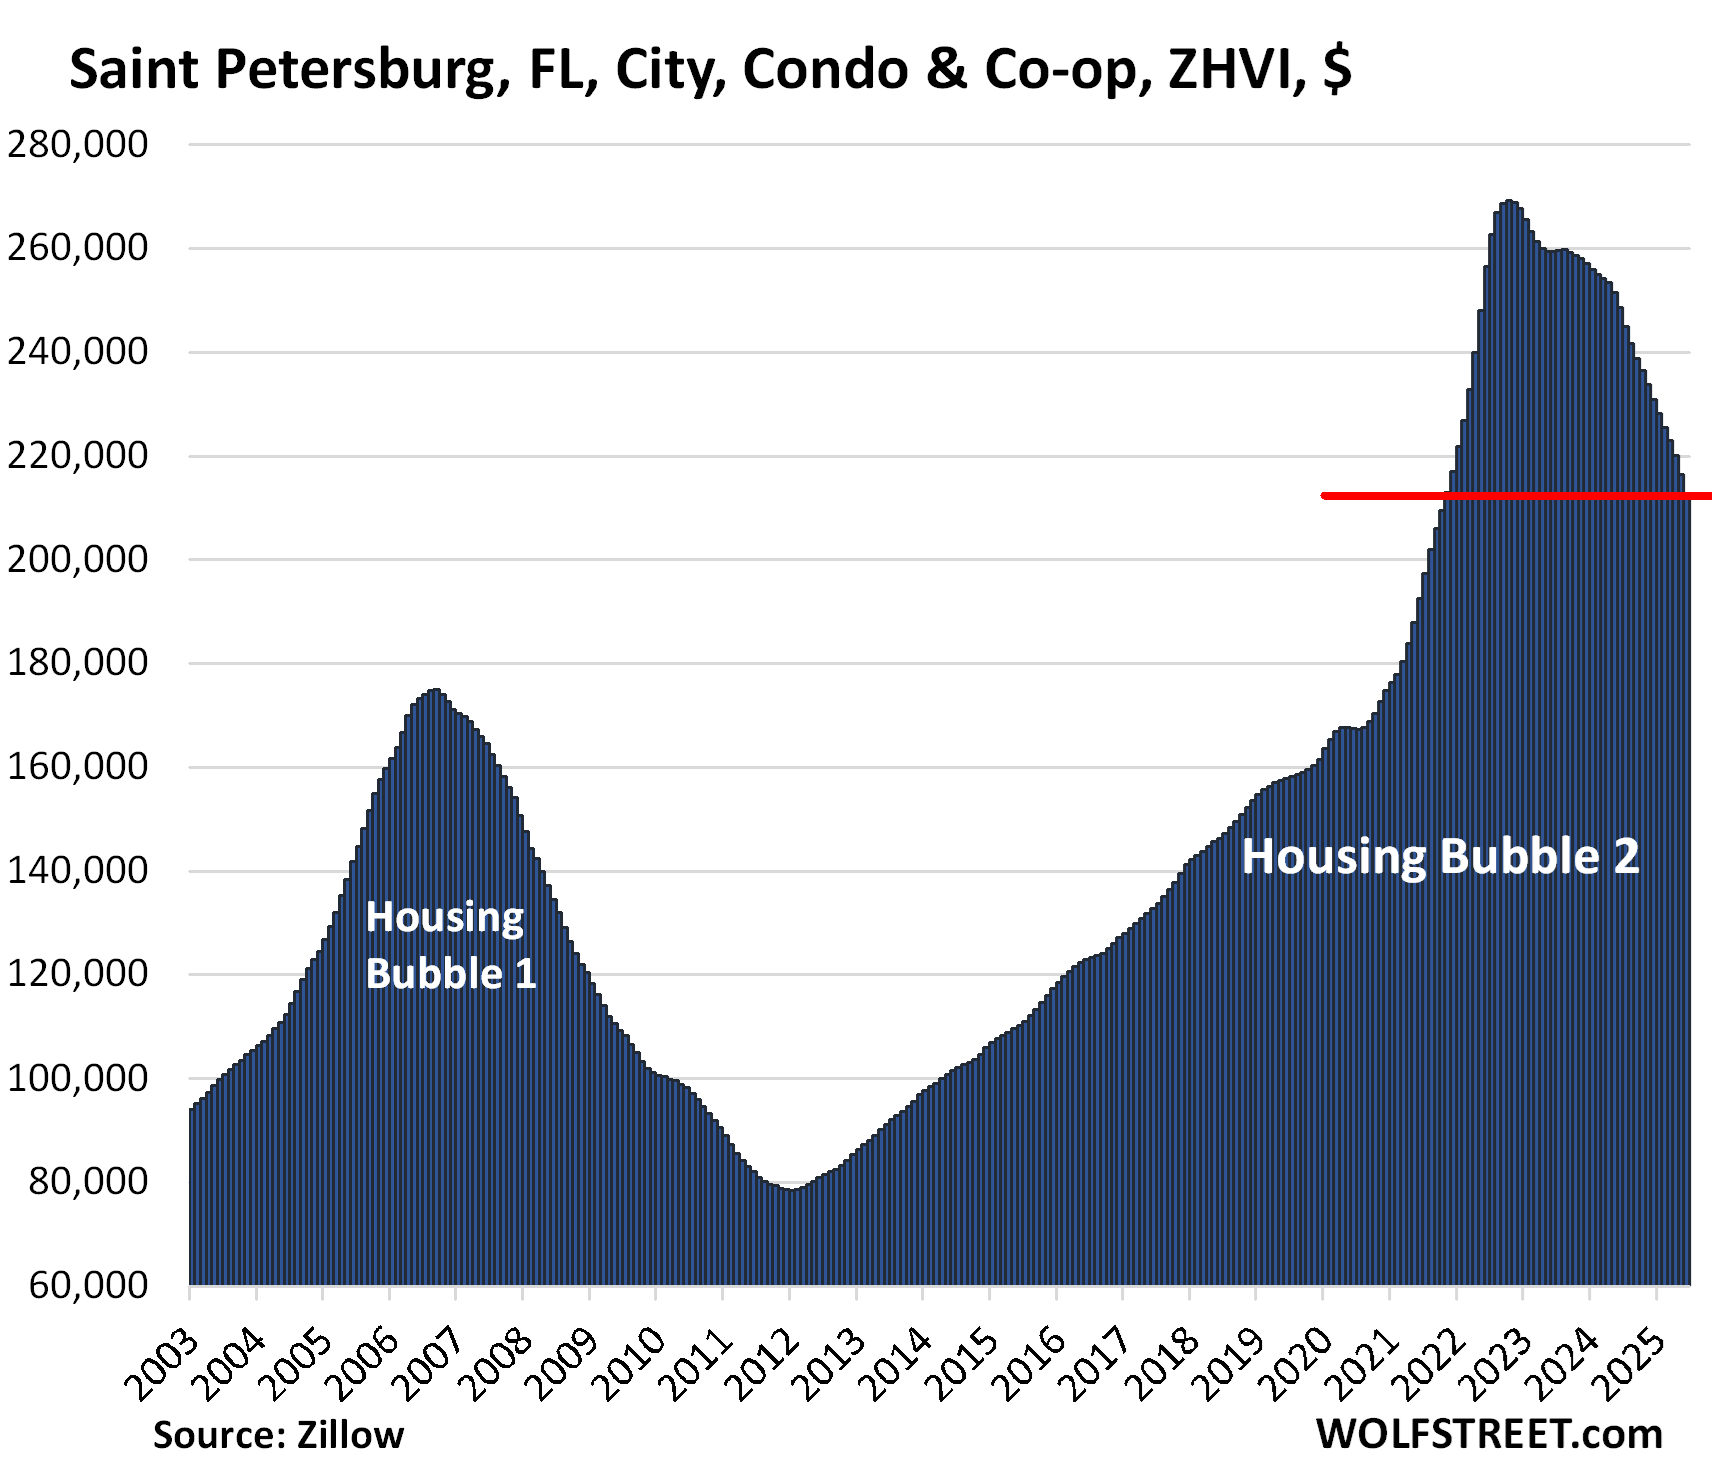
| Saint Petersburg, Fl, City, Condo Prices | |||
| From Oct 2022 peak | MoM | YoY | Since 2000 |
| -21% | -1.8% | -15% | 210% |
Lowest since 2021. Note the 1.8% month-to-month plunge. Taking the elevator down:
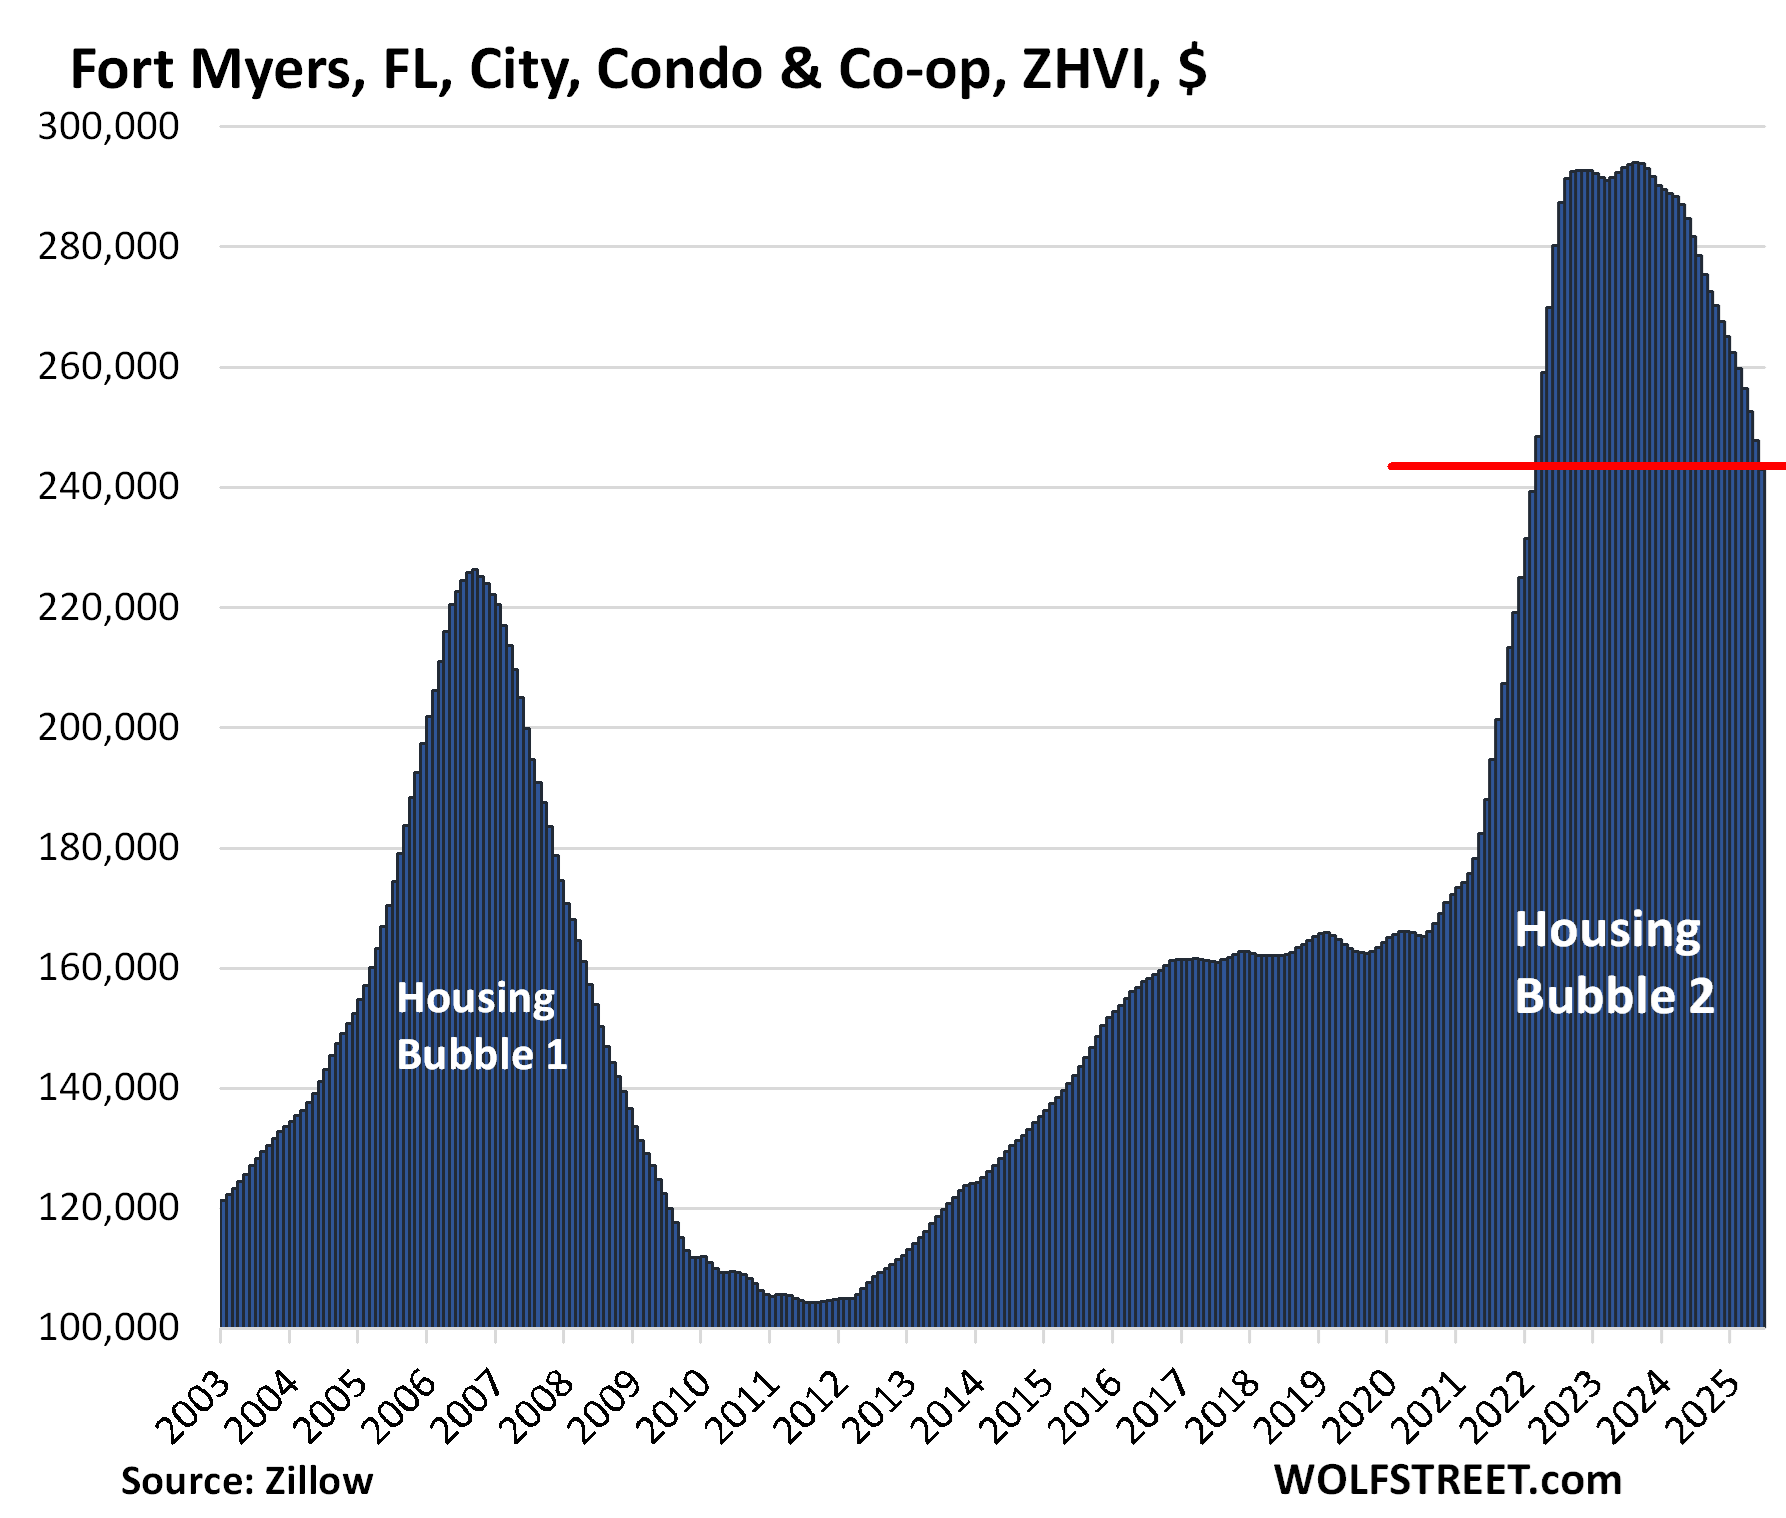
| Fort Myers, FL, City, Condo Prices | |||
| From July 2022 peak | MoM | YoY | Since 2000 |
| -17% | -2.0% | -14% | 147% |
A 2.0% plunge in June from May and a 14% year-over-year plunge: also taking the elevator down:
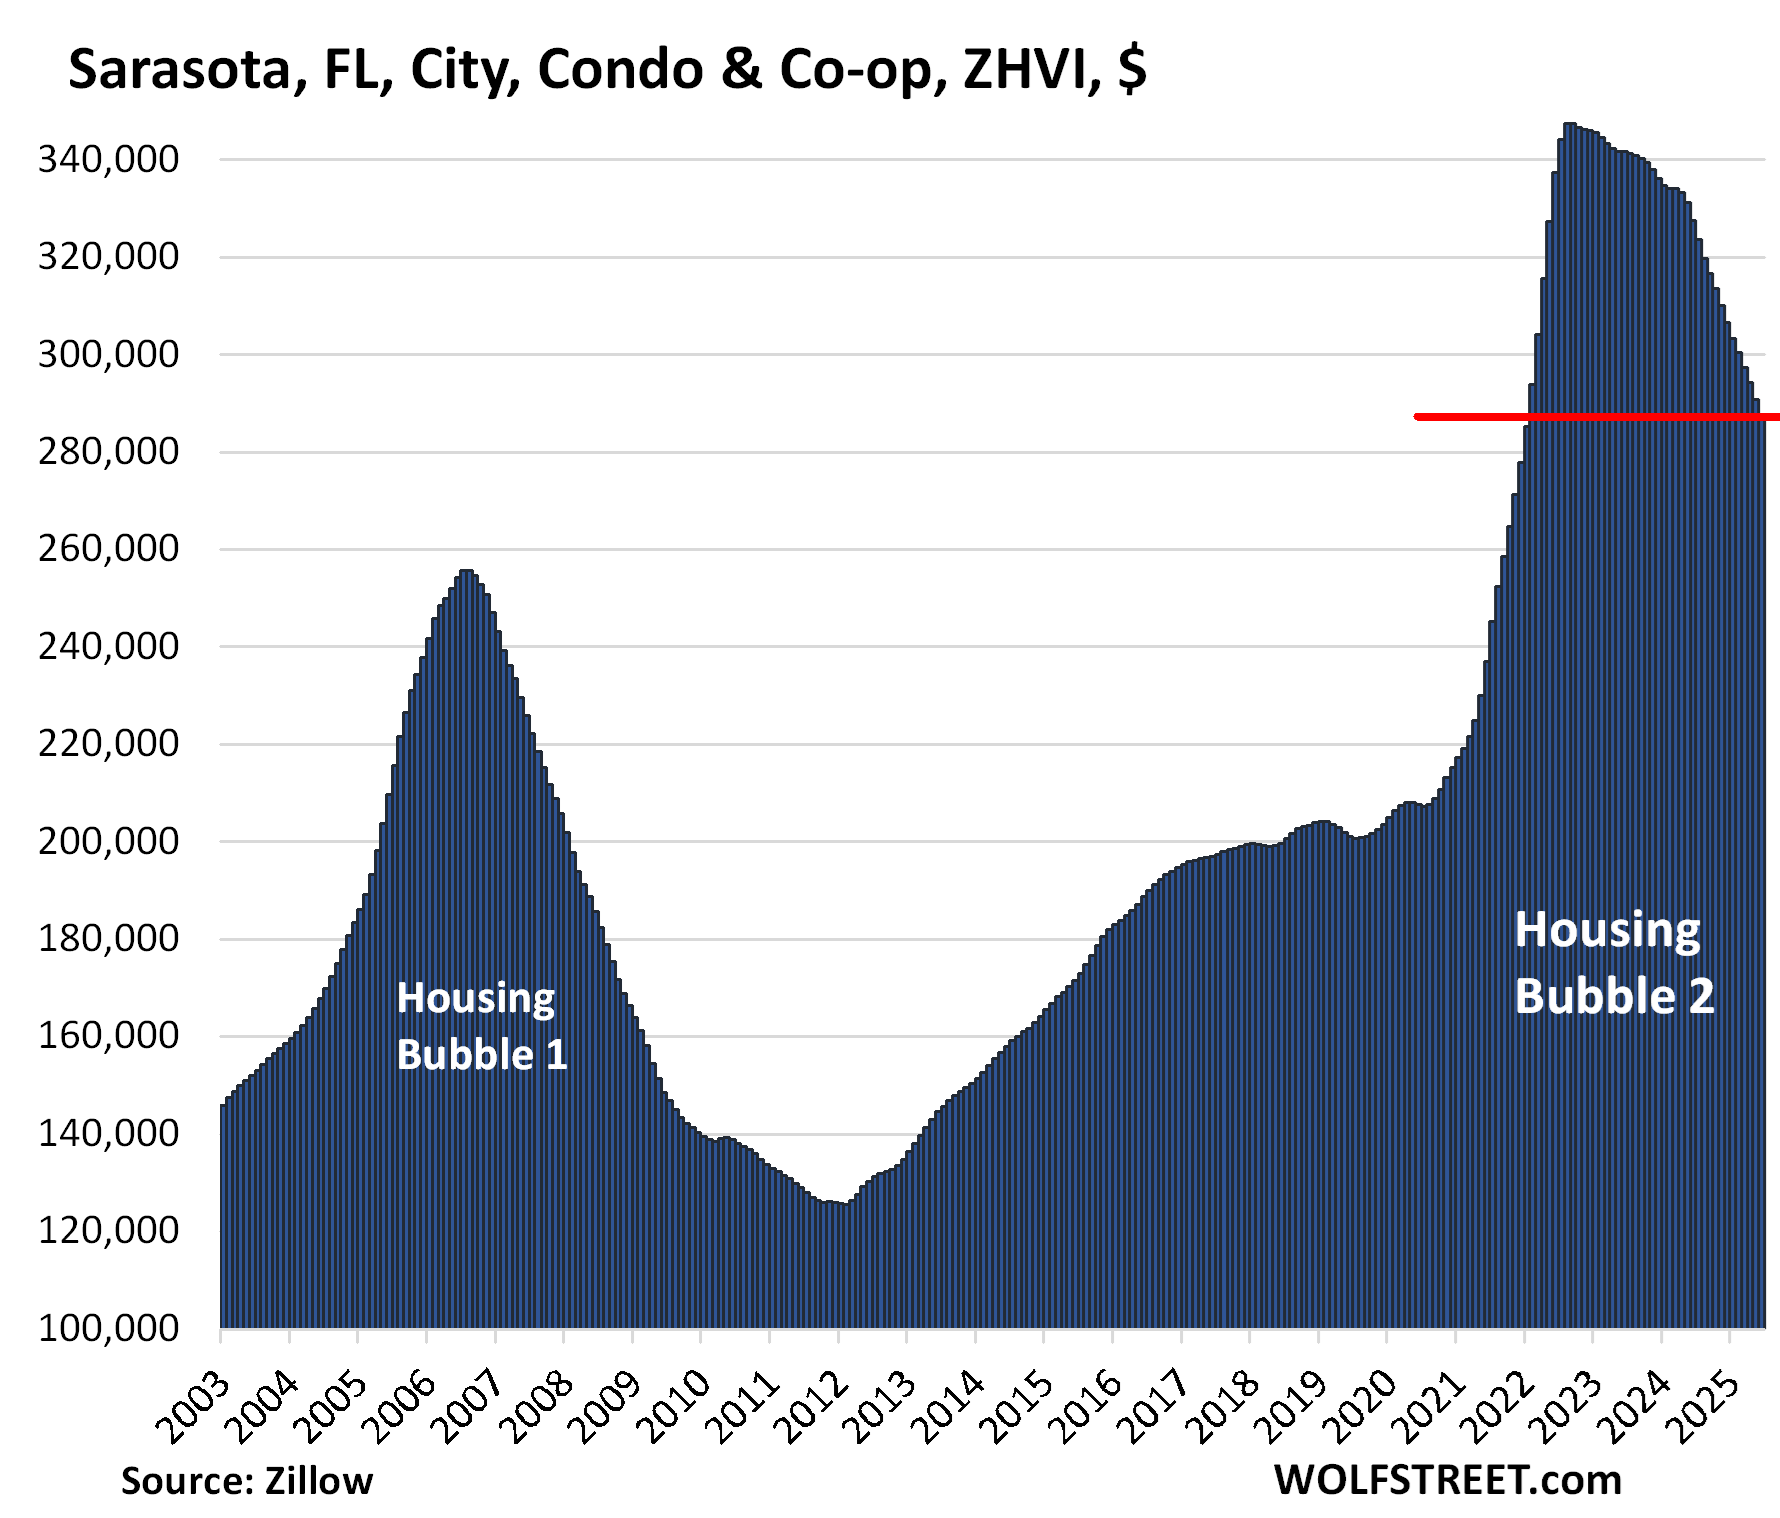
| Sarasota, FL, City, Condo Prices | |||
| From Jul 2022 peak | MoM | YoY | Since 2000 |
| -17% | -1.3% | -12.4% | 158.4% |
Note the big month-to-month drop, going down at a brisk pace.
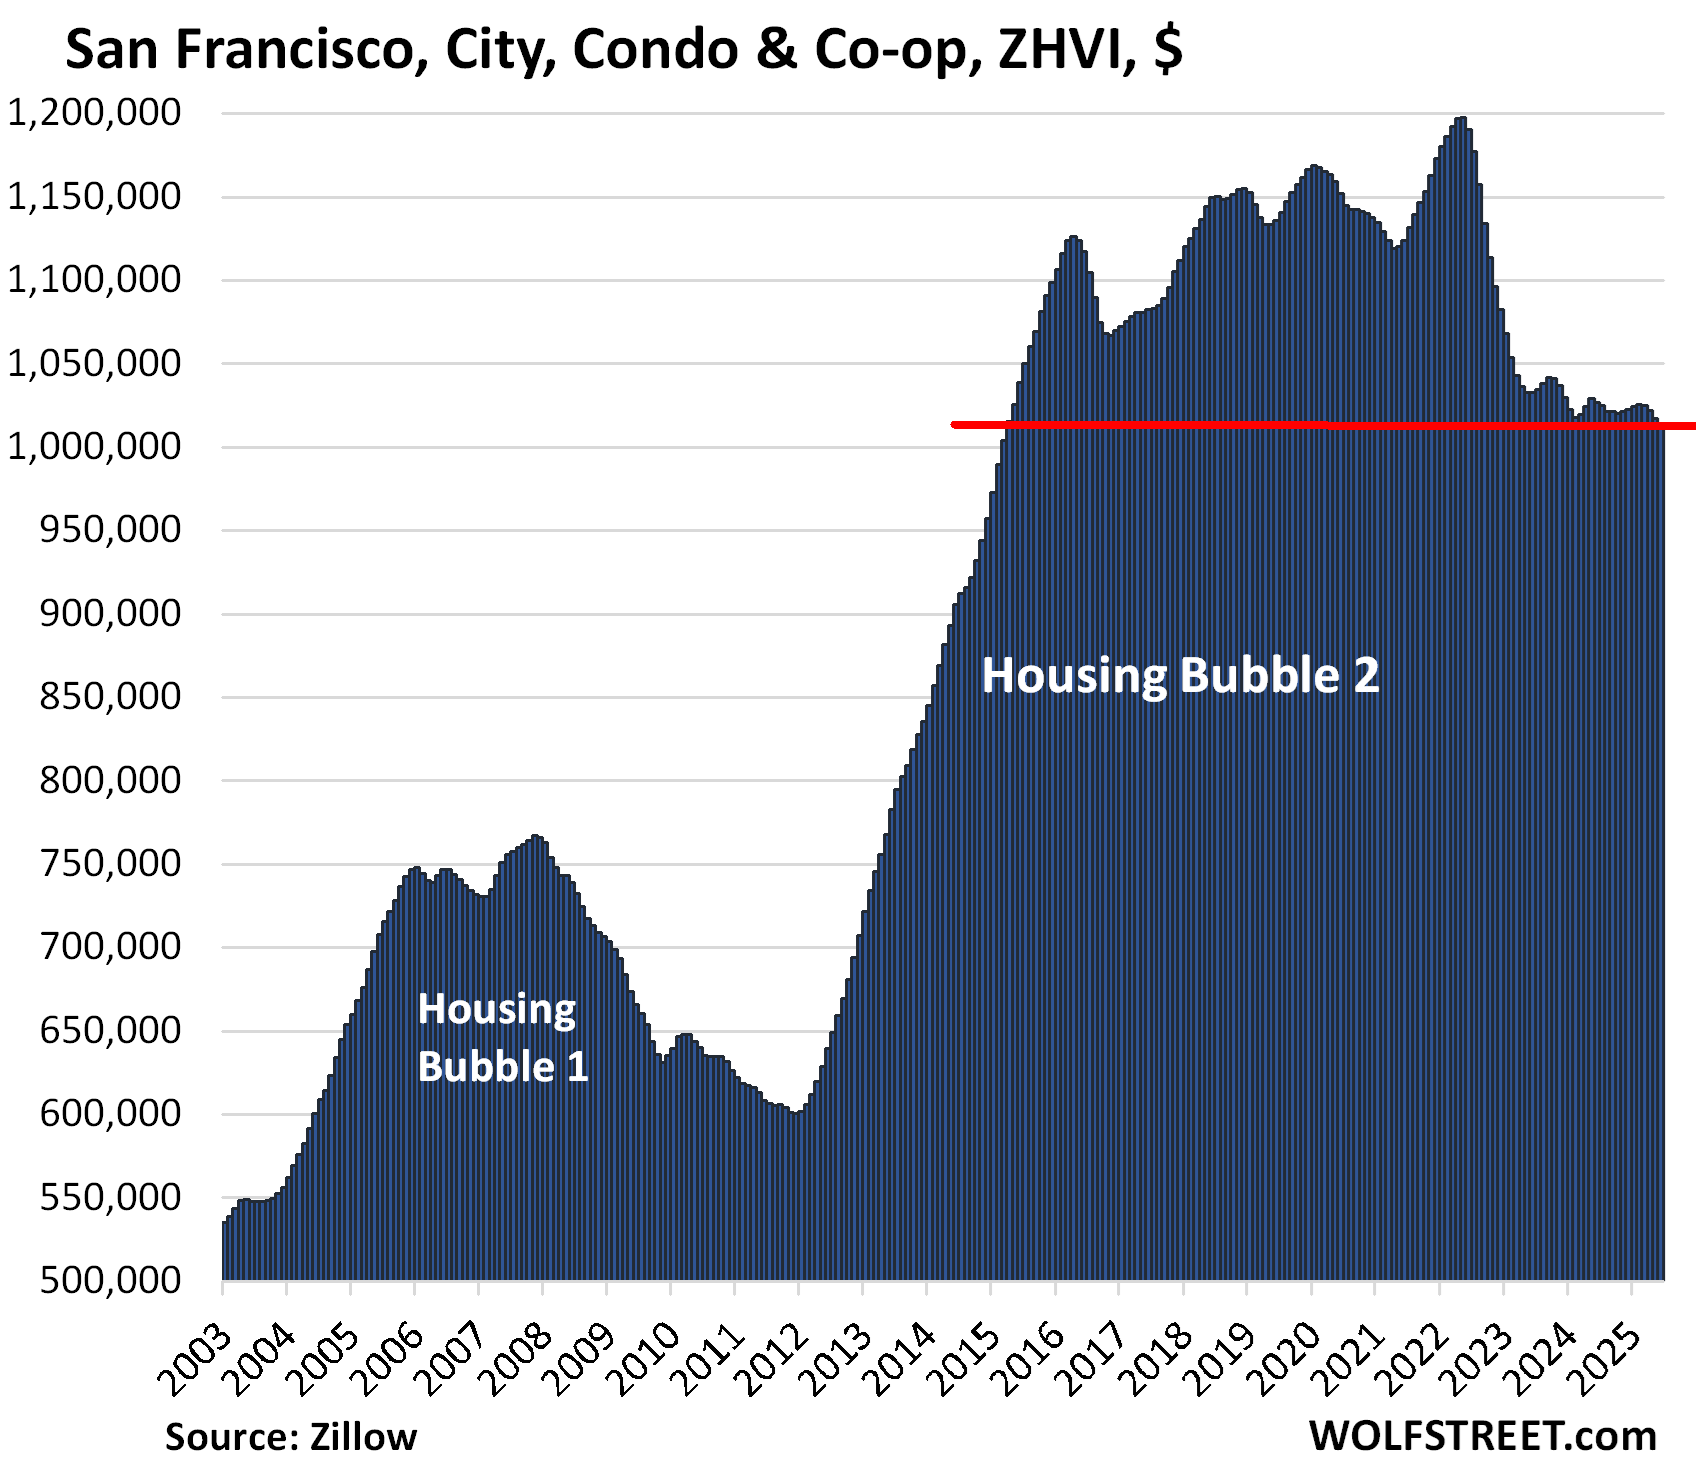
| San Francisco, CA, City, Condo Prices | |||
| From May 2022 peak | MoM | YoY | Since 2000 |
| -16% | -0.5% | -1.5% | 141% |
Back to early 2015.
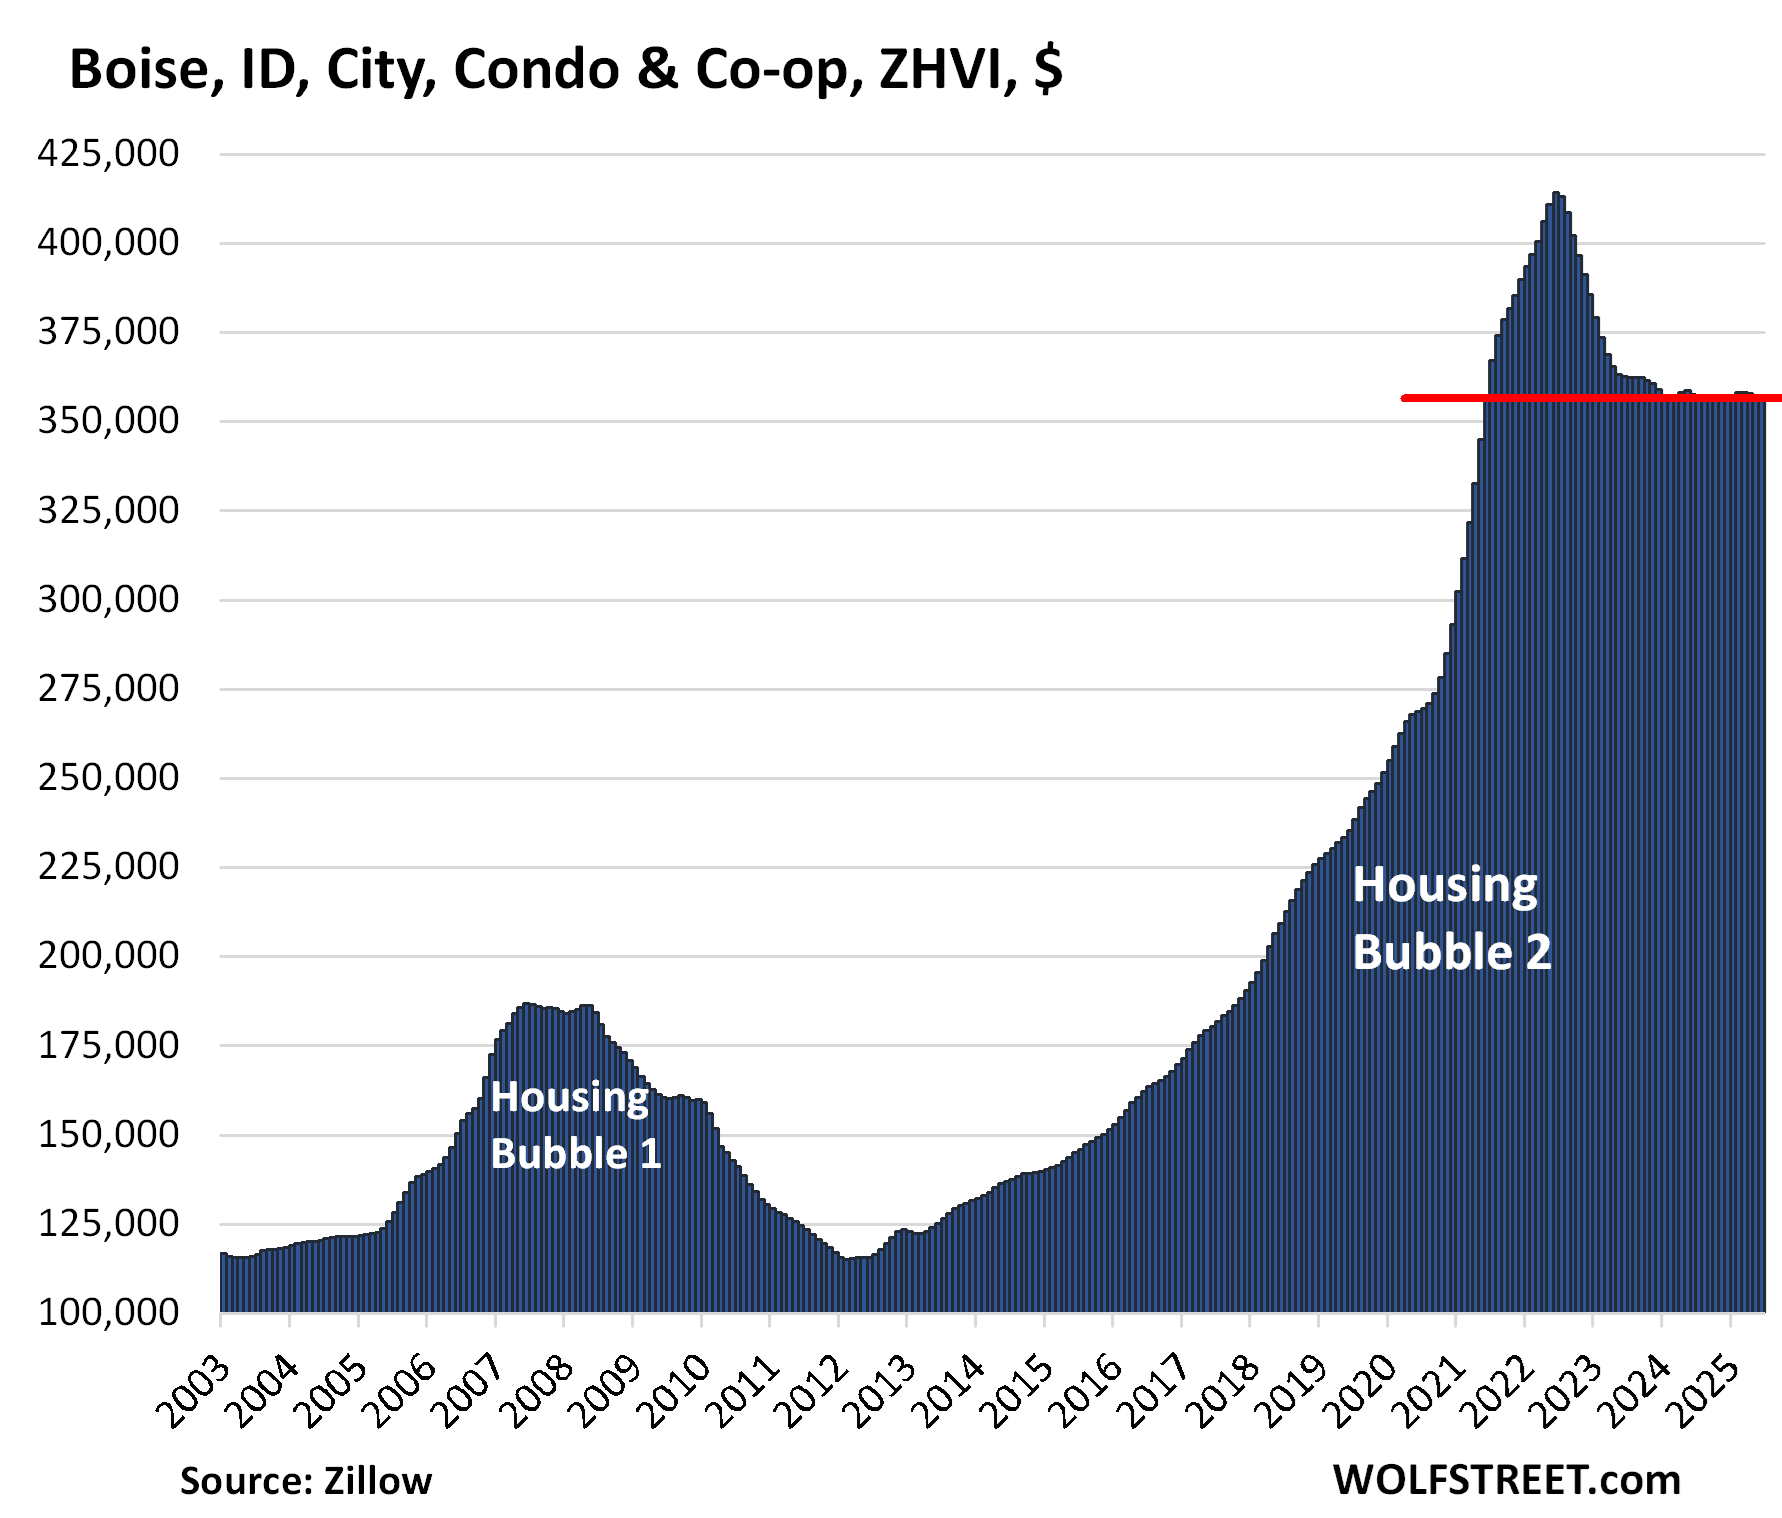
| Boise, ID, City, Condo Prices | |||
| From Jun 2022 peak | MoM | YoY | Since 2001 |
| -14% | -0.1% | 0% | 221% |
Back to 2021.
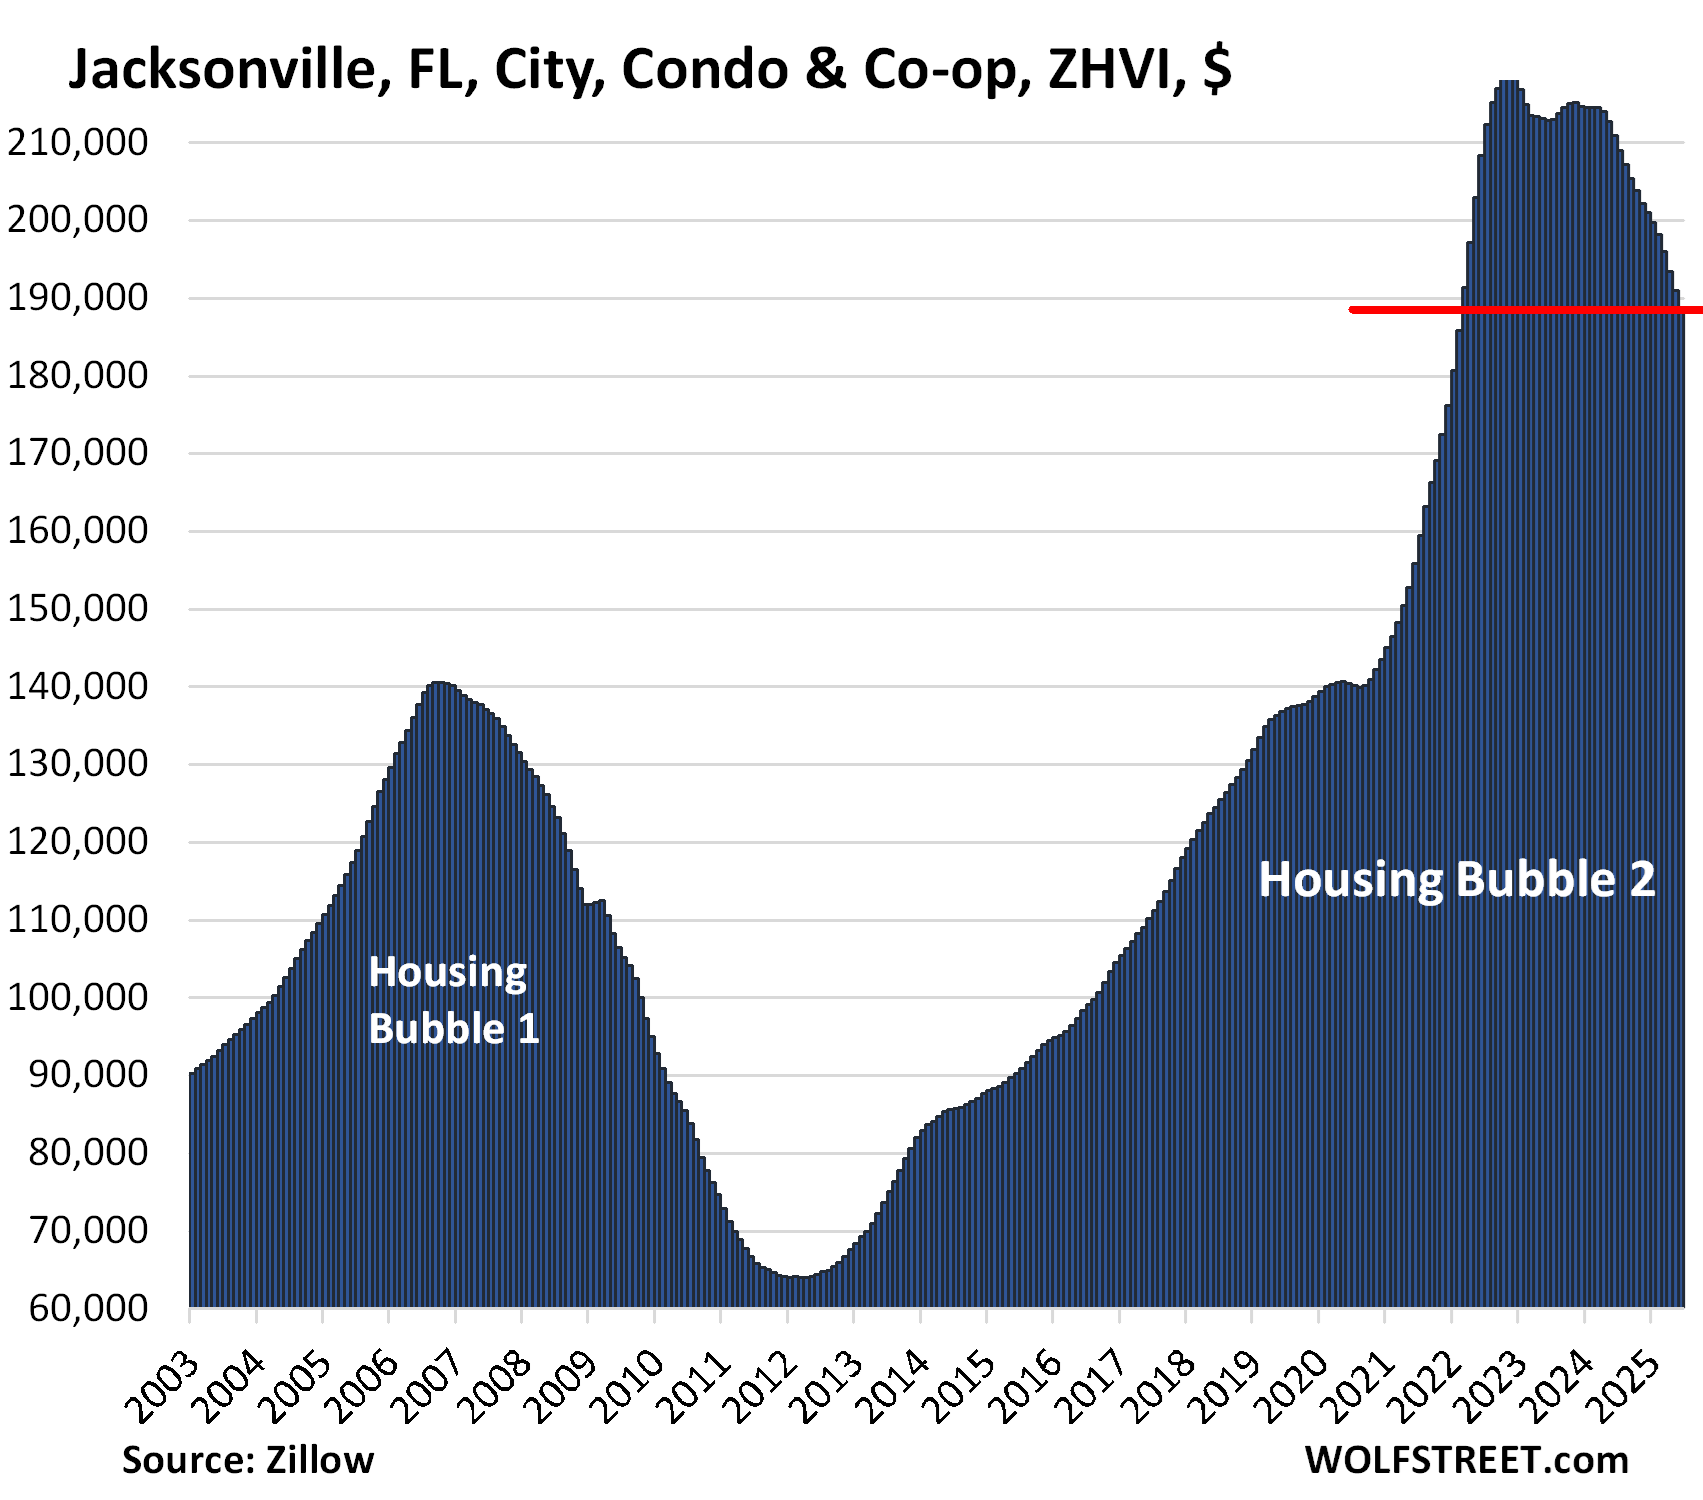
| Jacksonville, FL, City, Condo Prices | |||
| From Nov 2022 peak | MoM | YoY | Since 2000 |
| -14% | -1.2% | -10.5% | 161% |
Back only to early 2022.
| Detroit, MI, City, Condo Prices | |||
| From Sep 2021 peak | MoM | YoY | Since 2000 |
| -13% | -0.3% | -4.1% | 270% |
Where prices had first been in 2018.
| Denver, CO, City, Condo Prices | |||
| From Jul 2022 peak | MoM | YoY | Since 2000 |
| -13% | -0.9% | -7.1% | 142% |
Back to July 2021.
| Tampa, FL, City, Condo Prices | |||
| From Sep 2022 peak | MoM | YoY | Since 2000 |
| -13% | -1.2% | -9.5% | 280% |
| Arlington, TX, City, Condo Prices | |||
| From Jun 2024 peak | MoM | YoY | Since 2000 |
| -13% | -0.6% | -13.1% | 244% |
Prices had soared by 262% in the 10 years to June 2024. Half of that increase came during the four years from mid-2020 through mid-2024.
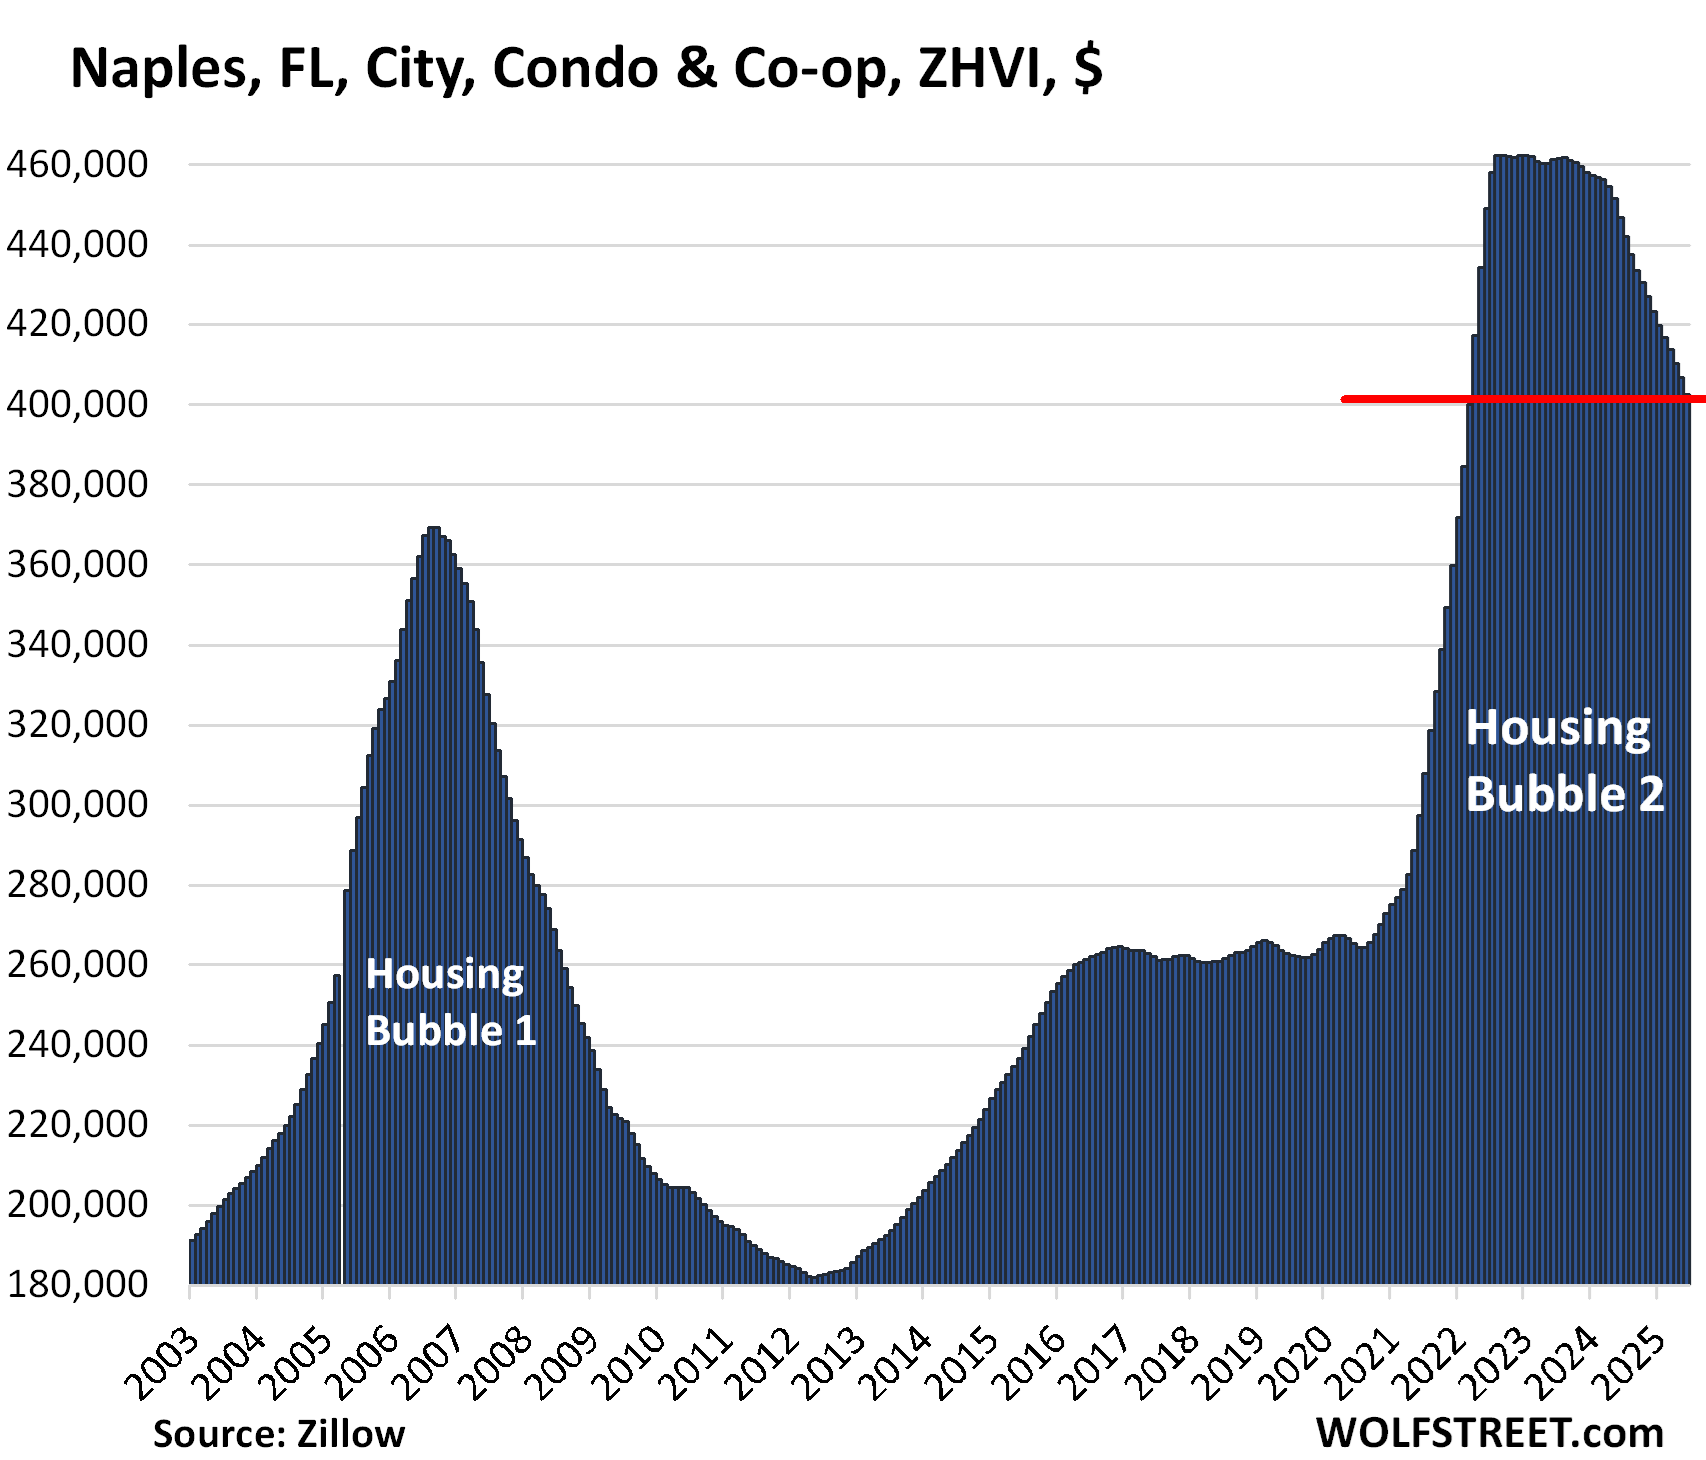
| Naples, FL City, Condo & Co-op Prices | |||
| From Aug 2022 peak | MoM | YoY | Since 2000 |
| -13% | -1.1% | -9.9% | 167.3% |
These condo bubbles are quite something. Prices exploded by 73% in just two years. They have unwound about one-third of it now – roughly the spike of April, May, June, and July of 2022. Buyers were just nuts:
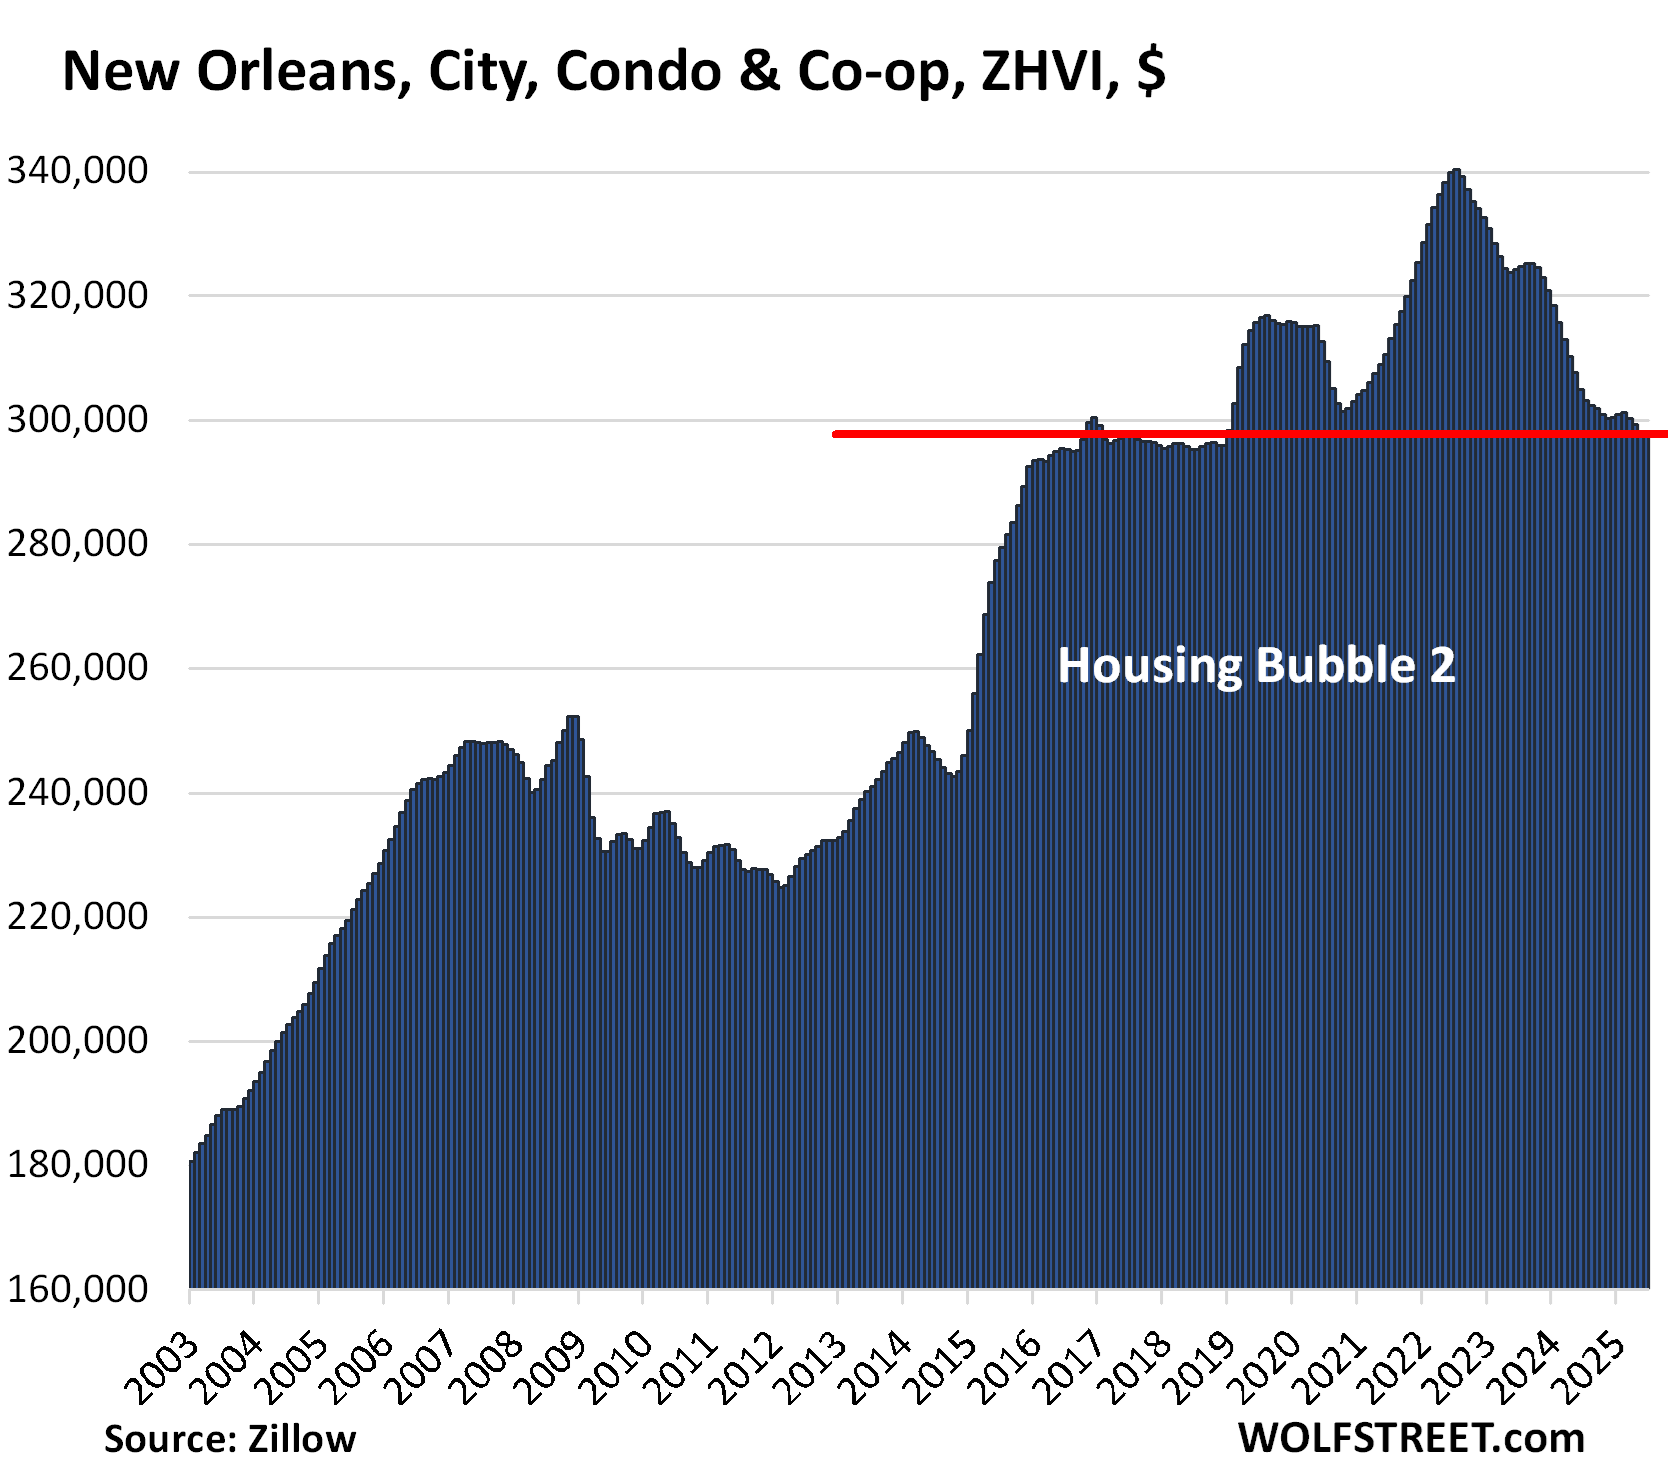
| New Orleans, LA, City, Condo Prices | |||
| From Jun 2022 peak | MoM | YoY | Since 2000 |
| -13% | -0.2% | -2.5% | 100% |
Back to 2016.
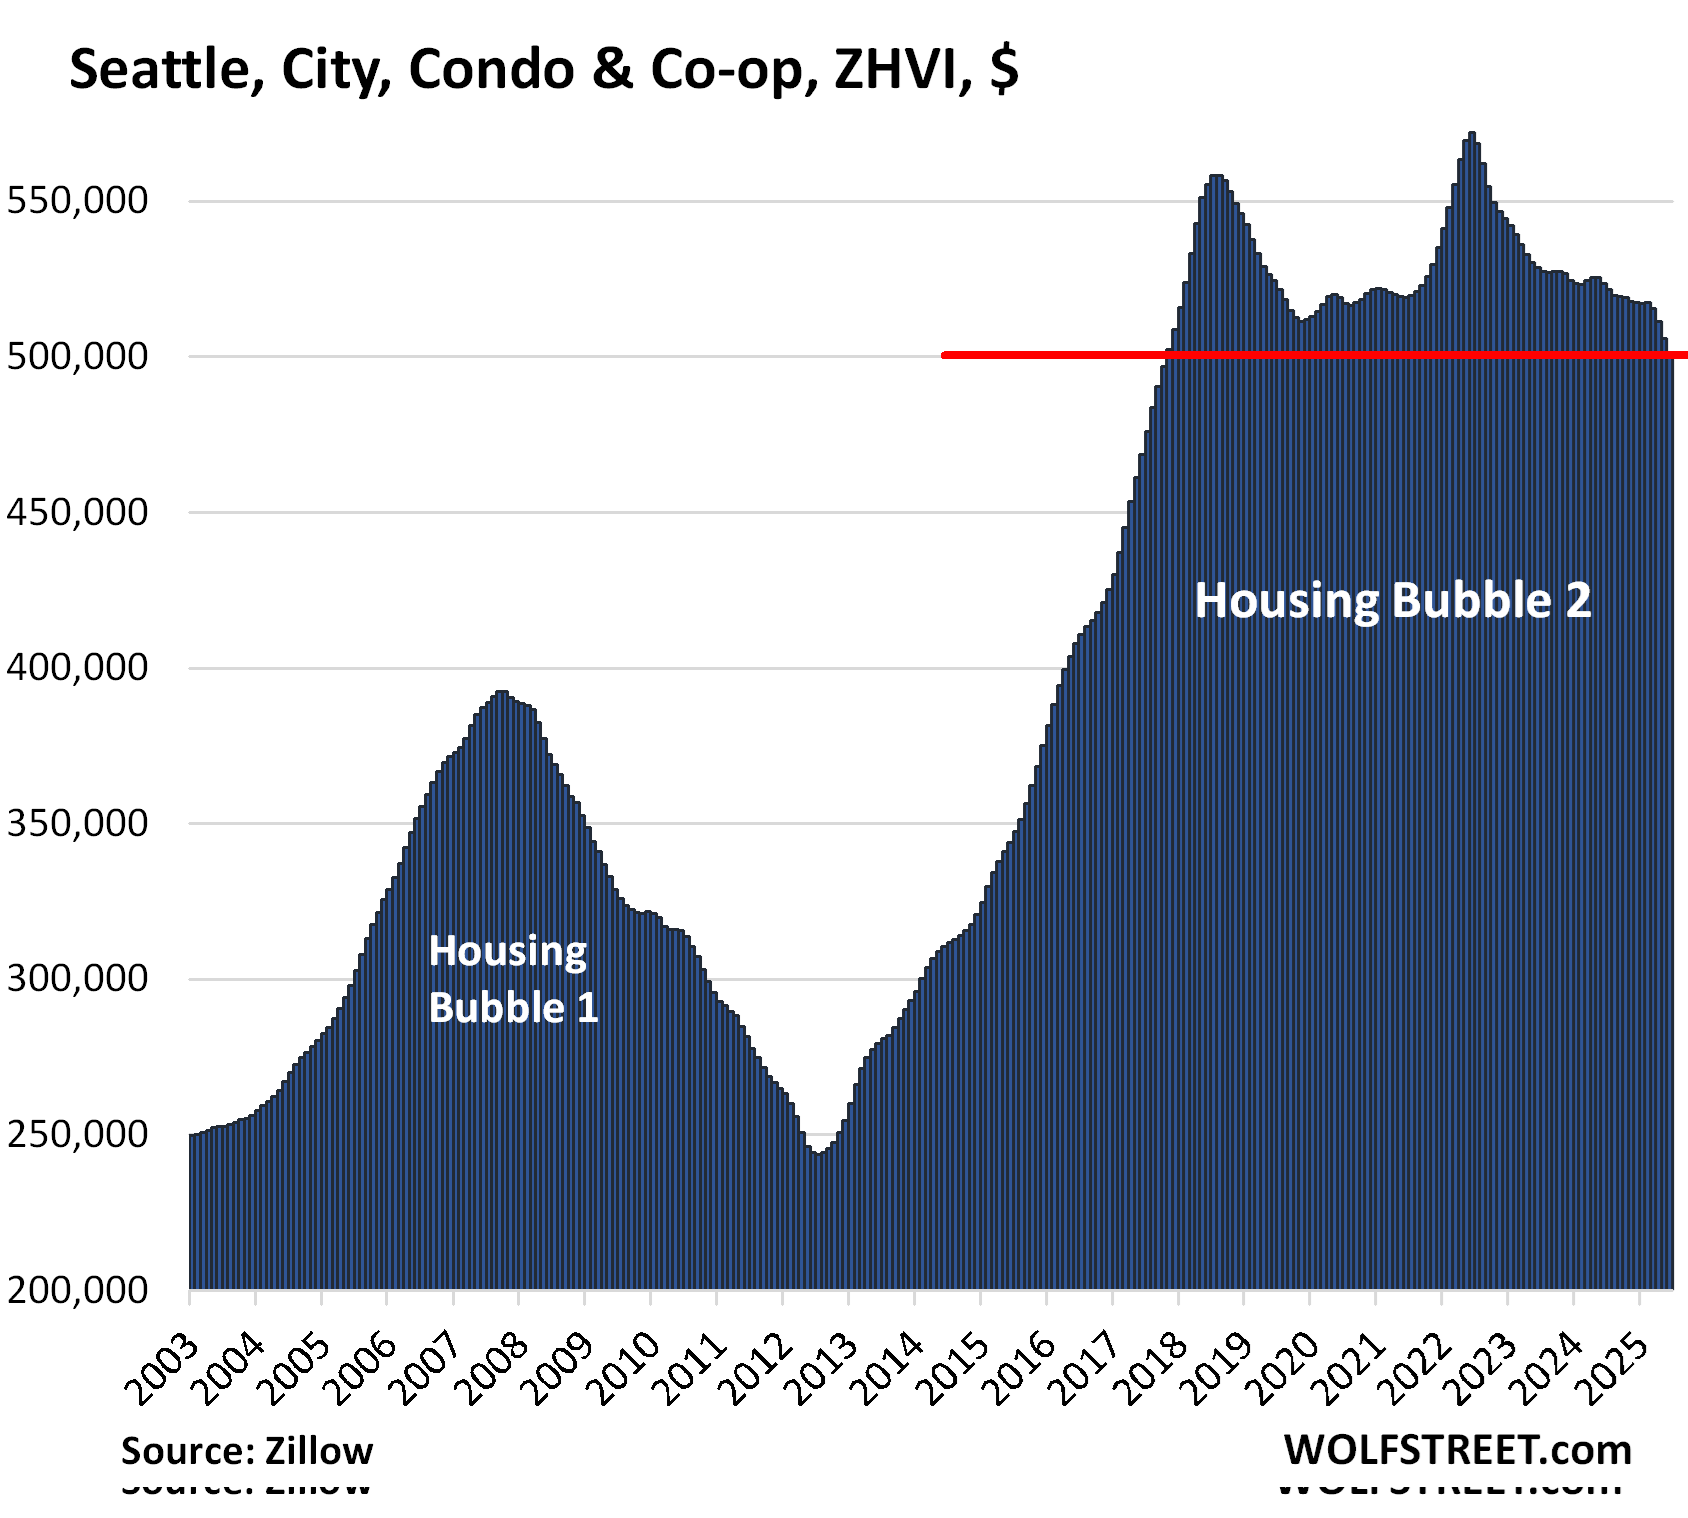
| Seattle, WA, City Condo Prices | |||
| From Jun 2022 peak | MoM | YoY | Since 2000 |
| -13% | -1.1% | -4.4% | 140% |
Back to November 2017.
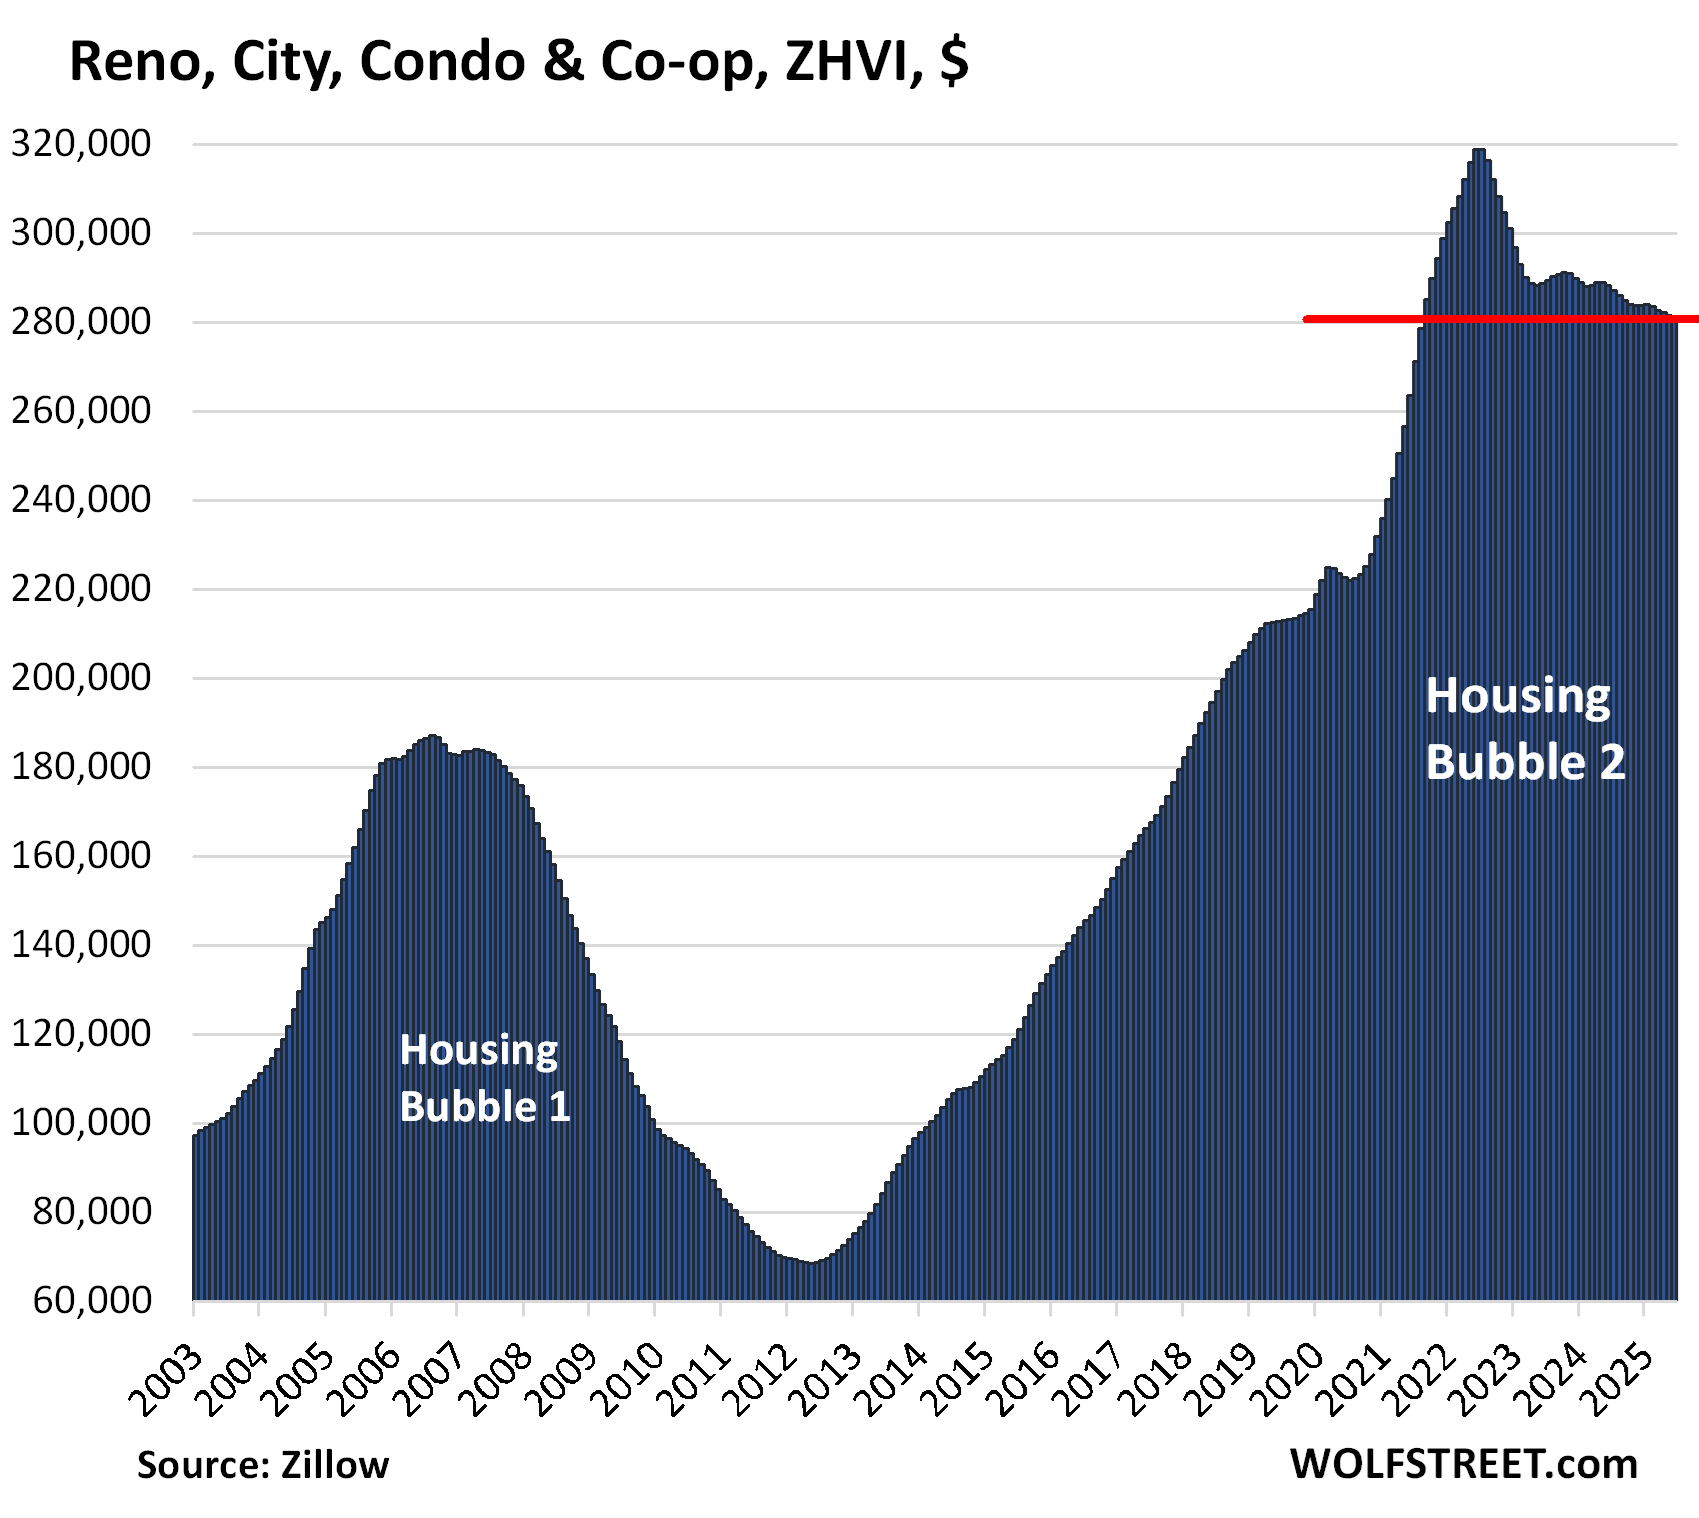
| Reno, NV, City, Condo Prices | |||
| From Jun 2022 peak | MoM | YoY | Since 2000 |
| -12% | -0.4% | -2.7% | 254% |
| Mesa, AZ, City, Condo Prices | |||
| From Aug 2022 peak | MoM | YoY | Since 2000 |
| -12% | -0.4% | -4.8% | 210% |
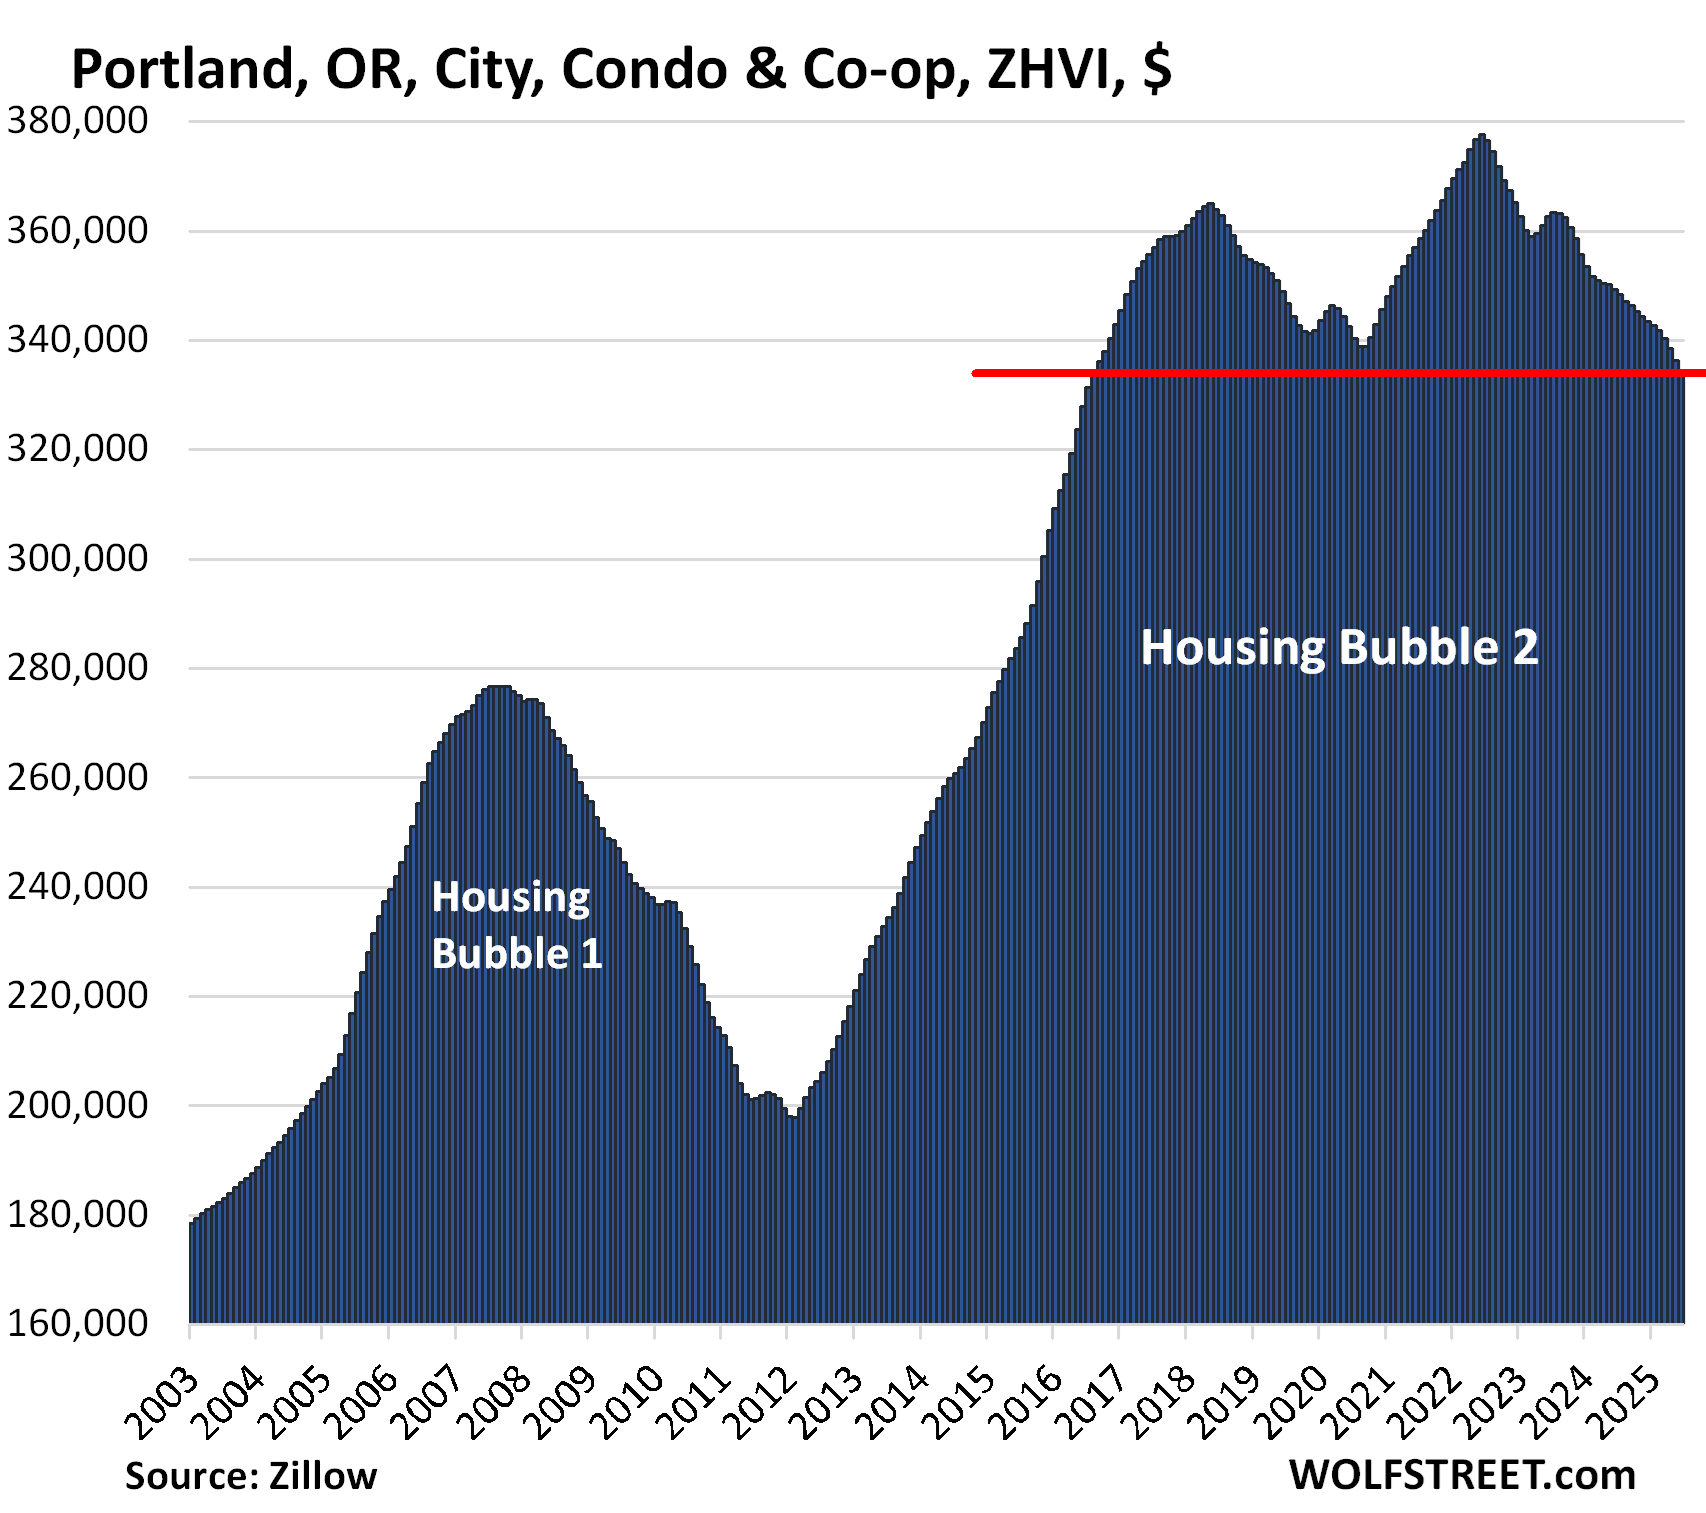
| Portland, OR, City, Condo Prices | |||
| From Jun 2022 peak | MoM | YoY | Since 2000 |
| -12% | -0.6% | -4.3% | 113% |
Back to 2016.
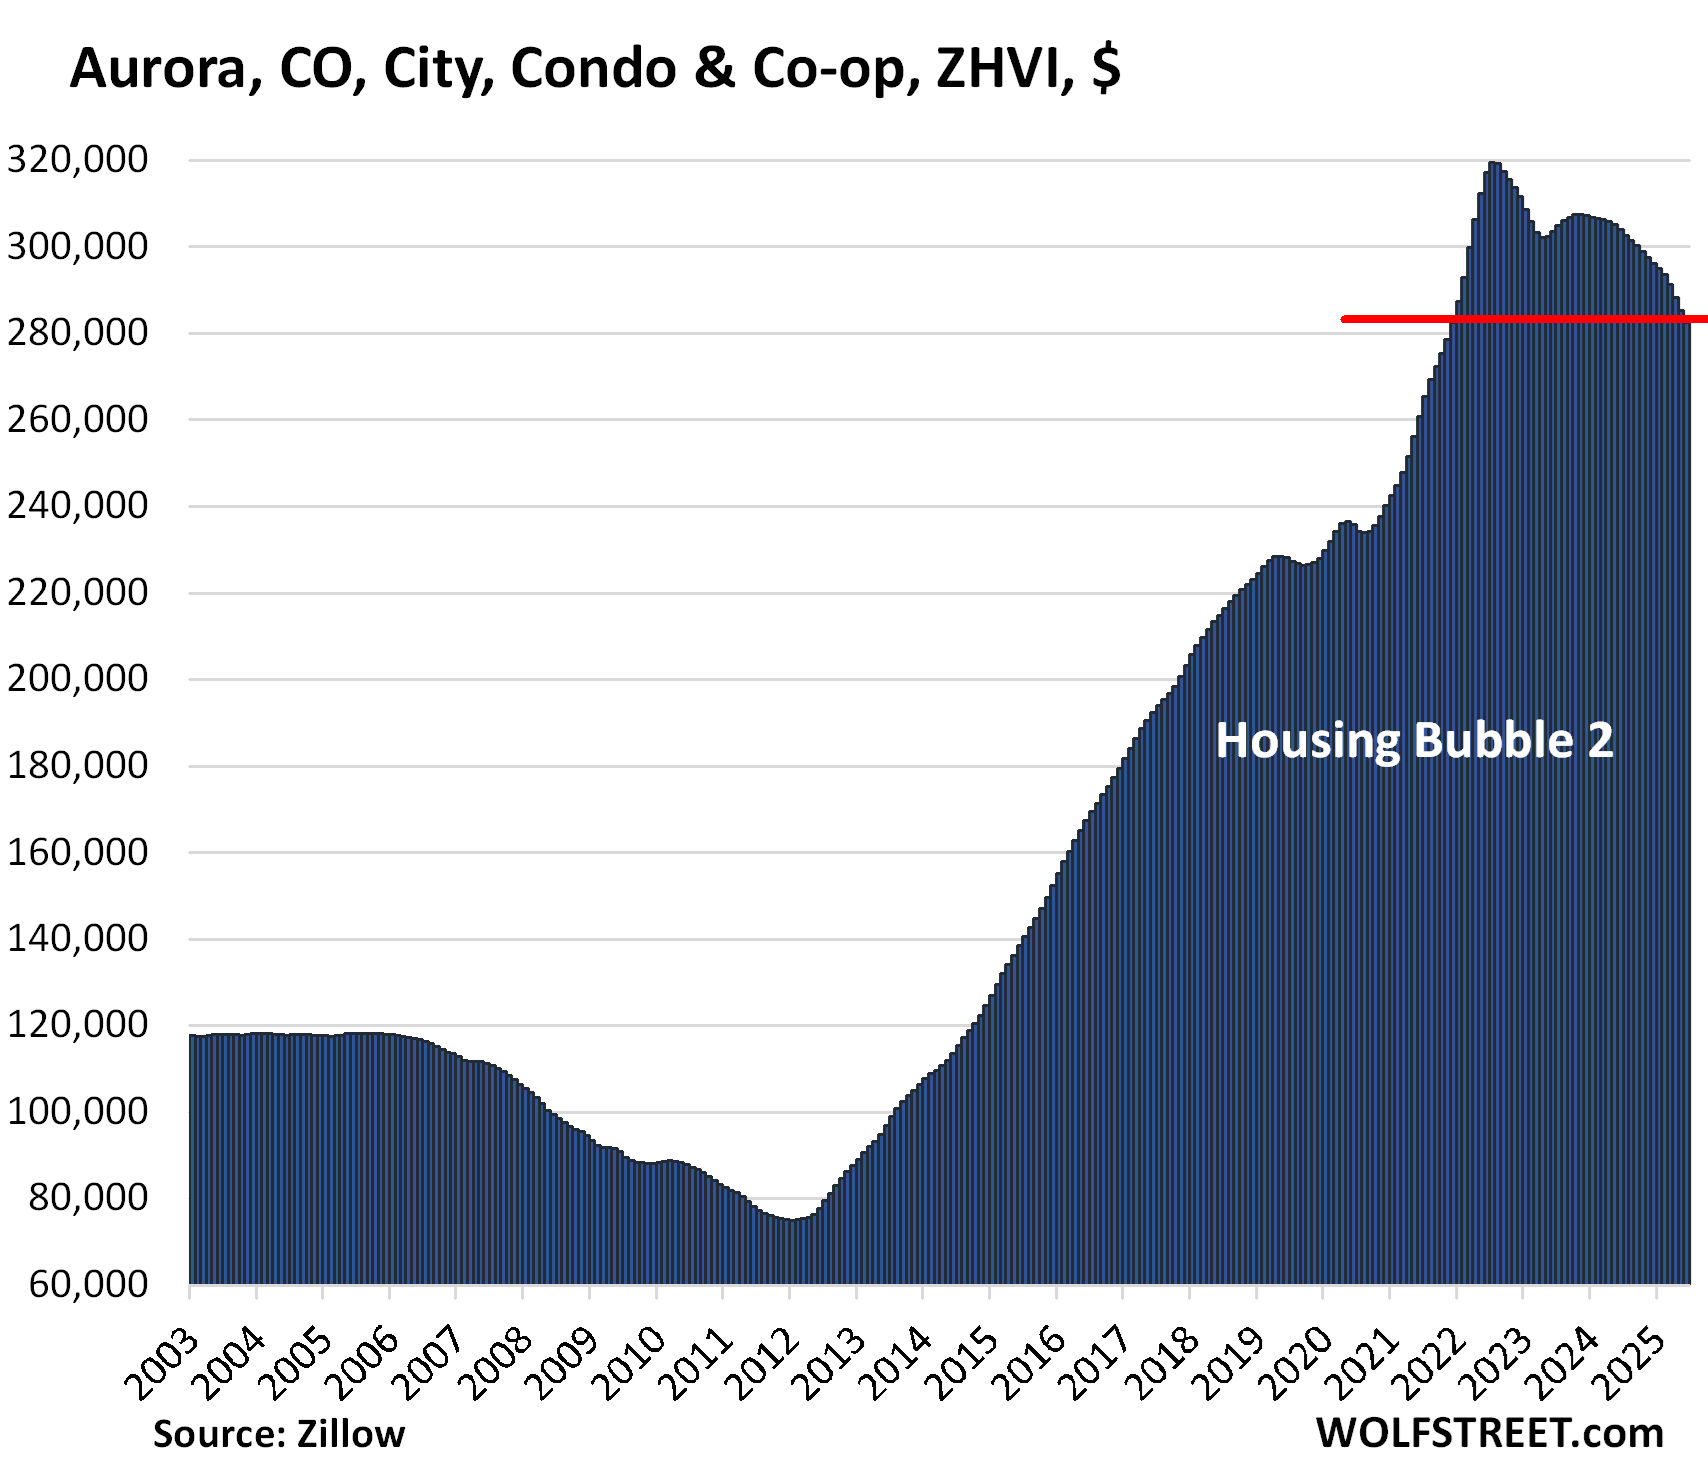
| Aurora, CO, City, Condo Prices | |||
| From Jul 2022 peak | MoM | YoY | Since 2000 |
| -12% | -1% | -7% | 213% |
Enjoy reading WOLF STREET and want to support it? You can donate. I appreciate it immensely. Click on the mug to find out how:

![]()
Gen Z and Gen Milli rejoice
Condo prices should decline however the HOA fees and taxes have in general have climbed so high the numbers don’t work So well for folks looking for reasonably priced monthly fees In a place to live
My condo is crashing! Guess I’ll put all my money in something stable, like some bits in the computer.
Interesting to see Aurora, CO. Mostly because when I used to live there we called it Saudi Aurora because it was way out there in the Middle East. Also, not the most desirable area because of its distance from everything.
Great to see! Condos must crash first. Then single family homes. Good news for the younger generation!
Yes condos are the Canary In The Coal Mine. Next to fall are the outlying areas.
Two things just jump off the page.
Reno’s decline in the 2008 bubble! Could be the worst percentage wise in recent history
Most of the current dramatic declines showing no signs of stabilizing are in Florida.