Of “Fracklogs,” global Tanker Jams, and Cheating.
By ISA Intel, Oil & Energy Insider:
In the latest edition of the Numbers Report, we’ll take a look at some of the most interesting figures put out this week in the energy sector. Each week we’ll dig into some data and provide a bit of explanation on what drives the numbers.
Let’s take a look.
1. Drilled but uncompleted wells
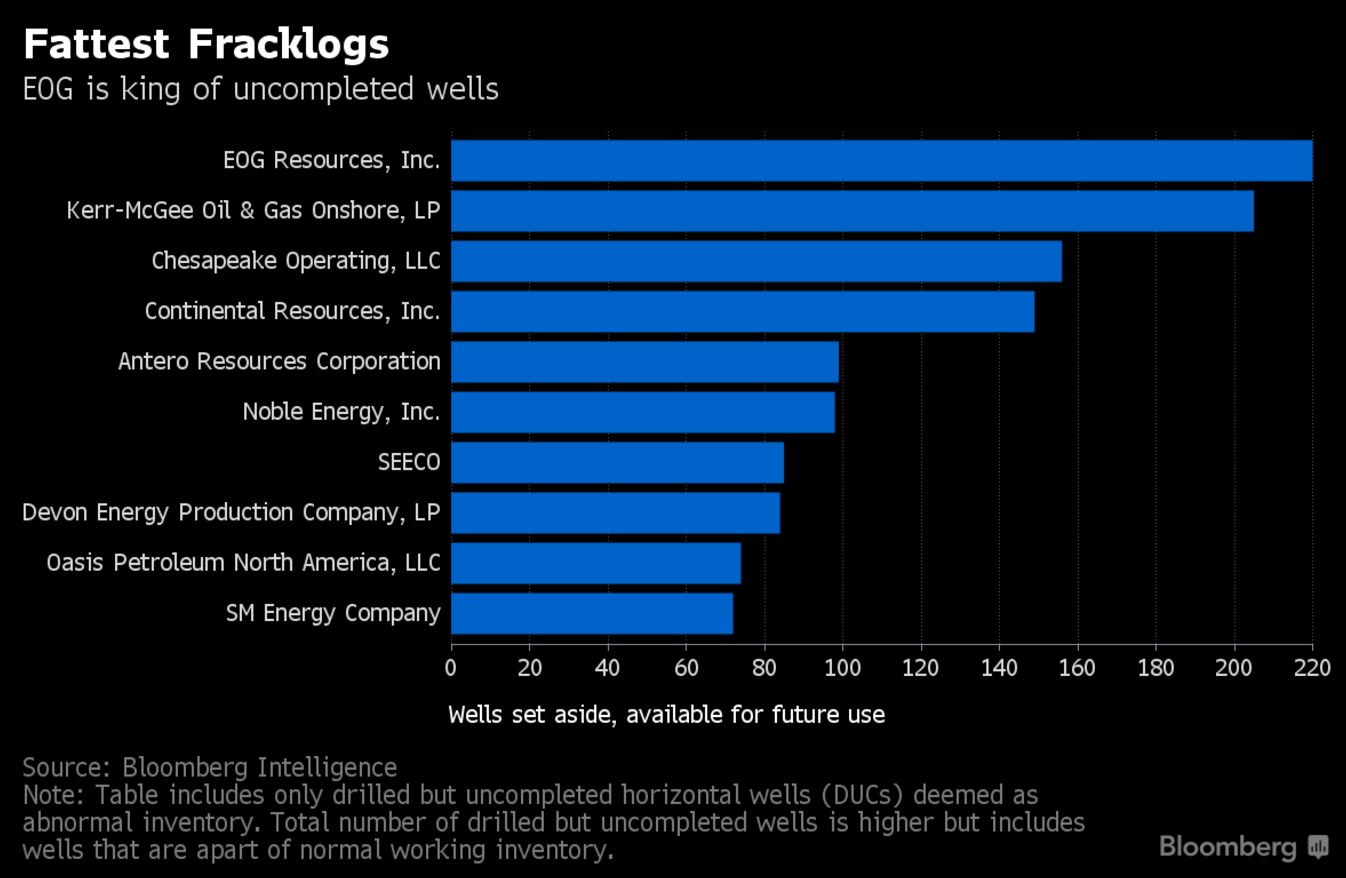
Oil is almost back to $50, raising the prospect of a flood of new oil from wells that suddenly become profitable. Before oil from newly drilled wells comes online, there could be an initial onslaught of production from drilled but uncompleted wells (DUCs).
According to Wood Mackenzie, the 50 largest publically traded oil companies have an average breakeven price of $53 per barrel, tantalizingly close to today’s prices. The DUCs may not be completed in earnest until prices reach the mid-$50s, Bloomberg Intelligence says.
The wave of drilling and completions might not come roaring back, however, after companies were burned last year when prices briefly moved up to $60 per barrel only to fall back again.
But as completions pick up pace, new output will put downward pressure on WTI, potentially preventing sharper price increases in the short run.
EOG Resources (NYSE: EOG) is one company to watch, a Texas driller that Bloomberg Intelligence says has the largest backlog of DUCs.
2. Oil tanker traffic jam
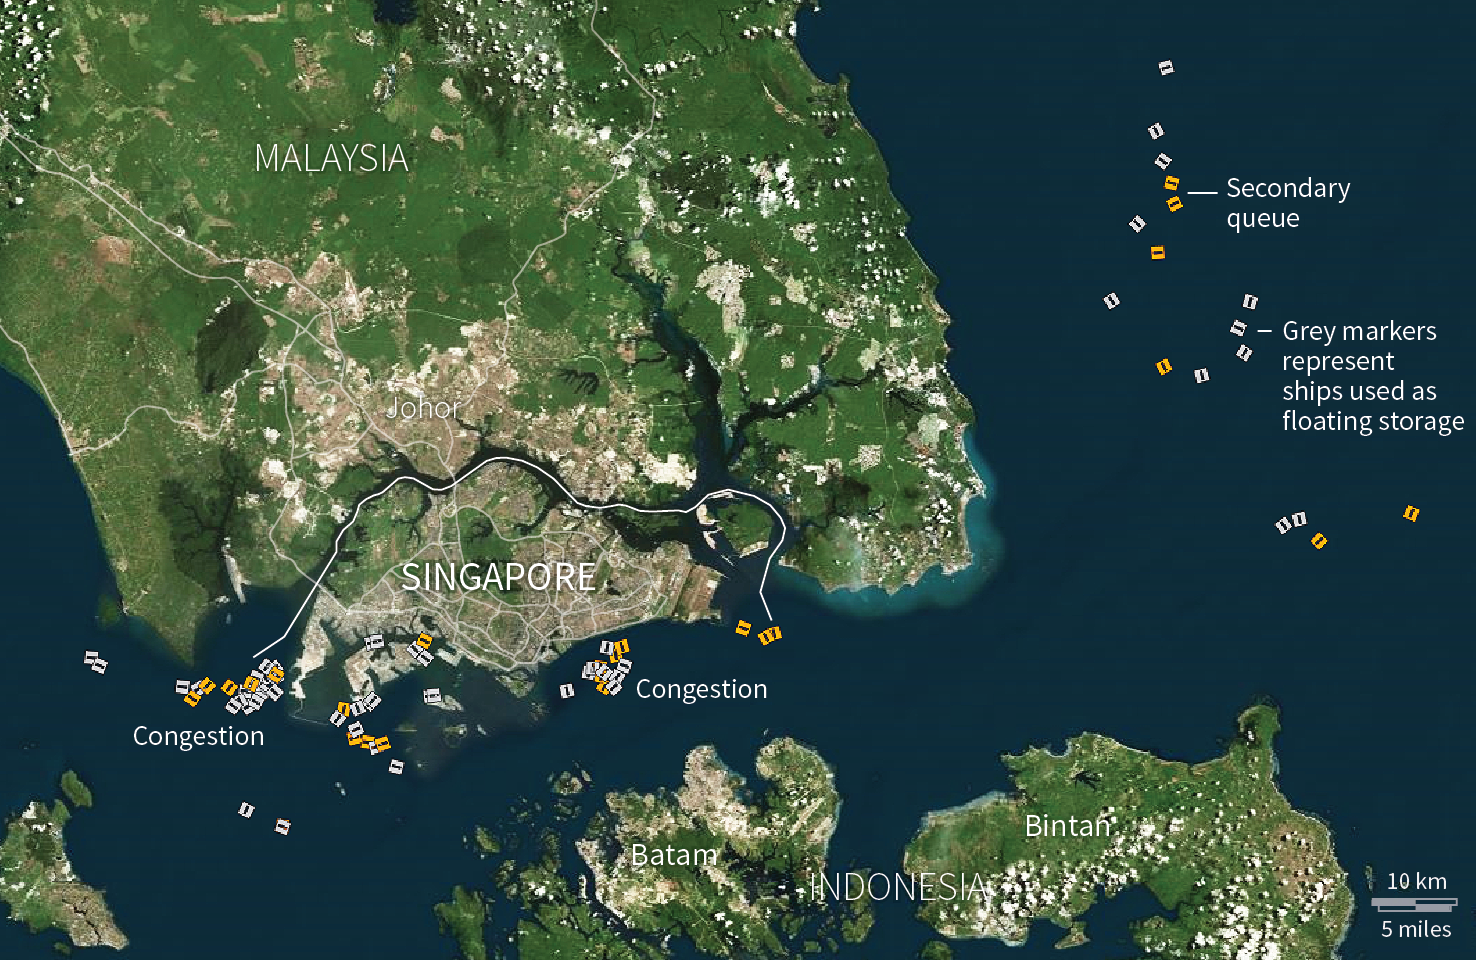
A traffic jam of oil tankers outside several key ports in Asia is a glaring red flag that the crude oil markets are not yet in balance.
Because of Singapore’s strategic location at the Straits of Malacca, it is one of the world’s great oil hubs. Tankers refuel there, large refineries process crude, and onshore containers store crude. But tankers have lined up outside ports in recent weeks, a symptom of a market that is oversupplied.
A Reuters analysis shows a few dozen very large crude carriers (VLCCs) sitting offshore in Singapore, some waiting to unload their cargoes, while others are simply storing crude at sea.
There is congestion in other ports, including Shanghai and Basra. Reuters found that in May there were 19 VLCCs sitting in the Persian Gulf near Iraq, waiting to load up 43 million barrels of crude. Iraq’s oil production has risen so much that it has struggled to export all the volume.
The main takeaway from these satellite images is that the global oil market is still oversupplied, putting pressure on the ability of tanker companies to store oil at sea. This should be viewed as a bearish sign that all is not well.
3. Oil price forecasts see $50 persisting
An array of investment banks raised their price forecasts for crude oil, as WTI and Brent moved from below $30 per barrel in February up to nearly $50 as of early June.
Supply has steadily declined in the U.S. and elsewhere, and demand continues to rise. The IEA sees the supply excess shrinking from 1.3 mb/d in the first half of the year down to just 0.2 mb/d by the second half of 2016.
13 Investment banks surveyed by the Wall Street Journal showed increases in price projections for 2016, the third upward revision in as many months. In May, the group of banks increased their average price for 2016 by $2 per barrel.
The projections are still relatively bearish. The 13 banks have an average price forecast of just $41 per barrel in 2016 and $55 per barrel next year. On the high end, Standard Chartered calls for $60 oil before the end of the year. The gloomier Morgan Stanley sees crude trading below $30 by the fourth quarter. On average, the 13 banks see crude at $48 per barrel in the fourth quarter, which is where oil is trading at today.
4. Price volatility crashes as oil holds steady
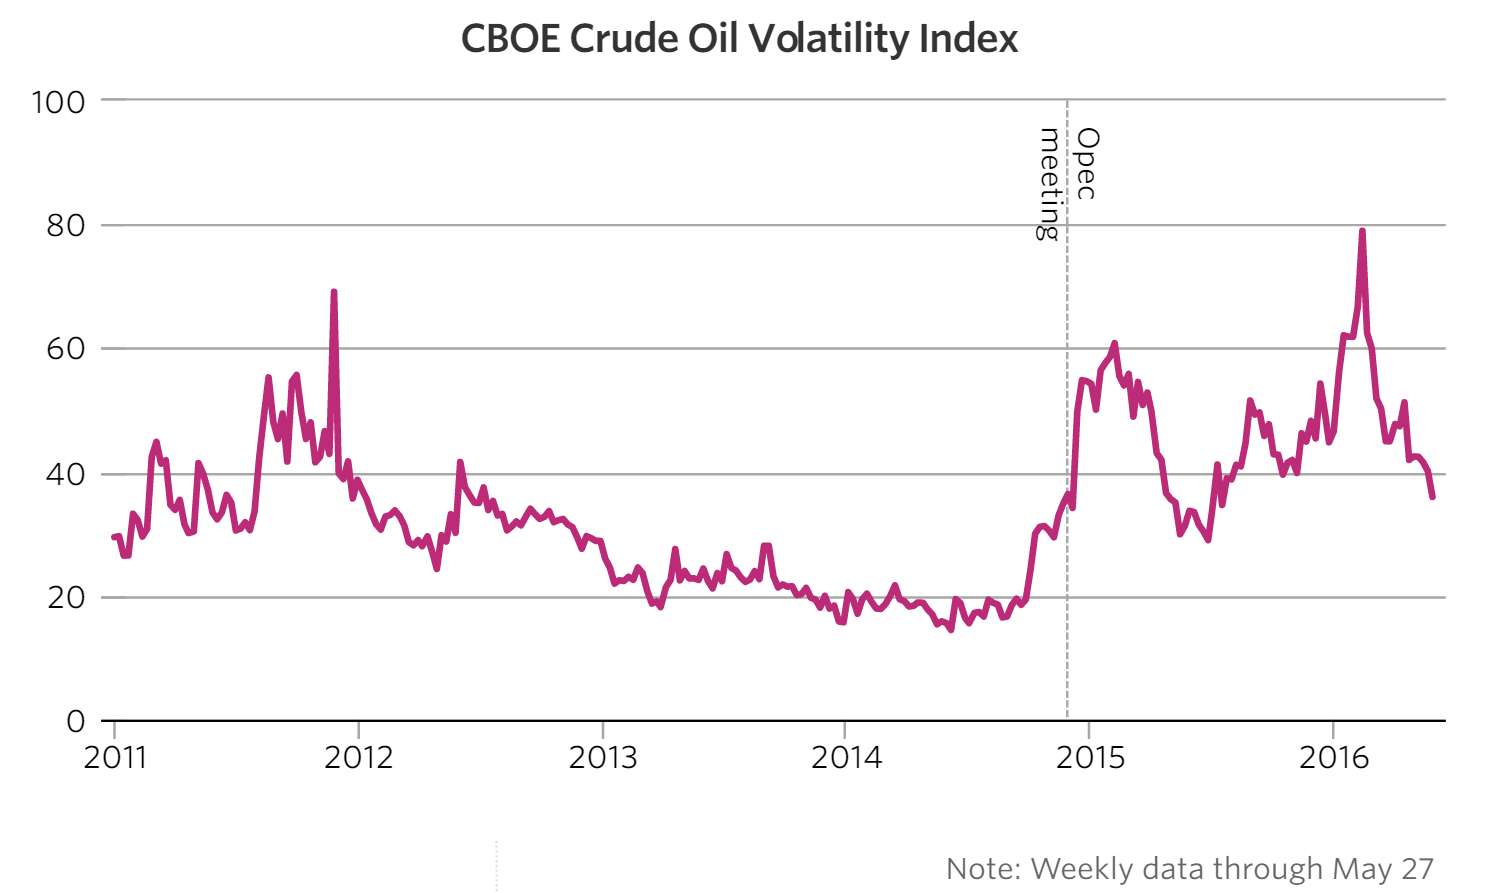
Price volatility is an innate feature of crude oil markets. But volatility began a sharp ascent following OPEC’s decision not to adjust production levels in 2014 amid swelling global supplies (Wall Street Journal).
OPEC is often maligned as a cartel, a group that manipulates prices for its own profit. But OPEC has played a crucial, if under-appreciated role in ensuring price stability in the market. Its decision to abandon that role in November 2014 ushered in a new era of volatility.
Volatility spiked several times since then, rising higher when prices crash. Two large spikes stand out – March 2015 when prices dropped to the $40s, and the January-February 2016 period when prices plunged below $30 per barrel.
The rally in crude prices since then has pushed down volatility. For weeks, WTI and Brent have traded in the upper-$40s, trading in a relatively stable band.
Nevertheless, it is striking that the calm in the oil markets we are seeing today still reflects much higher volatility compared to the years between 2012 and 2014.
5. OPEC doesn’t stick to its targets
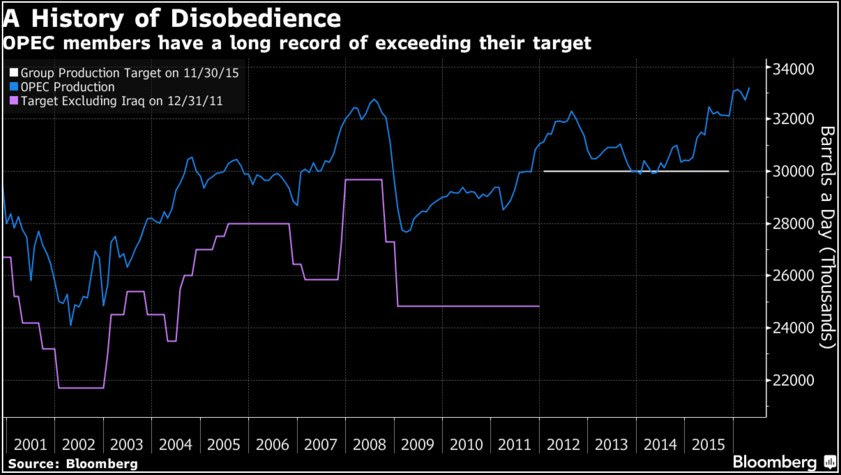
OPEC has played the role of market balancer for a long time, but it is important to remember that it routinely flouted its own production targets.
Every member has their own individual incentive to exceed production targets, hoping that other members will limit their output in order to prop up prices. The group never truly solved this collective action problem.
The burden of adjustment often fell on the shoulders of Saudi Arabia, the one country with a large ability to ramp up and down production at a moment’s notice.
Since 2011, OPEC members have ignored production targets more so than in previous years, which helps to explain the breakdown in trust and cooperation. By 2014, Saudi Arabia had grown tired of sacrificing by itself, and production sharply increased.
OPEC officially gave up on the increasingly meaningless production targets in December 2015. There have been rumors that Saudi Arabia is trying to persuade the group to restore its production targets, but for now, Iran appears unwilling to go along.
That’s it for this week’s Numbers Report. Thanks for reading, and we’ll see you next week. By ISA Intel, Oil & Energy Insider
On a broader scale, it seems the Commodities Rout isn’t quite over just yet. Read… How We’ll Know When to Buy This Hated Commodity.
Enjoy reading WOLF STREET and want to support it? You can donate. I appreciate it immensely. Click on the beer and iced-tea mug to find out how:

Would you like to be notified via email when WOLF STREET publishes a new article? Sign up here.
![]()
In a sea of speculation (two outfits 100% apart- 30 and 60) those tanker photos are solid evidence. It has to cost a bit to have a ship that size sit around.
If Draghi supplies the money though, then it’s good to have ships that size.
Negative rates. What’s not to like if you are the borrower?
“Who needs a functioning economy when we can essentially get free money for perpetually doing nothing productive, lulz.”
Indeed, that’s why I think the game still have a long ways to go. First they’ll argue that without these big businesses, the world will go to hell. The game ends when the muppets demand and receive their share of free money.
I’d like to see a pic from a month earlier for comparison though
It is just simply supply/demand or really nations dumping soon to be worthless credit-based paper currencies for stuff with inherent real value before the global credit musical chairs stops?
What I’d like to do is form a cartel that includes all the big, intermediate and most of the small producers and set a price target near the cusp of demand destruction.
All are welcome for admission into the cartel: OPEC, Saudi, Iran, Russia, frackers, tar sands…
I drive a 2001 Honda Civic standard 1.7 liter. It gets around 30-40 city hiway. I’m in Canada so tax is high- right now gas is 1.13 liter C$=- 3$ US a US gallon I guess.
What would the price have to be not to destroy my demand, but to get me thinking about trips?
It would have to at least double to 6 US (or so)
I don’t think there is the slightest chance of your gang of 40 thieves coming together but that is my demand ‘pain point’ for your calculations.
End-game
Posted on June 2, 2016
CRASH RISK, NEOLIBERALISM AND “SECULAR STAGNATION”
With their resigned but widening acceptance of “secular stagnation”, the powers-that-be are inching ever closer to a recognition that growth, at least as we have known it, isn’t going to return to previously-experienced levels. It seems a short step from “low growth” to “no growth at all” (which would not, of course, come as any great to surprise to the author of Life After Growth).
Indeed, when we factor-in the depressing effect of population expansion on per-capita GDP, even “secular stagnation” takes us into a new era.
Let’s reflect on what this means. Individuals can no longer assume that they are going to get better off over time, or that each generation will be more prosperous than its forebears. People and businesses can no longer take decisions on the assumption that wealth, or real asset values, or the size of the market, are going to keep getting bigger. Governments cannot plan on the basis of an expanding economy, or tax revenues that increase from year to year.
These are profound changes, not just in financial terms, but also in how we think about government and the economy.
That, and the importance of the subject, is why this discussion is longer than usual.
My aims here are as follows. The first is to look at the implications of a “low growth” (or even a “no growth”) economy. The second is to relate a slowing economy to a debt mountain that keeps getting bigger, and to ask what we are going to do about our debt burden now that we can no longer expect to “grow out of it”.
The latter question is the easier of the two to answer. I am more convinced than ever that a financial crash is inevitable. Moreover, I think we can begin to see, not only where it is likeliest to happen, but the form that it’s likeliest to take. As outlined later, we can now identify four directions from which the next crash is most likely to come.
As for the near-disappearance of growth, resulting changes are likely to include the ditching of the doctrine of economic “neoliberalism” and, as the price of failure, a further weakening of incumbent elites which already facing a popular backlash.
Low growth – the three causal factors
To start with, though, we need to examine why it is that growth has become so feeble. Once we are clear about the causes of weak growth, we can understand the role of theory and policy, and then move on to look at consequences.
Opinion is divided about why growth is so low. Some, even amongst the opinion-formers and decision-makers, are starting to question the efficacy of “neoliberal” economics. Sometimes known as “the Washington consensus” or “the Anglo-American model”, this doctrine has ruled the roost since it supplanted Keynesian economics in the 1970s. Of course, doubters in the upper echelons are few in number – so far, anyway – and most of them assert that neoliberal economics is solid and robust.
Well, to paraphrase Mandy Rice-Davies, “they would say that, wouldn’t they?”
The first cause of low growth is an escalating uptrend in the cost of energy. The key parameter here is the “energy cost of energy” (ECoE). As readers will know, energy is never “free”, but has a cost in terms of the amount of energy that is consumed for each unit of energy accessed.
Though market prices oscillate widely – largely in response to cyclical patterns – underlying trend ECoEs have been rising relentlessly for several decades, and have been acting as an increasingly heavy drag on growth since about 2000. In that year, according to SEEDS (the Surplus Energy Economics Data System), trend ECoE reduced GDP by about 4.2%, up from 2.8% a decade earlier but still small enough not to be noticed within normal margins of error when calculating economic output.
If you really want to understand why things are there way there are… I suggest you read the rest of this:
https://surplusenergyeconomics.wordpress.com/2016/06/02/72-end-game/
Well we could use some of the ‘oversupply’ here in Australia.
The price of gasoline here has shot up to A$1.349 a litre.
The all time high was a little over A$1.63 a litre or so………..that works out to about US$3.70 a gallon.
We use the price of Tapis crude as a base for prices here in Oz. Demand from China sets the prices we pay.
When the Tapis crude oil price falls under WTI you’ll know there is a real problem.
Until then we’ll just have to wait and see.
Re: “demand from China”: a change in rules in China allows “teapot refiners” (smaller privately owned refiners, rather than the big state-owned refiners) to import larger amounts of oil. Since there isn’t enough demand for these additional refined products (diesel, gasoline, etc) in China, they export them. Hence, strong oil imports and growing diesel and gasoline exports mostly to other Asian countries. Could this also impact the price of Tapis?
Wolf,
Don’t those teapots use mainly fuel oil as their feedstock?
Anyway, we now have gasoline at higher prices than diesel in Australia. For as long a I can remember diesel was always more expensive. People used to blame the demand from China as a reason.
It hasn’t happened very often, but when it did there was only a few cents difference.
This time diesel is 20 cents a liter cheaper than gasoline.
Go figure……
Like so many other aspects of markets these days, oil price looks far more like pure speculation than fundamentals. Starting back in March 2015, oil had fallen to the $45 handle but rebounded to $60 in June. There, futures traders hit a hard ceiling and kept smacking up against it for almost 3 months before capitulating. With no where but down, oil fell to a low of $26.05 and proceeded to crawl back up. Now it seems to be hitting a $50 ceiling and hasn’t had any luck getting much above it before being quickly smacked down again. I’m not sure if this level will hold but even if it somehow manages to continue higher, it’ll have an impossible task getting past $60 w/o a production cut from OPEC. My inclination is that $50 will hold and after a month or two of making no progress, oil’s destined to fold again and is headed back to mid or even low $20’s.
In current glut conditions I feel supply vs demand balance out around $30 but, just as speculation pushed it up higher than practical, it’ll likely dip well below that level for a bit. Long-term, an imminent dollar devaluation, OPEC cuts, wars and loss of petro-dollar dominance will bring an end to low oil – I personally believe it’s headed north of $200/bbl and we’ll look back at this as an opportunity of a lifetime. That said, I think we ‘could’ go through a brief deflationary period, if the US scares the hell out of the public by implementing NIRP and helicopter money. I’m a buyer at $30/bbl and will continue to pickup more for ‘every’ dollar it falls from there.
“Like so many other aspects of markets these days, oil price looks far more like pure speculation than fundamentals.”
It was no so long ago that basic speculation was illegal unless you were a part of the industry that the option was involved with or based on. Was it Clinton who ended that, can’t remember.
OPEC may well have goosed prices up but they still maintained the leach position not to kill the patient. I don’t see ‘modern’ speculation acting that way, all I see is take all you can and if it kills the patient, ‘so be it…not my problem’ .
Just because the oil and gas industries have driven up their own costs ( paying to much for land leases for example or getting into debt by buying more machinery than needed), is no reason for the consumer to be expected to carry or tolerate the cost burden. The consumer can act many times faster than the industry to cost reactions and alternatives to it. Gas at $3.00usd brought the economy to a standstill and people stayed home and missed work, that that was when folks had more money that what they have now. $2.00 gas got us to crawl again but where are we going now?
As I have written before, the bond market says little or no growth for a generation, just get out the old trusty ‘futures tables’ and look at the ‘value’ of money in 5, 10, or 30 years. More people/consumers is not an answer.
Without wealth creation ( I do not mean wealth from speculation) from real endeavor there is no advancement in growth, no excess income to spend. The human race at large, has run out of ‘gas’. The ‘gas’ to make the next ‘gotta have’, the next wheel, and worse the masses have realized that “kaizen” , rooted in Japanese that every day you work, you work to make yourself DO better, has no value in modern employment anywhere in the world. A machine waits to take your job. Just like busboys lined up at the back door of a restaurant, the worker has no value to the employer anymore than a $10 toaster. So how many gallons of gas is a toaster/machine going to buy?
A million apps for a phanseyphone is super, but that, for example, is not general wealth creation for the masses. And the masses is what we are referencing here, and the masses demand and use of energy. More poor people will not bring energy demand.
So all this demand is coming from whom?
Everybody keeps talking about deflation but gas has gone up 25% in the last 3 months. The prices in the discount stores have gone up in the same period. I was waiting for a Memorial Day sale to buy some furniture and instead of a sale, I got a 10% price increase. Where’s all this deflation, I can’t point to any prices going down, and I can’t afford most of the things I need.
So, actually the article boils down to “Some say yes, some say no.” I think it serves the Saudis’ interest to have the oil price hang around $50/bbl. Fairly profitable for them given their low production costs and still unprofitable for US shale producers.
I also think one of the wildcards missing in many of the positive slant oil market analysis articles is that every day that passes we have better production histories for the shale wells. In my opinion, this is a negative for the shale oil operators. First, I expect investors to wait for a tangible sign that prices have stabilized above a realistic profit point before coming back to the table. My second belief is that real production histories showing the dramatic drawdowns of these wells will make it much harder for the operators to hype shale as the be all and end all that bamboozled investors into funding the Red Queen operations.
Iran will continue increasing output, as will Iraq as the situation stabilizes and ISIS is snuffed out. Watch out for a peace deal to break out in Libya. Keep an eye on Mediterranean natural gas coming online next year.
Cheap oil is great for low cost air travel and low cost energy production, a gift to energy importing nations.
The “DUC” inventory is not as large as they’d have you believe, at least in relation to normal times. You don’t drill a horizontal well and then complete it immediately even in the best of times. There is typically a 1 to 2 month lag between finishing drilling and then completing it. Really, you should track this inventory historically versus rig count and look for the anomaly today to gauge the true effective number of DUCS.
And how many DUCs there was 12 months ago? Some companies have no money to drill, and have no more of these wells in inventory. Maybe people can guess what happens to them at that point.
It seems to me the stage has been set for the price of oil to drop. Oil’s supply chain does not react quickly to changes in demand. The offshore stack-up is a leftover from incorrect assumptions about demand along with a general hope in the market for a price re-bound.
It’s been clear for some time now there is a global manufacturing slowdown (aka RECESSION), so how in the hell can oil’s price go up or stay where it is?
Oil is the most manipulated future after silver. I am sure it was just as hard on Mexico to have the price for its crude(it had it then) to go from 150$ to 35$ in four months(Sept.-Dec. 2008) as for Iran to have a similar thing happen. I am sure someone made money or a political point.
And this is what the beginning of the end of oil looks like.
Low prices = collapse of the industry
High prices = collapse of the global economy
The UK’s oil and gas industry will lose a total of 120,000 jobs by the end of this year as a result of the market downturn which has slashed value from the struggling sector since mid 2014.
Official figures from trade group Oil and Gas UK have laid bare the full impact of the historic decline in oil market prices. The global price crash has taken a particularly worrying toll on the ‘supermature’ North Sea basin which is saddled with some of the highest costs and lowest production levels in the world.
Oil prices have recovered by 80pc since hitting twelve year lows of $28 a barrel in January but even at a prevailing price of around $50 a barrel oil is worth less than half than what it did 2014 when North Sea jobs stood 450,000.
Last year the number of jobs supported by the UK’s oil and gas industry fell by an estimated 84,000 to around 370,000, and are forecast to fall a further 40,000 by the end of this year.
Companies across the breadth of the industry have been forced to make deep cuts to their job numbers in order to shore-up market-weakened balance sheets.
The UK’s largest oil companies, including Shell and BP, have posted record losses in the last year while smaller explorers wrestle with debilitating debt and the looming threat of insolvency. The risks facing oilfield service companies are particularly large because they rely on contracts with the cash-strapped producers for their own income.
Advisory firm EY warned that a third of oilfield service firms could be wiped out from the sector by the end of the year as oil producers pull back from uneconomic ventures.
Investment is expected to fall by almost 90pc this year as companies continue to slash spending and profitability has plunged to lows not seen since 1997.
The Office for National Statistics shows that explorers active in the UK Continental Shelf (UKCS) have seen the rate of return on their investments fall from just 2pc in the third quarter of last year to 0.6pc in the last quarter of 2015.
More: http://www.telegraph.co.uk/business/2016/06/09/oil-downturn-to-wipe-out-over-a-quarter-of-north-sea-jobs/