The aging pipeline system in the US wasn’t built for the fracking boom. Shale oil production has soared in some areas that are not well integrated into the pipeline network. Primary among them: North Dakota, now the second largest producing state in the US, after Texas. Hence the use of trains to transport crude oil. To the greatest satisfaction of the railroads, Warren Buffet, tank-car makers, tank-car leasing companies, and the like.
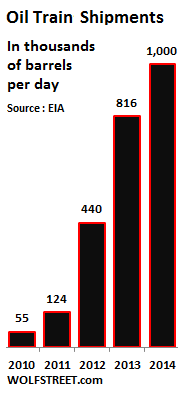
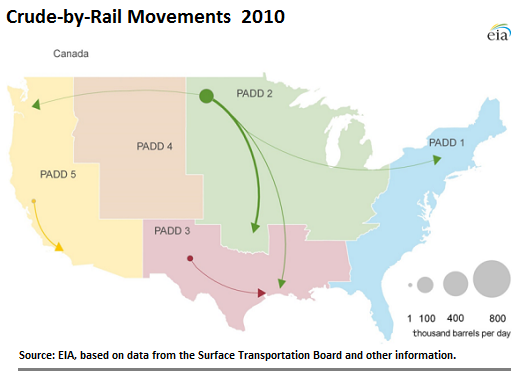
At first, say in 2010, it wasn’t a big deal. Only 55,000 barrels per day were shipped from the Bakken in North Dakota to other areas in the US. But as production in the Bakken soared, so did shipments by train, punctuated by derailments in Canada and the US that led to some horrific explosions and loss of life.
Now it is a big deal – including for the communities through which these trains rumble: oil train shipments in 2014 exceeded 1 million barrels per day, or about 11% of US oil production.
Oil trains had another quirk: the monthly petroleum supply statistics the Energy Department’s EIA collects and publishes included crude oil movements by pipeline, tanker, and barge. But not by oil train. So now, for the first time, the EIA is gathering oil-train data, which as it says, “dramatically reduces the absolute level of unaccounted for volumes” – emphasis by the EIA – in its monthly balances for each region.
So it just released its first “CBR” (crude by rail) data set for January, and time-series maps going back to 2010, when it all started in earnest.
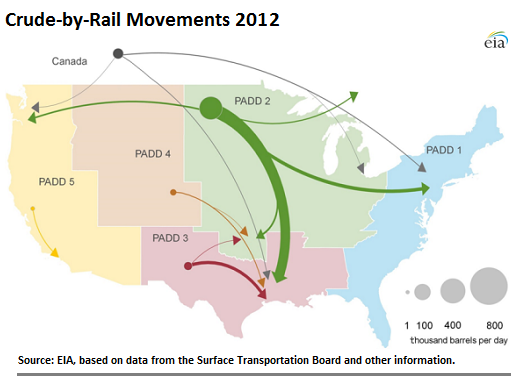
Turns out in January, 1,045,000 barrels per day were shipped by oil train to destinations in the US, of which 130,000 barrels per day originated in Canada and 704,000 barrels per day in PADD 2 (Petroleum Administration for Defense District), which includes the Bakken in North Dakota. Of that, 437,000 barrels per day were shipped to PADD 1 (East Coast).
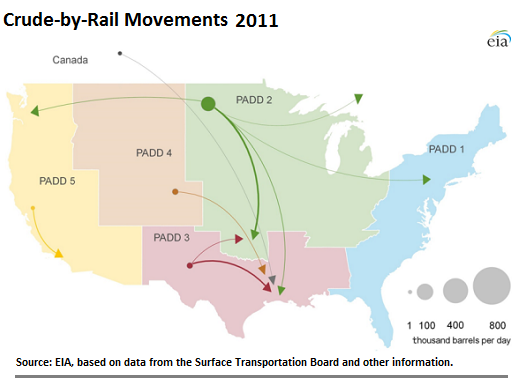
Below are the EIA’s time-series maps that show the movements annually from 2010 through 2014. Excluded are movements of less than 1,000 barrels per day and short-distance movements between rail yards within a region.
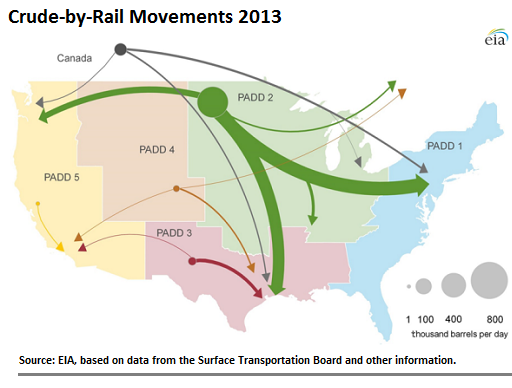
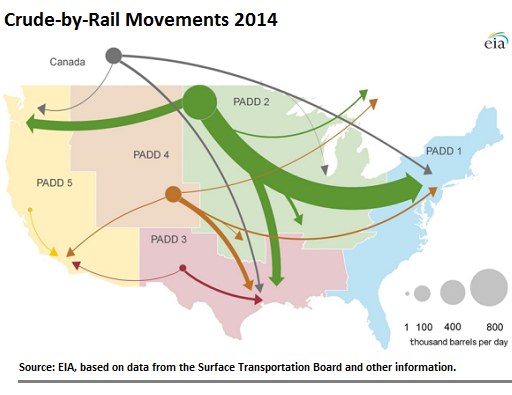
In 2014, growth in total oil-train movements backed off from the exponential trajectory of prior years, when shipments had doubled more or less from year to year. Last year, they “only” increased by 22% to 1 million barrels per day. The rate of growth is likely to slow further in 2015, or perhaps even grind to a halt later in the year, or so some people hope.
Bakken crude accounted for 70% of all oil-train shipment volumes last year. But Niobrara crude from PADD 4 gained in importance in 2014 and has become the second-largest origin for rail shipments. The dominant destinations were East Coast refineries. That’s a long haul from the Bakken, with plenty of derailments and fiascos waiting to happen.
But no additional headaches are needed: oil is already giving Wall Street and the American oil patch enough trouble. Read… Wall Street Banks Hit by Oil & Gas Defaults, Bankruptcies
Enjoy reading WOLF STREET and want to support it? You can donate. I appreciate it immensely. Click on the beer and iced-tea mug to find out how:

Would you like to be notified via email when WOLF STREET publishes a new article? Sign up here.
![]()
Intriguing data, Wolf. The routes did not surprise me as much as the volume.