The conundrum of stocks rising worldwide for years despite consistently disappointing growth (as in the US), sporadic bouts of negative growth interspersed with bouts of no growth (as in France), or outright steep recessions (as in a number of Eurozone countries) has turned rational investors into financial mincemeat.
Central-bank money printing and ZIRP appear to have been the only forces that pushed the markets up, a consensus that has by now spread far and wide, and investors – particularly money managers, if they wanted to keep their clients – had to grudgingly learn to forget about economic fundamentals; they simply haven’t mattered.
Now in the summary of his latest report, Michael Hartnett, Chief Investment Strategist at BofA-Merrill Lynch, has this piece of stunning wisdom for his clients:
I’m So Bearish, I’m Bullish
The first half of 2014 was a microcosm of the post-Great Financial Crisis era; the mantra of “I’m so bearish, I’m bullish” lived on as bearish economic news was overpowered by an aggressively bullish policy response; growth again disappointed … and assets prices rose.
Where are we in the “Melt-Up” trade?
Memo to self: always buy stocks & credit on a negative GDP print – since the Q1 lows SPX annualizing 37%, EEM 45%, SOX 75%. Our summer “melt-up” predicated on central banks “all in” but investors not yet “all-in.” Our sentiment indicators say investors still not yet “all-in.” Watch for weaker credit, weaker bank stocks, and a stronger dollar for signs that melt-up ending.
Is the Fed Losing the Dot?
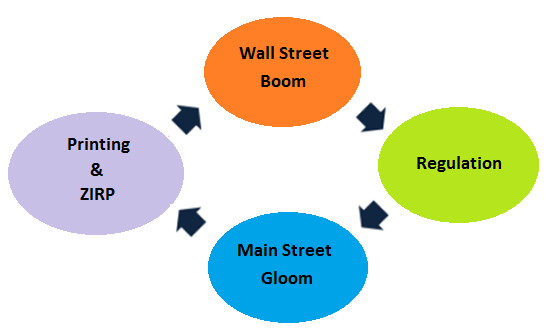
The Fed’s “print & regulate” mantra has boosted Wall St not Main St (see Chart below); the longer it takes for growth and rates to normalize, the greater the risk of speculative credit excesses (and a policy response to curb speculation). Our base case remains higher growth/yields/$. Bank lending & small business confidence hint at H2 macro & rate normalization. If so, expect an autumn correction in risk assets (hence “I’m so bullish, I’m bearish”). Either way, volatility will rise.
And the report presents a chart that looks like this – one of the most cynical charts from a bailed-out megabank I have ever seen, but it represents wonderfully the tangled-up thinking now standard on Wall Street, that mix of reality and surreality, with nearly 6 years of QE and ZIRP to back them up:
Whereupon Wolf Street contributor and megabank money-manager himself, Cali Money Man, groaned these words: “If this ends badly, I wonder how such reports will be read in hindsight. Mad?”
On Main Street, however, we have this reality: Many Americans spend every dime they make, and usually way beyond what they make. It’s not because they have confidence in the economy. They don’t! The gap in consumer confidence between these folks and those with higher incomes is at an all-time record high! Read…. This Chart Truly Depicts What’s Wrong With the ‘Recovery’ in America
Enjoy reading WOLF STREET and want to support it? You can donate. I appreciate it immensely. Click on the beer and iced-tea mug to find out how:

Would you like to be notified via email when WOLF STREET publishes a new article? Sign up here.
![]()