Natural gas and crude oil have historically traded in roughly a parallel manner, based on their energy content, as measured in British thermal units (Btu). But that relationship fell apart in 2006, thanks to the natural gas drilling boom that ended up driving the price of natural gas below the cost of production, while oil continued to rise (chart by the Atlanta Fed):
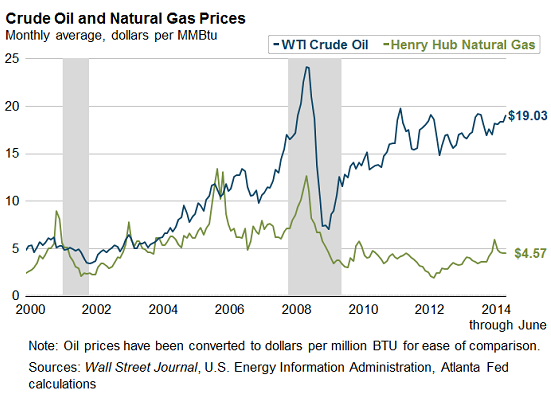
In June, prices of West Texas Intermediate crude oil (WTI), converted from barrel (volume) to Btu (energy content), averaged $19.03 per MMBtu, up 10.3% year-over-year; natural gas averaged $4.57 per MMBtu, up 19.6%.
That the energy contained in oil is over four times as expensive as the energy contained in natural gas has some reasons, but it’s unlikely that they will remain this far apart, long-term. So eventually, wouldn’t a rational market – if there is still such a thing in our rigged world – push up the price of natural gas to where it makes economic sense?
You bet. It is already happening. Drilling for dry gas has come to a crawl. The price has jumped 150% since its low in April 2012. The keyword is eventually – until supply is tight, as it will be this coming heating season. Than all heck can break loose.
The other option, or a simultaneous play? A collapse in the price of oil. Just like the fracking boom brought down the price of natural gas. Wouldn’t that be a doozie, that the two lines in the chart above meet somewhere in the middle? It would bring enormous bloodletting to the US shale revolution.
Read the next post in Econ Rumblings…. This Chart Shows the True Picture of the Jobs Crisis.
Enjoy reading WOLF STREET and want to support it? You can donate. I appreciate it immensely. Click on the beer and iced-tea mug to find out how:

Would you like to be notified via email when WOLF STREET publishes a new article? Sign up here.
![]()