A sadly familiar theme in the US—the growing ranks of the working poor—was fleshed out today. But the report, “Low-Income Working Families: The Growing Economic Gap,” did something else: it added graphic details to the conundrum of US healthcare spending. While it ballooned to $2.7 trillion, 17.9% of GDP, or $8,680 per capita, households have lowered their share. And so have businesses. What gives?
Despite improvements in the unemployment rate, 32.1% of all working households “may not have enough money to meet basic needs,” the report found. That was for 2011. In 2007, 28% of all families fell into that category. There are now 47.5 million low-income working families (earning less than 200% of the official poverty rate of $22,811 for a family of four). The report fingers in part the new job market. As people are finding jobs, they’re earning lower wages and have fewer benefits “compared with the middle-class jobs they held before.”
After housing expenses—81% of those below the official poverty level and 62% of low-income working families spent over 33% of their income on housing—and after day-to-day essentials, such as food and energy, little if any money remains for medical expenses.
But there is a parallel phenomenon: high-deductible health insurance plans linked to tax-advantaged IRA-like Health Savings Accounts. While deductibles range from $1,000 to $4,000 or more, the much lower premiums and tax savings can turn this into a bonanza for healthy people—if they keep their medical expenses down. The plans have taken off, much to the lament of healthcare providers. In 2006, only 10% of those with health insurance opted for a high-deductible plan; by 2012, their ranks had swollen to 34%!
These two large (and overlapping) groups—those who cannot spend more money on healthcare, and those who have a profit incentive not to—amount to a paradigm shift. They have lowered the household share of US healthcare spending. And it’s causing “unprecedented concerns” in the industry. But consumers aren’t the only players. This is the $2.7 trillion healthcare pie, a depiction of who pays what:
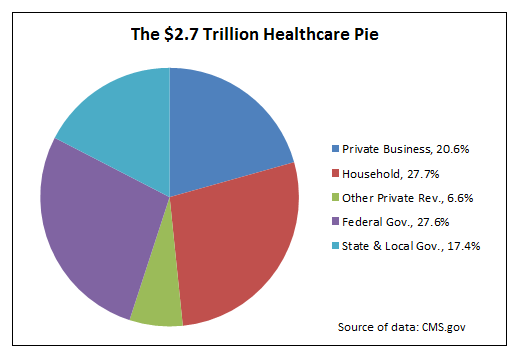
In 2011, households paid for 27.7% of all health care expenses—insurance premiums, out-of-pocket expenses, and supplementary premiums paid to Medicare. Year after year, they spent more than they’d spent the year before. But overall healthcare spending ballooned even faster, and as households were no longer able or willing to play along, they cut their share of overall healthcare spending.
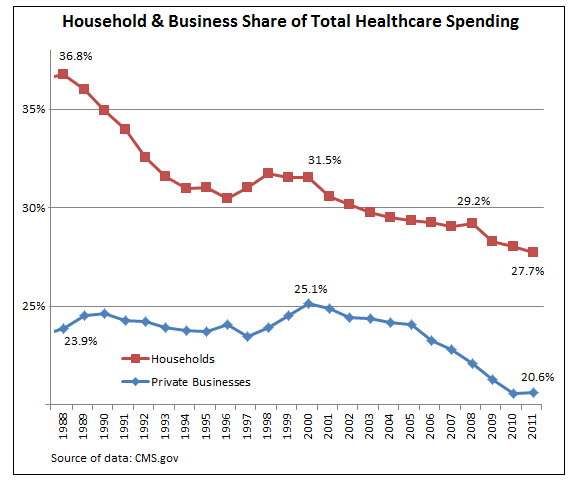
In 1988, households paid for 36.8% of the total healthcare pie. Then their share declined, except for a slight rise during the late 1990s. The down trend was flattening out when the financial crisis hit. Layoffs washed over the land. Households axed healthcare expenses, cutting their share from 29.2% in 2008 to 28.3% in 2009. Despite a “recovery” in the job market, their share continued to drop, reaching a low of 27.7% in 2011.
Businesses, too, spent more year after year in absolute terms, but unlike consumers, their share edged up, particularly during the dot-com bubble. But when the bubble burst, the tightening began in earnest, reducing the business share from 25.1% in 2000 to 20.6% in 2011.
What gives? Consumers and businesses, responsible for over 60% of healthcare spending in 1988, have cut their combined share to 48%. Somebody had to pick up the difference. Well, yes. Governments. Particularly through Medicare and Medicaid.
The share of state and local governments edged up from 15% in 1988 to 16.4% in 2010 but then jumped to 17.4% in 2011. The share of the federal government rose from 15.9% in 1988 to a whopping 27.6% in 2011. Though that’s down from 28.3% in 2010!
The two groups, namely households and businesses, that had incentives—ranging from sheer survival to more profit—to push back against the healthcare industry, and that had at least some ability to do so, did. But government entities, subject to special-interest lobbying, went hog-wild. Greatest beneficiary: the healthcare industry. Over the years, it became the largest industry and one of the most powerful lobbies in the country.
But 17.9% of GDP may be more than the economy can bear—a glass ceiling of sorts. And healthcare spending has remained stuck there since 2009.
Now Congress might weigh in. Further limits on how much Medicare and Medicaid can pay for certain services or medications, or serious efforts to root out waste and fraud, might actually, perhaps for the first time ever, reduce the healthcare industry’s share of the economy—a dreadful thought for the industry. And it will do everything in its might to keep that from happening.
Enjoy reading WOLF STREET and want to support it? You can donate. I appreciate it immensely. Click on the beer and iced-tea mug to find out how:

Would you like to be notified via email when WOLF STREET publishes a new article? Sign up here.
![]()